Transcription
2015/9/22Measurement, Scaling and QuestionnaireDesign Concepts, constructs and variables Measurements and scales Fundamentals and comparative scalingNoncomparative scaling techniques Likert scale, semantic differential, etc. Questionnaire and Form Design Questions and scale types Questionnaire design process Structure, wording Respondent characteristics and ability Improving response rateCopyright 2010 Pearson Education, Inc. publishing as Prentice Hall8-1Definitions and Concepts Independent variables are variables or alternatives that aremanipulated and whose effects are measured and compared, e.g.,price levels. Test units are individuals, organizations, or other entities whoseresponse to the independent variables or treatments is beingexamined, e.g., consumers or stores. Dependent variables are the variables which measure the effectof the independent variables on the test units, e.g., sales, profits,and market shares. Extraneous variables are all variables other than theindependent variables that affect the response of the test units,e.g., store size, store location, and competitive effort (to bemeasured and controlled, even after randomization).Copyright 2010 Pearson Education, Inc. publishing as Prentice Hall8-21
2015/9/22Validity in Experimentation Internal validity refers to whether themanipulation of the independent variables ortreatments actually caused the observed effectson the dependent variables. Control of extraneousvariables is a necessary condition for establishinginternal validity. External validity refers to whether the causeand-effect relationships found in the experimentcan be generalized. To what populations, settings,times, independent variables, and dependentvariables can the results be projected?Copyright 2010 Pearson Education, Inc. publishing as Prentice Hall8-3Measurement and Scaling:Fundamentals andComparative Scaling(Like in all sciences and fields, we need tomeasure concepts and variables, for bothsecondary data and primary data you collect!)Copyright 2010 Pearson Education, Inc. publishing as Prentice Hall8-42
2015/9/22Chapter Outline1) Overview2) Measurement and Scaling3) Scales Characteristicsi.Descriptionii. Orderiii. Distanceiv. OriginCopyright 2010 Pearson Education, Inc. publishing as Prentice Hall8-5Chapter Outline4) Primary Scales of Measurementi.Nominal Scaleii. Ordinal Scaleiii. Interval Scaleiv. Ratio Scale5) A Comparison of Scaling TechniquesCopyright 2010 Pearson Education, Inc. publishing as Prentice Hall8-63
2015/9/22Chapter Outline6) Comparative Scaling Techniquesi.Paired Comparisonii. Rank Order Scalingiii. Constant Sum Scalingiv. Q-Sort and Other Procedures7) Verbal Protocols8) International Marketing Research9) Ethics in Marketing Research10) SummaryCopyright 2010 Pearson Education, Inc. publishing as Prentice Hall8-7Measurement and ScalingMeasurement means assigning numbers or othersymbols to characteristics of objects according tocertain pre-specified rules. One-to-one correspondence between thenumbers and the characteristics beingmeasured.The rules for assigning numbers should bestandardized and applied uniformly.Rules must not change over objects or time.Copyright 2010 Pearson Education, Inc. publishing as Prentice Hall8-84
2015/9/22Scale CharacteristicsDescriptionBy description, we mean the unique labels ordescriptors that are used to designate each valueof the scale. All scales possess description.OrderBy order, we mean the relative sizes or positionsof the descriptors. Order is denoted bydescriptors such as greater than, less than, andequal to.Copyright 2010 Pearson Education, Inc. publishing as Prentice Hall8-9Scale CharacteristicsDistanceThe characteristic of distance means thatabsolute differences between the scaledescriptors are known and may be expressed inunits (better be equal intervals).OriginThe origin characteristic means that the scale hasa unique or fixed beginning or true zero point.Copyright 2010 Pearson Education, Inc. publishing as Prentice Hall8-105
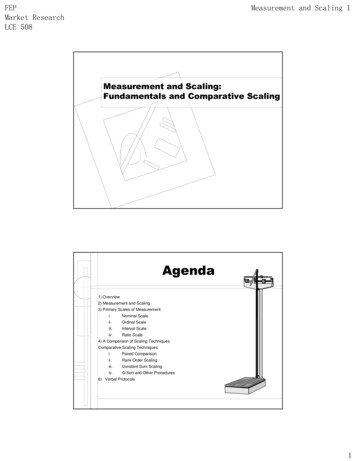
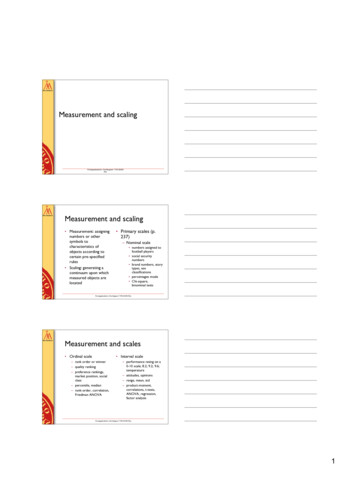
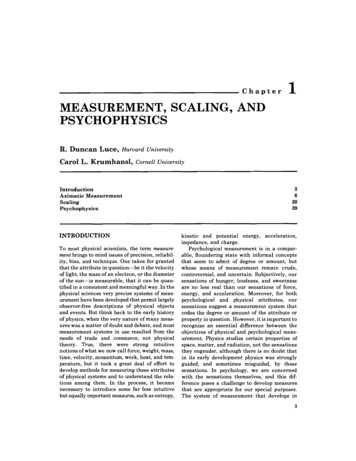
2015/9/22Measurement and ScalingScaling involves creating a continuum uponwhich measured objects are located.Consider an attitude scale from 1 to 100. Eachrespondent is assigned a number from 1 to 100,with 1 Extremely Unfavorable, and 100 Extremely Favorable. Measurement is the actualassignment of a number from 1 to 100 to eachrespondent. Scaling is the process of placing therespondents on a continuum with respect to theirattitude toward department stores. (But peoplecan seven bits of information at a time – thus 7point scale is the most popular)8-11Copyright 2010 Pearson Education, Inc. publishing as Prentice HallPrimary Scales of MeasurementScale Fig. 8.1NominalNumbersFinishAssignedto RunnersOrdinal783Rank Orderof WinnersIntervalPerformanceRating on a0 to 10 ScaleRatioTime to Finishin 113.4Copyright 2010 Pearson Education, Inc. publishing as Prentice HallFirstplace8-126
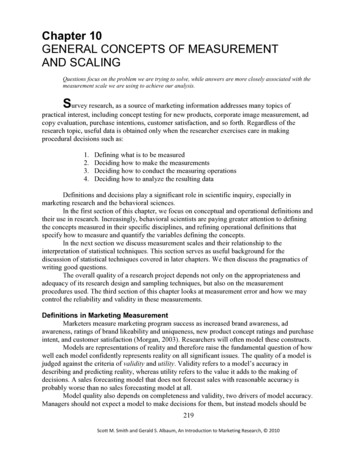
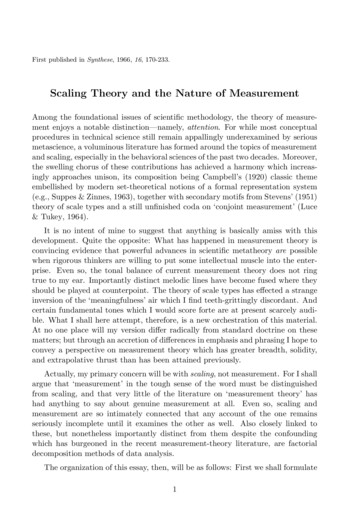
2015/9/22Primary Scales of MeasurementNominal Scale The numbers serve only as labels or tags foridentifying and classifying objects (no high vs. low,better vs. worse). When used for identification, there is a strict one-toone correspondence between the numbers and theobjects. The numbers do not reflect the amount of thecharacteristic possessed by the objects. The only permissible operation on the numbers in anominal scale is counting. Only a limited number of statistics, all of which arebased on frequency counts, are permissible, e.g.,percentages, and mode.Copyright 2010 Pearson Education, Inc. publishing as Prentice Hall8-13Illustration of Primary Scales of MeasurementTable 8.2NominalScaleOrdinalScaleIntervalScaleNo. ale spent last3 months11-171. Parisian2. Macy’s3. Kmart4. Kohl’s5. J.C. Penney6. Neiman Marcus7. Marshalls8. Saks Fifth Avenue9. Sears10.Wal-MartCopyright 2010 Pearson Education, Inc. publishing as Prentice Hall8-147
2015/9/22Primary Scales of MeasurementOrdinal Scale A ranking scale in which numbers are assigned toobjects to indicate the relative extent to which theobjects possess some characteristic. Can determine whether an object has more or less ofa characteristic than some other object, but not howmuch more or less (1st, 2nd .). Any series of numbers can be assigned that preservesthe ordered relationships between the objects. In addition to the counting operation allowable fornominal scale data, ordinal scales permit the use ofstatistics based on centiles, e.g., percentile, quartile,median (such as top ten percentile or the 1st decile).Copyright 2010 Pearson Education, Inc. publishing as Prentice Hall8-15Primary Scales of MeasurementInterval Scale Numerically equal distances on the scale represent equalvalues in the characteristic being measured. It permits comparison of the differences betweenobjects. The location of the zero point is not fixed. Both the zeropoint and the units of measurement are arbitrary. Any positive linear transformation of the form y a bxwill preserve the properties of the scale (can runcorrelations and regression!). It is not meaningful to take ratios of scale values. Statistical techniques that may be used include all ofthose that can be applied to nominal and ordinal data,and in addition the arithmetic mean, standard deviation,and other statistics commonly used in marketing8-16research.Copyright 2010 Pearson Education, Inc. publishing as Prentice Hall8
2015/9/22Primary Scales of MeasurementRatio Scale Possesses all the properties of the nominal, ordinal,and interval scales. It has an absolute zero point. It is meaningful to compute ratios of scale values. Only proportionate transformations of the form y bx, where b is a positive constant, are allowed. All statistical techniques can be applied to ratio data.Copyright 2010 Pearson Education, Inc. publishing as Prentice Hall8-17Primary Scales of MeasurementTable 8.1Copyright 2010 Pearson Education, Inc. publishing as Prentice Hall8-189
2015/9/22A Classification of Scaling TechniquesFigure 8.2Scaling redComparisonRankOrderConstant Q-Sort g Scales Rating ScalesSemanticDifferentialStapelCopyright 2010 Pearson Education, Inc. publishing as Prentice Hall8-19A Comparison of Scaling Techniques Comparative scales involve the directcomparison of stimulus objects. Comparativescale data must be interpreted in relative termsand have only ordinal or rank order properties. In noncomparative scales, each object isscaled independently of the others in thestimulus set. The resulting data are generallyassumed to be interval or ratio scaled.Copyright 2010 Pearson Education, Inc. publishing as Prentice Hall8-2010
2015/9/22Relative Advantages of Comparative Scales Small differences between stimulus objectscan be detected (relative to or in comparisonwith .). Same known reference points for allrespondents. Easily understood and can be applied. Involve fewer theoretical assumptions. Tend to reduce halo or carryover effectsfrom one judgment to another.Copyright 2010 Pearson Education, Inc. publishing as Prentice Hall8-21Relative Disadvantages of Comparative Scales Ordinal nature of the data Inability to generalize beyond thestimulus objects scaled.Copyright 2010 Pearson Education, Inc. publishing as Prentice Hall8-2211
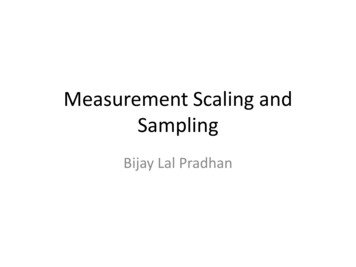
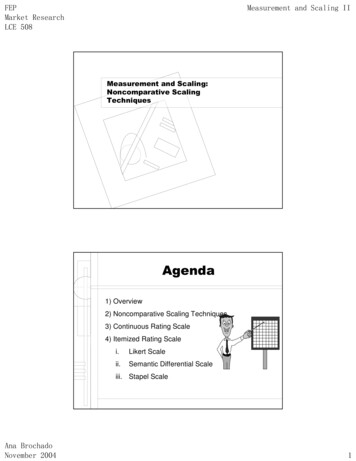
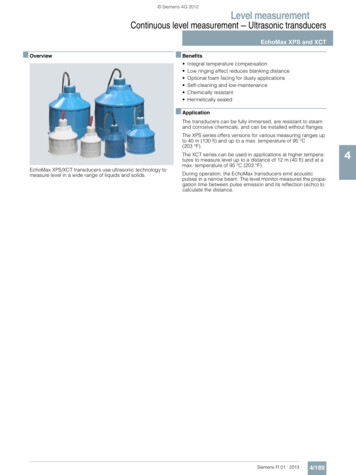
2015/9/22Comparative Scaling TechniquesPaired Comparison Scaling A respondent is presented with two objects andasked to select one according to some criterion. The data obtained are ordinal in nature. Paired comparison scaling is the most widelyused comparative scaling technique. With n brands, [n(n - 1) /2] paired comparisonsare required. Under the assumption of transitivity, it ispossible to convert paired comparison data to arank order.Copyright 2010 Pearson Education, Inc. publishing as Prentice Hall8-23Obtaining Shampoo Preferences Using PairedComparisonsFig. 8.3Instructions: We are going to present you with ten pairs ofshampoo brands. For each pair, please indicate which one of thetwo brands of shampoo you would prefer for personal use.Recording Form:aA 1 in a particular box means that the brand in that column was preferredover the brand in the corresponding row. A 0 means that the row brand waspreferred over the column brand. bThe number of times a brand waspreferred is obtained by summing the 1s in each column.Copyright 2010 Pearson Education, Inc. publishing as Prentice Hall8-2412
2015/9/22Paired Comparison SellingThe most common method of taste testing is paired comparison.The consumer is asked to sample two different products and selectthe one with the most appealing taste. The test is done in privateand a minimum of 1,000 responses is considered an adequatesample. A blind taste test for a soft drink, where imagery, selfperception and brand reputation are very important factors in theconsumer’s purchasing decision, may not be a good indicator ofperformance in the marketplace. The introduction of New Cokeillustrates this point. New Coke was heavily favored in blind pairedcomparison taste tests, but its introduction was less than successful,because image plays a major role in the purchase of Coke.A paired comparisontaste testCopyright 2010 Pearson Education, Inc. publishing as Prentice Hall8-25Comparative Scaling TechniquesRank Order Scaling Respondents are presented with several objectssimultaneously and asked to order or rank themaccording to some criterion. It is possible that the respondent may dislikethe brand ranked 1 in an absolute sense. Furthermore, rank order scaling also results inordinal data. Only (n - 1) scaling decisions need be made inrank order scaling.Copyright 2010 Pearson Education, Inc. publishing as Prentice Hall8-2613
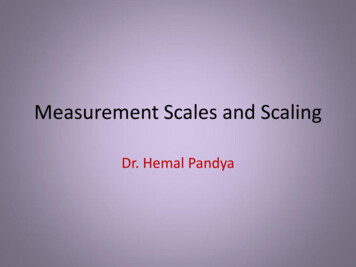
2015/9/22Preference for Toothpaste BrandsUsing Rank Order ScalingFig. 8.4Instructions: Rank the various brands of toothpaste inorder of preference. Begin by picking out the one brandthat you like most and assign it a number 1. Then find thesecond most preferred brand and assign it a number 2.Continue this procedure until you have ranked all thebrands of toothpaste in order of preference. The leastpreferred brand should be assigned a rank of 10.No two brands should receive the same rank number.The criterion of preference is entirely up to you. There is noright or wrong answer. Just try to be consistent.Copyright 2010 Pearson Education, Inc. publishing as Prentice Hall8-27Preference for Toothpaste BrandsUsing Rank Order ScalingFig. 8.4 cont.FormBrandRank Order1. Crest2. Colgate3. Aim4. Gleem5. Sensodyne6. Ultra Brite7. Close Up8. Pepsodent9. Plus White10. StripeCopyright 2010 Pearson Education, Inc. publishing as Prentice Hall8-2814
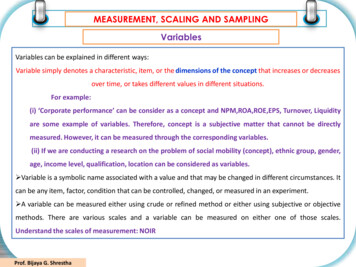
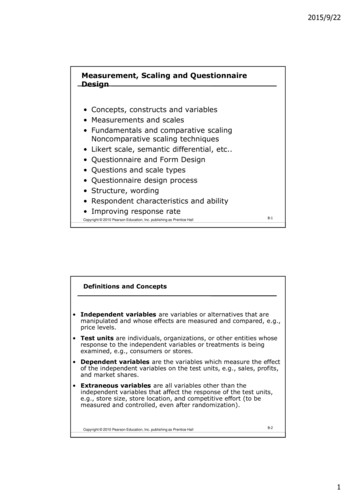
2015/9/22Comparative Scaling TechniquesConstant Sum Scaling Respondents allocate a constant sum of units,such as 100 points to attributes of a product toreflect their importance. If an attribute is unimportant, the respondentassigns it zero points. If an attribute is twice as important as someother attribute, it receives twice as many points. The sum of all the points is 100. Hence, thename of the scale.Copyright 2010 Pearson Education, Inc. publishing as Prentice Hall8-29Importance of Bathing Soap AttributesUsing a Constant Sum ScaleFig. 8.5InstructionsOn the next slide, there are eight attributes ofbathing soaps. Please allocate 100 points amongthe attributes so that your allocation reflects therelative importance you attach to each attribute.The more points an attribute receives, the moreimportant the attribute is. If an attribute is not atall important, assign it zero points. If an attributeis twice as important as some other attribute, itshould receive twice as many points.Copyright 2010 Pearson Education, Inc. publishing as Prentice Hall8-3015
2015/9/22Importance of Bathing Soap Attributes
Measurement and Scaling Scaling involves creating a continuum upon which measured objects are located. Consider an attitude scale from 1 to 100. Each respondent is assigned a number from 1 to 100, with 1 Extremely Unfavorable, and 100 Extremely Favorable. Measurement is the actual assignment of a number from 1 to 100 to each respondent. Scaling is the process of placing the