Transcription
COVER nsional databases model data as either facts, dimensions, ornumerical measures for use in the interactive analysis of large amountsof data for decision-making purposes.Torben BachPedersenChristian S.JensenAalborg Universityhe relational data model, which was introduced by E.F. Codd in 1970 and earned himthe Turing award a decade later, served as thefoundation of today’s multibillion-dollardatabase industry. During the past decade,the multidimensional data model emerged for usewhen the objective is to analyze data rather than toperform online transactions. Multidimensional database technology is a key factor in the interactive analysis of large amounts of data for decision-makingpurposes. In contrast to previous technologies, thesedatabases view data as multidimensional cubes thatare particularly well suited for data analysis.Multidimensional models categorize data either asfacts with associated numerical measures or as textualdimensions that characterize the facts. In the case of aretail business, a purchase would be a fact and the purchase amount and price would be measures; the typeof product being bought and the purchase time andlocation would be dimensions. Queries aggregate measure values over a range of dimension values to provideresults such as total sales per month of a given product. Multidimensional data models have three important application areas within data analysis.T Data warehouses are large repositories that integrate data from several sources in an enterprisefor analysis. Online analytical processing (OLAP) systems provide fast answers for queries that aggregate largeamounts of detail data to find overall trends. Data mining applications seek to discover knowledge by searching semiautomatically for previ40Computerously unknown patterns and relationships in multidimensional databases.Academic researchers have proposed formal mathematical models of multidimensional databases, whileindustry has implicitly specified proposals via the concrete software tools that implement them.1,2 The“Multidimensional Database History” sidebar describes the evolution of the multidimensional datamodel and how it has benefited from the use of semantic as well as scientific and statistical data models.SPREADSHEETS AND RELATIONSA spreadsheet such as that shown in Table 1 is a useful tool for analyzing sales data such as product sold,number of purchases, and city of sale. A pivot table isa two-dimensional spreadsheet with associated subtotals and totals that supports viewing more complexdata by nesting several dimensions on the x- or y-axisand displaying data on multiple pages. Pivot tablesgenerally support interactively selecting data subsetsand changing the displayed level of detail.Spreadsheets are an inadequate tool for managingand storing multidimensional data because they tie datastorage too tightly to the presentation—they do notseparate the structural information from the desiredviews of the information. Thus, adding a third dimension such as time or grouping the data into higher-levelproduct types requires a considerably more complexsetup. The obvious solution is to use a separate spreadsheet for each dimension, but this will work only to alimited extent because analyzing the additional valuesof the extra dimension quickly becomes unwieldy.0018-9162/01/ 17.00 2001 IEEE
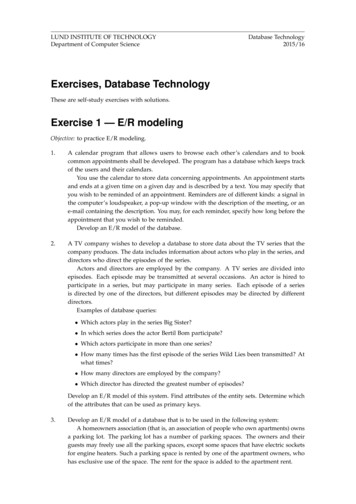
Multidimensional Database HistoryUsing a Structured Query Language database management system offers considerable flexibility in structuring data. However, formulating many desirablecomputations such as cumulative aggregates (sales inyear to date), combining totals and subtotals, or determining rankings such as the top 10 selling products isdifficult if not impossible in standard SQL. Also, transposing rows and columns requires manually specifying and combining multiple views. Although SQLextensions such as the data cube operator3 and querywindows4 will remedy some of these problems, theSQL-based relational model does not handle hierarchical dimensions satisfactorily.Spreadsheets and relational databases provide adequate support for a small volume of data that has onlya few nonhierarchical dimensions, but they do notfully support the requirements for advanced dataanalysis. The only robust solution is to use databasetechnology that offers inherent support for the fullrange of multidimensional data modeling.CUBESMultidimensional databases view data as cubes thatgeneralize spreadsheets to any number of dimensions.In addition, cubes support hierarchies in dimensionsand formulas without duplicating their definitions. Acollection of related cubes comprises a multidimensional database or data warehouse.Because dimensions in a cube are first-class, builtin concepts with associated domains, cubes can easilymanage the addition of new dimension values.Although the term implies three dimensions, a cubecan theoretically have any number of dimensions; infact, most real-world cubes have four to 12 dimensions.5,6 Current tools often experience performanceproblems when a so-called hypercube contains morethan 10 to 15 dimensions.Combinations of dimension values define a cube’scells. Depending on the specific application, the cellsin a cube range from sparse to dense. Cubes tend tobecome sparser as dimensionality increases and as thedimension values’ granularities become finer.Figure 1 shows a cube capturing the sales for thetwo Danish cities in Table 1 with the additionaldimension of time. The corresponding cells store thenumber of sales. The example has a fact—a nonemptycell that contains a number of associated numericalmeasures—for each combination of time, product,and city where at least one sale was made. The cellsstore numerical values associated with a fact—in thiscase, the number of sales is the only measure.Generally, a cube supports viewing only two or threedimensions simultaneously, but it can show up to fourlow-cardinality dimensions by nesting one dimensionwithin another on the axes. Thus, cube dimensionality is reduced at query time by projecting it down toMultidimensional databases do not have their origin in database technology but stem from multidimensional matrix algebra, which has beenused for manual data analysis since the late nineteenth century.During the late 1960s, IRI Software and Comshare independentlybegan developing what later became multidimensional database systems. IRI Express, a popular tool for marketing analysis in the late 1970sand early 1980s, became a market-leading online analytical processingtool and was acquired by Oracle. Concurrently, the Comshare systemdeveloped into System W, which saw heavy use for financial planning,analysis, and reporting during the 1980s.In 1991, Arbor Software, now Hyperion Solutions, was formed withthe specific purpose of creating a multiuser, multidimensional databaseserver, which resulted in the Essbase system. Arbor later licensed a basicversion of Essbase to IBM for integration into DB2.In 1993, E.F. Codd coined the term OLAP.1 Another significant development in the early 1990s was the advent of large data warehouses,which are typically based on relational star or snowflake schemas, anapproach that uses relational database technology to implement multidimensional databases.In 1998, Microsoft shipped its MS OLAP Server, the first multidimensional system aimed at the mass market, and now multidimensionalsystems are becoming commodity products, shipped at no extra costtogether with leading relational database systems.Reference1. E.F. Codd, S.B. Codd, and C.T. Salley, “Providing OLAP (On-Line Analytical Processing) to User-Analysts: An IT Mandate,” http://www.hyperion.com/solutions/whitepapers.cfm (current Nov. 2001).Table 1. Sample sales spreadsheet.ProductAalborgMilkBreadJeansLight bulbsNumber of purchases by cityCopenhagen Los Angeles New York 001Figure 1. Sample cube capturing sales data. Data cubes support viewing of up to fourlow-cardinality dimensions simultaneously. In this case, the cube generalizes thespreadsheet from Table 1 to three dimensions.December 200141
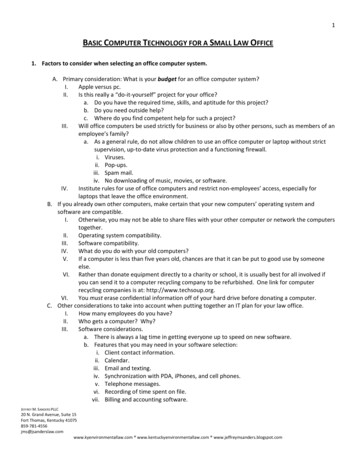
LocationTCountryTUSADenmarkCity Los Angeles New York Aalborg CopenhagenFigure 2. Sample schema and instances of the locationdimension. Every dimension value is part of the T value.2D or 3D by aggregating the measure values in the projected-out dimensions, resulting in higher-level measure values for the desired data view. For example, toview sales by city and time, we aggregate over the entireproduct dimension for each combination of city andtime. Thus, in Figure 1, adding 127 and 211 yields thetotal sales for Copenhagen in 2001.DIMENSIONSDimensions are an essential and distinguishing concept in multidimensional databases. An importantgoal of multidimensional modeling is to use dimensions to provide as much context as possible for facts.5In contrast to relational databases, controlled redundancy is generally considered appropriate in multidimensional databases if it increases the data’s information value. Because multidimensional cube datais often derived from other sources—for example, atransactional relational system—rather than being“born” in the multidimensional cube, the redundancyproblems related to updates can be managed morereadily.5 There is usually no redundancy in the facts,only in the dimensions.Dimensions are used for selecting and aggregatingdata at the desired level of detail. A dimension is organized into a containment-like hierarchy composed ofnumerous levels, each representing a level of detailrequired by the desired analyses. Each instance of thedimension, or dimension value, belongs to a particular level.It is sometimes advantageous for multidimensionalmodels to define multiple hierarchies for a dimension—for example, the model can define time as bothfiscal year and calendar year. Multiple hierarchiesshare one or more common lowest levels—for example, day and month—and the model groups them intomultiple levels higher up—fiscal quarter and calendarquarter—to allow easy reference to several ways ofgrouping. To avoid duplicating definitions, the cubeor multidimensional database metadata defines thedimension hierarchy.42ComputerFigure 2 shows the schema and instances of a sample location dimension for the sales data in Table 1. Ofthe location dimension’s three levels, City is the lowest.City-level values are grouped into country-level values—for example, Aalborg and Copenhagen are inDenmark. The T level represents all of a dimension.In some multidimensional models, a level has anumber of associated properties that hold simple, nonhierarchical information. For example, the packagesize can be a level property in the product dimension.A package-size dimension could also capture thisinformation. Using the level property does not increasethe cube’s dimensionality.Unlike the linear spaces used in matrix algebra, multidimensional models typically do not include ordering or distance metrics for the dimension values.Rather, the only ordering is that higher-level valuescontain lower-level values. However, for some dimensions such as time, an ordering of the dimension values is used to calculate cumulative information suchas total sales to date. Most models require dimensionhierarchies to form balanced trees—the hierarchymust have uniform height everywhere, and each nontop value has precisely one parent.FACTSFacts represent the subject—the interesting patternor event in the enterprise that must be analyzed tounderstand its behavior. In most multidimensionaldata models, facts are implicitly defined by their combination of dimension values; a fact exists only if thereis a nonempty cell for a particular combination of values. However, some models treat facts as first-classobjects with a separate identity. Most multidimensional models also require mapping each fact to onevalue at the lowest level in each dimension, but somemodels relax this mapping requirement.1Each fact has a certain granularity determined by thelevels from which its combination of dimension valuesis drawn—for example, the fact granularity of the cubein Figure 1 is year by product by city. Granularities consisting of higher- or lower-level dimension values than agiven granularity—such as year by type by city and dayby product by city—are coarser or finer, respectively.Data warehouses commonly include three types offacts:5 Events, at least at the finest granularity, typicallymodel real-world events, with one fact representing the same instance of an underlying phenomenon. Examples include sales, clicks on aWeb page, or movement of goods in and out ofa warehouse. Snapshots model an entity’s state at a given pointin time, such as store and warehouse inventorylevels and the number of Web site users. The same
instance of the underlying real-world phenomenon—such as a specific can of beans on a shelf—may occur in several facts at different points intime. Cumulative snapshots handle information aboutactivity up to a certain moment. For example, thetotal sales up to and including the current monththis year can be easily compared to the figure forthe corresponding month last year.Because they support complementary classes of analyses, a given data warehouse often contains all threetypes of facts. Indeed, the same base data—for example, the movement of goods in a warehouse—can beincluded in three different types of cubes: warehouseflow, inventory, and flow in year to date.MEASURESA measure consists of two components: a fact’s numerical property, such as the sales priceor profit; and a formula, usually a simple aggregation functionsuch as sum, that can combine several measurevalues into one.In a multidimensional database, measures generallyrepresent the properties of the fact that the user wantsto optimize. Measures then take on different valuesfor various dimension combinations. The propertyand formula are chosen t
Multidimensional databases do not have their origin in database tech-nology but stem from multidimensional matrix algebra, which has been used for manual data analysis since the late nineteenth century. During the late 1960s, IRI Software and Comshare independently began developing what later became multidimensional database sys-tems. IRI Express, a popular tool for marketing analysis in the .