Transcription
Measurement Scaling andSamplingBijay Lal Pradhan
Measurement and Scaling1)Definition of measurement and scale2)Type of Physical scalei.Nominal Scaleiii. Interval scaleii.Ordinal Scaleiv. Ratio Scale3) Need of scaling4) Criteria of good scaling5) Validity and Reliability of scale and its test6) Percentile and ranking scaleBijay Lal Pradhan, M Sc Statistics,FDPM (IIMA)2
Measurement and ScalingMeasurement means assigning numbers or other symbols tocharacteristics of objects according to certain prespecifiedrules.– One-to-one correspondence between thenumbers and the characteristics being measured.– The rules for assigning numbers should bestandardized and applied uniformly.– Rules must not change over objects or time.
Measurement and ScalingScaling involves creating a continuum upon which measuredobjects are located.Consider an attitude scale from 1 to 100. Each respondent isassigned a number from 1 to 100, with 1 ExtremelyUnfavorable, and 100 Extremely Favorable. Measurement isthe actual assignment of a number from 1 to 100 to eachrespondent. Scaling is the process of placing the respondentson a continuum with respect to their attitude towarddepartment stores.
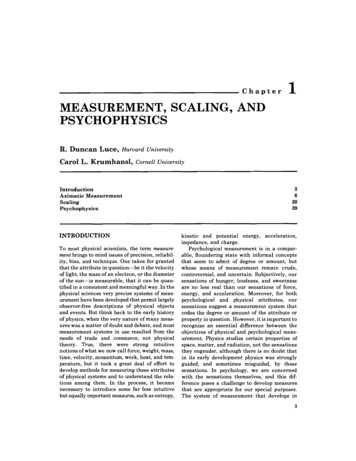
Types of Scales Nominal - Identification only– Ex (players numbers, male 1 female 0) Ordinal -Ranking– Ex (grades?) SEI score Interval –Ranks and distinguishes intervals– Ex (temperature) Ratio – absolute quantities– Ex (weight, degrees Kelvin)
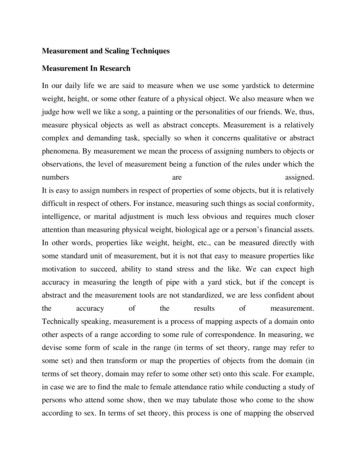
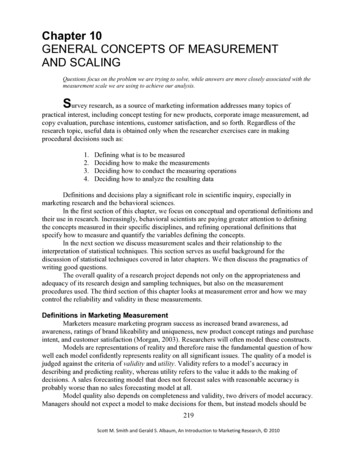
Physical dto RunnersRank Orderof erformanceRating on a0 to 10 Scale8.29.19.6RatioTime to Finish, inSeconds15.214.113.4
Nominal Scale The numbers serve only as labels or tags for identifying andclassifying objects. When used for identification, there is a strict one-to-onecorrespondence between the numbers and the objects. The numbers do not reflect the amount of the characteristicpossessed by the objects. The only permissible operation on the numbers in a nominalscale is counting. Only a limited number of statistics, all of which are based onfrequency counts, are permissible, e.g., percentages, andmode.
Ordinal Scale A ranking scale in which numbers are assigned to objects toindicate the relative extent to which the objects possess somecharacteristic. Can determine whether an object has more or less of acharacteristic than some other object, but not how muchmore or less. Any series of numbers can be assigned that preserves theordered relationships between the objects. In addition to the counting operation allowable for nominalscale data, ordinal scales permit the use of statistics based oncentiles, e.g., percentile, quartile, median.
Interval Scale Numerically equal distances on the scale represent equalvalues in the characteristic being measured. It permits comparison of the differences between objects. The location of the zero point is not fixed. Both the zero pointand the units of measurement are arbitrary. Any positive linear transformation of the form y a bx willpreserve the properties of the scale. It is meaningful to take ratios of scale values. Statistical techniques that may be used include all of thosethat can be applied to nominal and ordinal data, and inaddition the arithmetic mean, standard deviation, and otherstatistics commonly used.
Ratio Scale Possesses all the properties of the nominal, ordinal, andinterval scales. It has an absolute zero point. It is meaningful to compute ratios of scale values. Only proportionate transformations of the form y bx, whereb is a positive constant, are allowed. All statistical techniques can be applied to ratio data.
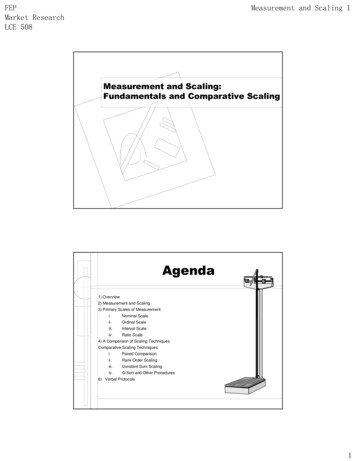
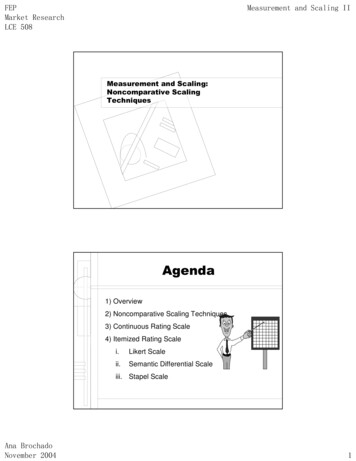
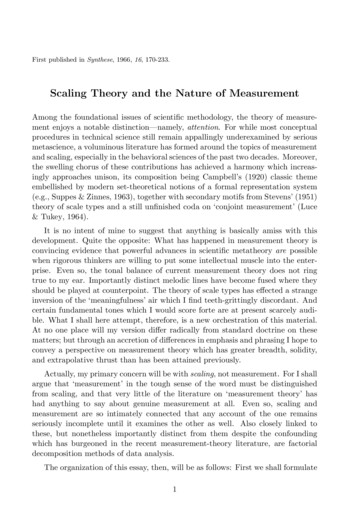
Primary Scales of amplesCharacteristicsNumbers identify Social Security& classify objects nos., numberingof football playersNos. indicate the Quality rankings,relative positions rankings of teamsof objects but not in a tournamentthe magnitude ofdifferencesbetween themDifferencesTemperaturebetween objects (Fahrenheit)Zero point is fixed, Length, weightratios of scalevalues can becomparedExamplesPermissible StatisticsDescriptiveInferentialBrand nos., store Percentages,Chi-square,typesmodebinomial testPreferencePercentile,rankings, market medianposition, tudes,opinions, indexAge, sales,income, costsProductmomentCoefficient ofvariationRange, mean,standardGeometricmean, harmonicmean
Criteria of good measurement Reliability: Since a grocer obtain the truemeasure of a commodity by a kilogram, acloth merchant obtains true length of cloth bya meter, these measuring instruments have tobe reliable. Kilogram and meter always givethe same result when they used formeasuring commodity. In research also themeasure has to be reliable.Bijay Lal Pradhan, M Sc Statistics,FDPM (IIMA)12
RELIABILITY The degree to which measures are free from randomerror and therefore yield consistent results Stability and consistency with which theinstrument measures the concept and helps toassess the goodness of a measure. Maintains stability over time in themeasurement of a concept. Two important dimensions of reliability: (a)stability and (b) consistency
a. Stability of Measures Ability of the measure to remain the same overtime. It attests to the “goodness” of measurebecause the measure of the concept is stable,no matter when it is applied. Two tests of stability: (1) test-retest reliability,and (2) parallel-form reliability
1. Test-Retest Reliability: Administering the same test to the samerespondents at two separate times Use instrument for measuring job satisfaction at . Satisfied 64%. Repeat after 4 weeks.Same results. Hi stability. Reliability coefficient obtained with repetition ofthe same measure on second occasion.Correlation between two scores.
Three problems with test-retestIt is a longitudinal approach. So:1. The first test may sensitize the respondentsso effect on second measure2. Time may help change the attitude. Alsomaturation of the subjects.3. The respondent may think a fresh on thequestions and give true and accurate answer.Hence the results may not show highcorrelation.
2. Parallel-Form Reliability Also called equivalent-form reliability. When responses on two comparable sets ofmeasures tapping the same construct are highlycorrelated. Both forms/sets have similar items, sameresponse format. Change thewording/ordering. Minimum error variance caused by wording,ordering, or other factors Parallel form reliability correlation betweentwo form of an instrument.
b. Internal Consistency of Measures Indicative of the homogeneity of the items inthe measure. Items should ‘hang together as a set,’ Each item be capable of independentlymeasuring the same concept. Examine if the items and subsets of items inthe instrument are highly correlated. Two ways to do it.
1. Inter-item Consistency Reliability(Rational Equivalence Method) Test of consistency of respondents’ answers toall items in a measure. To the degree that items are independentmeasures of the same concept, they will becorrelated.
2. Split-Half Reliability Reflects the correlation between twohalves of an instrument. One half could be of even numbered itemsand other half of odd numbered items. High correlation tells us about similarityamong items
Validity The ability of an instrument to measure whatis intended to be measured. Validity of the indicator Is it a truemeasure? Are we tapping the concept? Degree of fit between a construct and itsindicators.Bijay Lal Pradhan, M Sc Statistics,FDPM (IIMA)21
Researchers ask questions: Do colleagues agree with my measurement? Does my measure correlate with others’measures of the same concept? Does it really measure what is expected tomeasure?The answers provide some evidence of themeasure’s validity.
Validity If you wish to find out about age, income,height or weight The effectiveness of a program, serviceprovided by organization Tengible concept like effectiveness, attitudeor satisfaction etc Need to ask several questions in order tocover different aspect of conceptBijay Lal Pradhan, M Sc Statistics,FDPM (IIMA)23
Types of Validity 1. Content validity 2. Criterion-related validity 3. Construct validity
1. Content Validity: Each question or item on the scale must havea logical link with an objective Each item and question must cover the fullrange of the issue or attitude beingmeasured.
Content Validity Items that are supposed to measure a concept, doon the face look like they measure the concept.For example: Measure a college student’s math ability ask:2 2 ? Not a valid measure of college level mathability. Subjective agreement among professionals aboutthe measuring content.
Content ValidityProblems: The judgment is based upon subjective logic,hence, no definite conclusion can be drawn.Different people may have different opinion. The validity or its extent may vary with thequestions selected for an instrument.Bijay Lal Pradhan, M Sc Statistics,FDPM (IIMA)27
2. Criterion-Related Validity Uses some standard or criterion to indicate aconstruct accurately. Compare the measure with another acceptedmeasure of the same construct.
3. Construct Validity Used for measures with multiple indicators. Do various indicators operate in consistentmanner? How well the results obtained from the use of themeasure fit the theories around which the test isdesigned? This is assessed through (a)convergent and (b) discriminant validity.
a. Convergent Validity Multiple indicators of a concept converge orare associated with one another. Multiple indicators hang together, oroperate in similar ways. For example, wemeasure “education” as a construct.
Construct “education” Ask the level of education completed. Verify the certificates. Give a test measuring school level knowledge. If the measures do not converge i.e. People claimingcollege degree but not supported by college records, orthose with college degree perform no better than hischool drop-out on the test. The outcome of each does not converge. Weakconvergent validity. Do not combine the three indicatorsinto one measure.
b. Discriminant Validity Divergent validity. Indicators of one concept hang together orconverge, but also diverge or are negativelyassociated with opposing constructs. If two constructs A and B are very different thenmeasures of A and B should not be associated. Example of political conservatism.
Measuring political conservatism We have 10 questions to measure P C. People answer all 10 in similar ways. We put 5 additional questions that measureliberalism. Two scores are theoretically predicted to bedifferent and are empirically found to be so. If the 10 conservatism items hang together andare negatively associated with 5 liberalism ones. It has discriminant validity
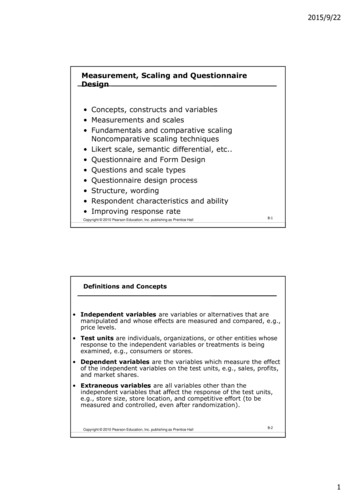
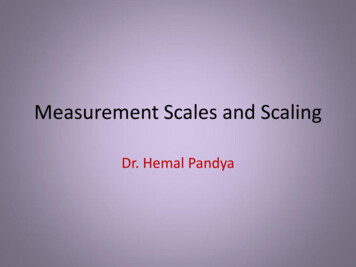
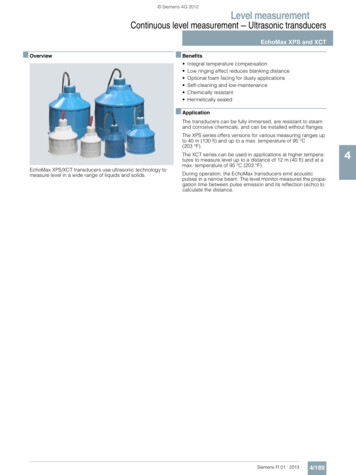
Reliability and Validity on Target
Difficulties of Scaling1. Social phenomenon is complex and cannoteasily measured quantitatively. The mainproblem is comes in defining a phenomenon.2. There are no universally accepted measures ofvalues.3. Since attitude of persons often differ, A scaleprepared for a particular group is not oftensuitable for another.35
Difficulties of Scaling4. Most of the social phenomenon is intangible innature which cause difficulty in measuringvalidity of the scale.5. It is not possible to measure the magnitude ofvarious variables influencing the socialphenomenon without the knowledge of thesecausative factors, the scaling becomes only aguesswork.36
Measuring attitude (example) Attitude of student towards a Lecturer– Organization of materials– Lecturer’s ability to communicate material– The presentation style– Knowledge of the subject– Responsiveness– PunctualityBijay Lal Pradhan, M Sc Statistics,FDPM (IIMA)37
Difficulties in Attitudinal Scale Which aspects of a situation or issue shouldbe included when seeking to measure anattitude? What procedure should be adopted forcombining the different aspects to obtain anoverall picture? How can one ensure that a scale really ismeasuring what it is supposed to measure?Bijay Lal Pradhan, M Sc Statistics,FDPM (IIMA)38
Likert Scale Self- report technique for attitude measurement inwhich the subjects are asked their degree ofagreement and disagreement with each ofstatements. The summing score is the total attitude score, is theLikert scale. Example– Most people can be trusted.– Strongly agree5 Agree4 Undecided3Disagree2 Strongly disagree1 Any body select 1 to 5Bijay Lal Pradhan, M Sc Statistics,FDPM (IIMA)39
Likert Scale Take other similar items- to find out general attitudeof indication Add the total score- the top 25% - the mostfavourable attitude and bottom 25%- the leastfavourable attitude toward the topic being studied; Assumption – Each statement on the scale has equalattitudinal value, importanceBijay Lal Pradhan, M Sc Statistics,FDPM (IIMA)40
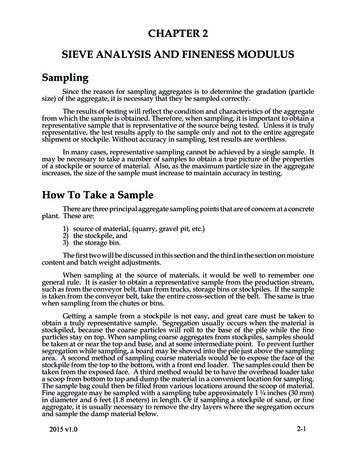
Likert Scale exampleStronglyAgreeThe LecturerAgreeUncertainDisagreeStronglyDisagree1. Knows subject well2. Is unenthusiastic about teaching3. Shows concern for students4. Makes unreasonable demands5. Has poor communication skills6. Knows how to teach7. Can explain difficult concepts insimple terms8. Is hard to approach9. Is liked by some students and not byothers10. It is difficult to get along withBijay Lal Pradhan, M Sc Statistics,FDPM (IIMA)41
Procedure Assemble or construct statements that are reflective ofattitude towards the main issue in question. Statementsshould be worded to reflect both positive and negativeattitudes towards issue. The statements must have logical linkwith the main issue. Administer the statements to a small group of people. Analyse the responses by assigning a weighting – a numericalvalue – to the responses. Numerical value are assigneddifferently to positive a
04.10.2013 · Measurement and Scaling Scaling involves creating a continuum upon which measured objects are located. Consider an attitude scale from 1 to 100. Each respondent is assigned a number from 1 to 100, with 1 Extremely Unfavorable, and 100 Extremely Favorable. Measurement is the actual assignment of a number from 1 to 100 to each respondent. Scaling is the process of placing the