Transcription
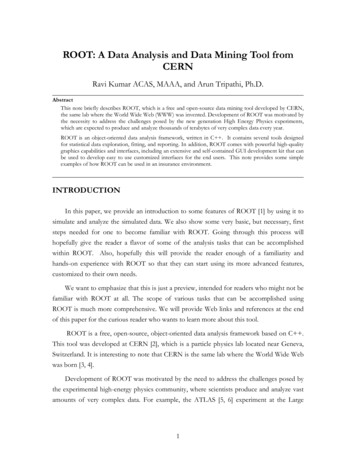
Proceedings of the International MultiConference of Engineers and Computer Scientists 2014 Vol II,IMECS 2014, March 12 - 14, 2014, Hong KongPractical Root Cause Analysis Using CauseMappingDarren York, Kai Jin, Qing Song, Hua Li Abstract— Failures in global competitive markets have beenproved to be costly and sometimes devastate an organization.One way to reduce the loss is to investigate their causes andprevent them from reoccurring. Root Cause Analysis (RCA) isa useful way to achieve this goal. There are three commonbarriers that need to be overcome in order for RCA to beeffectively used. This paper provides an overview of RCA, andapplies a commonly used RCA tool, Cause Mapping, in a casestudy from the refining industry to present the effectiveness ofCause Mapping in eliminating these three barriers. This casestudy shows that Cause Mapping is an efficient, effective andeasy-using method.Index Terms— Cause Mapping, Quality Control, Refinery,Root Cause AnalysisI. INTRODUCTIONIn order to be success with its business, everyorganization is interested to prevent failure in their operationor products. When a machine or a piece of equipment is outof service, there are always reverse consequences andtypically maintenance programs and strategies are designedand implemented to minimize and eliminate downtimes,especially unplanned downtimes. It has been estimated thatthe typical average downtime cost associated with astandalone machine is 500 per hour, and with theintroduction of lean manufacturing strategies, those costhave soared to 1,500 to 8,500 per hour for a cell or line ofmachines and for an entire auto factory line the estimatesskyrockets to 3,500 per minute or 210,000 per hour [1].The realization quickly comes that such failures can have aprofound impact on an organization’s competitiveness,especially in the widening global economy.The cost of such unexpected downtimes provides thenecessary incentive to determine the cause(s) and learn fromfailure in order to prevent them from recurring. However, itmust be recognized that money and resources are required toinvestigate and analyze the failure. Therefore, the realquestion becomes, “How do you reduce the investment costin determining the cause(s) of failures?” The main goal is tomake easy, fast while reliable investigation, analysis andprovide the solution. Root cause analysis is an effectivemethod to achieve this goal. Root cause analysis (RCA) is asystematic, causational analysis which focuses on seekingthe lowest level of cause of the failure. There are howeverthree barriers for effective cause analysis that must beovercome to realize this investment reduction. First of all,many of the methods and tools for RCA are complex anddifficult to use which in turn makes them lessfrequently.used, more time consuming and more difficult topropagate throughout the organization to maximize learningfrom failures. Secondly, many RCA methods or toolsrequire special software applications that foster limitedaccess and an upfront capital investment. Last, somemethods or tools require adherence to a very rigid structurethereby limiting creativity and introducing the possibility ofmissing or short cutting the actual root cause(s).Although there are many different types of failures, suchas physical accidents or injuries, production errors,procedures not followed, and systems failures, this paperemploys equipment failures as the basis of discussion. Inthis paper, the authors will focus on the Cause Mappingmethod and discuss a case study from refinery industry indetail. This case study will show that Cause Mapping is anefficient, effective and easy-using method.II.REVIEW OF ROOT CAUSE ANALYSISRoot cause analysis has a wide variety of applications andan extensive history that has generated a considerable list ofdifferent tools and methods. The distinction between a tooland a method of RCA might well be, as Gano [2] points out,that “a tool is distinguished by its limited use, while amethod may involve many steps and processes and has wideusage.”With this distinction and some generalcategorization, the RCA tools and methods can be moreeasily understood. Most RCA tools and methods can becategorized into one of the following three categorical types:(1) Charting Types that are constructed in a “flow chart”style form with defined meanings for each shape. Some ofthese tools and methods are programmatically generatedwhile others can simply be drawn by hand, (2) TabularTypes that are constructed primarily in tables withpredefined column headings and categories, and (3)Graphical Types that display data results in a bar graph orsome other graphical representation of numeric data. Table1 details some of the many RCA tools and methods andclassify them into the above three categories. Table 1 alsoshows the evaluation of those methods and tools using thethree main barriers to effective usage as the criteria. Thisevaluation is based on the implementation experiences,literature review, and case study observation.Darren York, Kai Jin (phone: 361-593-2003; fax: 361-593-4126; e-mail:kai.jin@tamuk.edu), Qing Song, Hua Li are with Texas A&M University Kingsville, Kingsville, TX 78363.ISBN: 978-988-19253-3-6ISSN: 2078-0958 (Print); ISSN: 2078-0966 (Online)IMECS 2014
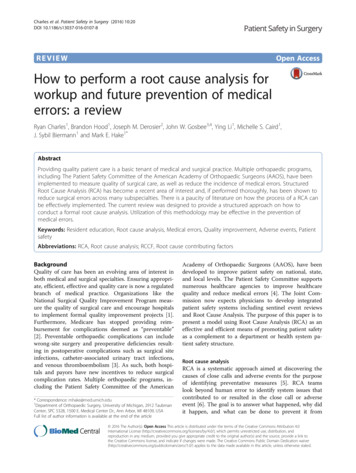
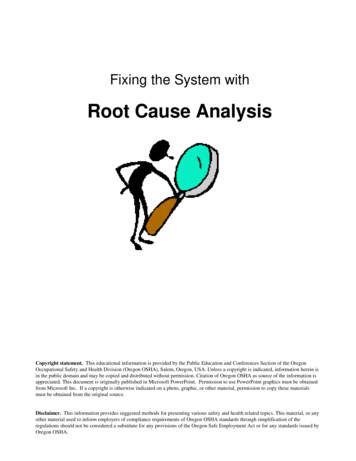
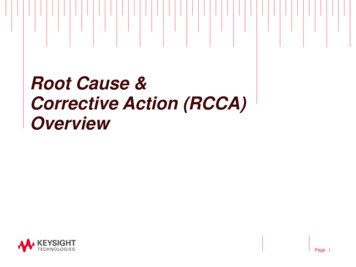
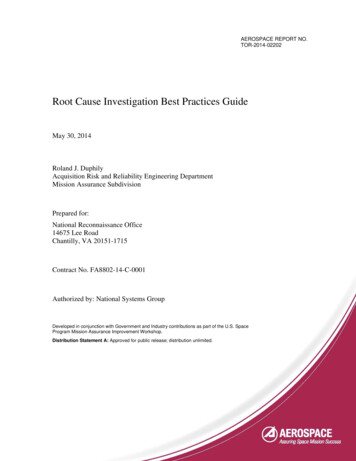
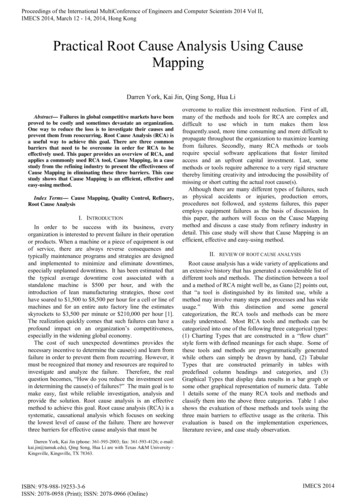
Proceedings of the International MultiConference of Engineers and Computer Scientists 2014 Vol II,IMECS 2014, March 12 - 14, 2014, Hong KongTABLE IComparison of different RCA methods and tools [1-6]Method / ToolCHARTINGEvents & CausalFactorsTree DiagramFault TreeRealityCharting Cause Mapping Fishbone DiagramAffinity DiagramPROACT MORTRelations DiagramFlow ChartsTapRooT Level ofDifficulty to wLowNoNoLowLowIII.TABULAR5-Whys (Why-Why)FMEATask AnalysisControl BarrierAnalysisChange AnalysisGRAPHICALPareto (80/20)HistogramFig. 1. Cause map structure.Cause Mapping is the trademarked method of root causeanalysis of ThinkReliability and can be categorized as acause-and-effect chart or diagram. This method does notemploy any specific terminology or acronyms and is basedon the premise that the “root” is actually a system of causesand not a singular cause [7]. Cause Mapping is based onthree fundamental concepts [7]: (1) System Thinking,which means that every system has parts that interact; (2)Cause-and-Effect, which is as stated the cause-and-effectprinciple meaning every effect has causes and every causehas an effect; and (3) Visual Communication, whichindicates the combination of words, images and shapes tocommunicate the relationships among effects, causes andsolutions. Functionally, the Cause Mapping methodconsists of three steps: (1) Define the problem, whichmeans simply outlining the what, when, where, and howgoals were impacted; (2) Perform the analysis by creatingthe Cause Map beginning with the impact to goals andworking from left to right by asking “why?” and “what isrequired to produce this effect?” to construct the horizontaland vertical cause and effect relationships as well asdocumenting and supporting evidence; and (3) Derive theSolutions by determining first “what is possible?”, then“what is best?” and lastly by defining the action plan thatassociates a cause with an action item, assigns ownershipand prescribes a due date for completion. The solutions areincluded in the map with the associated cause as well as intabular format along with the action item elements. Some ofthe other recognizable characteristics of a Cause Map, asillustrated by Figure 1, are that it is read from left to right,connects the problem(s) to an organization’s goals, andfocuses on evidence-based causes.ISBN: 978-988-19253-3-6ISSN: 2078-0958 (Print); ISSN: 2078-0966 (Online)CASE STUDYThe case study was undertaken in a United Statesrefinery. The failure to be analyzed is a Crude VacuumTower Bottoms Box Cooler that experienced threesuccessive product pass tube failures within a nineteen dayperiod, which resulted in the equipment being removed fromservice for repairs and requiring logistical feedstock changesto accommodate the box cooler outage. The box coolerfunctions to cool the crude unit’s vacuum tower bottoms(VTB) stream prior to being sent to storage. The boxcooler’s design is a steel box that contains a series of fourpipes, installed inside the box that carries the hot product.The box contains cooling water and the hot product carriedin the submerged pipes is cooled as the heat is transferred tothe cooling water. The box cooler is also equipped withsteam sprayers on each of the four passes to provide heat inthe event the product temperature falls below thetemperature required to maintain product flow through thepasses.The failures that occurred were holes which developed inthe carbon steel piping that carry the product through thebox cooler, as shown in Figure 2. The first failure occurredon the third pass and it was isolated and locked out. Twodays later, pass four developed a leak and was isolated andlocked out. The final failure occurred seventeen days laterand it was also isolated and locked out leaving only one passfor VTB cooling. As a result, repairs for the box cooler wereplanned and executed over an eighteen day outage that costmore than 600,000.In the first step of RCA, the problems to be analyzed haveto be defined. The problem that occurred may impact thefactory or organization in different aspects. In this casestudy, problems were categorized into three different types:(1) Production-Schedule impacts, where the company lostraw material margin on the optimal crude purchase toaccommodate vacuum bottoms’ minimization duringequipment repair outage. (2) Property-Equipment impacts,that the company replaced all four passes, performed patchwork on floor, shell and joints. (3) Labor-Time impacts, thatthe company recruited contract labor and internal labor forthe repair work.IMECS 2014
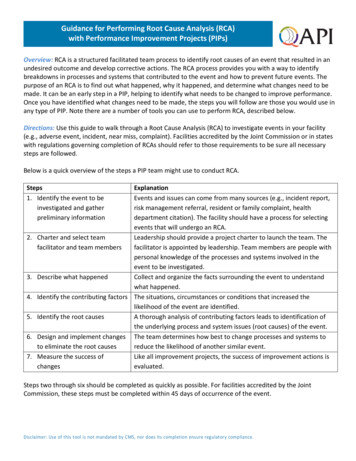
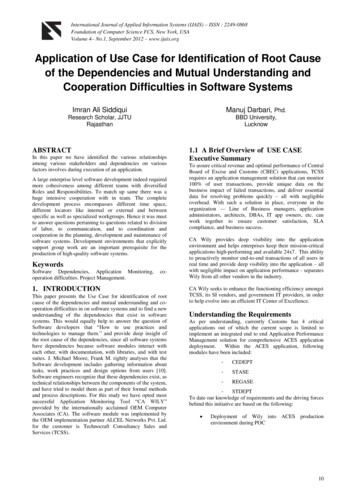
Proceedings of the International MultiConference of Engineers and Computer Scientists 2014 Vol II,IMECS 2014, March 12 - 14, 2014, Hong KongTABLE IIDetailed problem definitionWhatWhenFig. 2. Holes in the pipes.WhereThe construction of the Cause Map diagram began withthe identified impacted goals of production loss, propertyand labor. The basic level Cause Map was created workingfrom the impacted goals backward to the general eventcause by asking five simple “Why” questions similar to the“5-Whys” technique of root cause analysis, as shown inFigure 3.Fig. 3. Basic level cause map.Based on the preliminary cause map, the detailed CauseMap was then constructed from by asking more “Why”questions and “What is necessary for ” questions to fill inthe details between the general elements of the basic map.The evidence and solutions were added to each causalelement. The initial version of the Cause Map as developedwas subsequently emailed to those interviewed for feedbackand then reviewed with the plant reliability manager.Following the reliability manager’s suggestion the map waspushed to a deeper level of causation to include all of thecorrosion elements for carbon steel submerged in water. TheCause Map was finalized including photos taken during therepair and inspection process along with the action list andthe insertion of the electronic copies of the originaldocuments into the Excel file and was shared again with theinvolved personnel and filed electronically for futurereference.The final problem definition part of the Cause Map of thiscase study is shown in Table II. We can easily see thatunusual failures occurred in a very short period in March2009, with clear explanation. The economic loss due to thefailure summed to 1,634,300. We should be able to save alarge amount of money if we can find the root cause to theproblem and prevent this happening again.The coats outside the deepest cause of the problem werestripped off step by step by asking “why”. In the end, eightroot causes were drawn from the analysis process and thesolutions to these eight items were given in Table III.ISBN: 978-988-19253-3-6ISSN: 2078-0958 (Print); ISSN: 2078-0966 (Online)Crude Vacuum Residual Box Cooler Pass Leaks March 5, 2009 through March 24, 2009 Pass 3 leak determined via isolated nitrogentest 3/5/2009. Pass isolated. Pass 4 leak determined via isolated nitrogentest 3/7/2009. Pass isolated. Pass 2 leak determined via isolated nitrogentest 3/24/2009. Pass isolated. Box Cooler removed from service 5/9/2009. Refinery, USA Crude Unit: Equipment #: XXXX, MFRSerial #: XXXX Each leak occurred on the bottom row ofeach pass located on the same side as theinlet and outlet vertical piping on the lowerportion of the piping approximately 2' to 3'north of the return bend. Equipment was in normal operation with noother concurrent activity.Impact to the GoalsCost ProductionScheduleProperty,Equip, MtlsLabor & TimePotential raw materialmargin impact due toproductcontaminationwithanunplannedshutdown of Mid CrudeUnit without cooler box inservice or limited to asingle pass due to inabilityto cool slop streams backto crude tanks. Potential raw materialmargin impact due todelayed or prevented startup of Mid Crude Unitwithout cooler box inservice or limited to asinglepassanddownstream unit impacts. Lost raw material marginon optimal crude purchaseto accommodate vacuumbottomsminimizationduring equipment repairoutage.Replace in kind all four passes,perform patch work on floor,shell and joints and install 3/8inch carbon steel plate under oldfloor.Contract Labor and InternalLabor for repair work.Total Cost 912,400 337,500 384,400 1,634,300For the purpose of this study the Cause Mapping rootcause analysis method will be evaluated on the three criteriadiscussed in section 2 and they are the level of difficulty touse, proprietary software required, and creative level.Because the cause mapping method is very easy toimplement, the level of difficulty
Root Cause Analysis (RCA) is a useful way to achieve this goal. There are three common barriers that need to be overcome in order for RCA to be effectively used. This paper provides an overview of RCA, and applies a commonly used RCA tool, Cause Mapping, in a case study from the refining industry to present the effectiveness of Cause Mapping in eliminating these three barriers. This case study .