Transcription
Food Labeling Survey January 20191
IntroductionResearch Objective Understand consumer attitudes towards healthy labels and different food packaging aspects that drive purchase behavior.SamplingMethodology Research Now Online Panel Survey Conducted Sample size 1,017 total US consumer respondents Representative distribution by region, gender, age,race/ethnicity and household income October 16-26, 2018 Average Length of Survey 7 ½ minutes Qualification Criteria Age 18-80 Sole or shared responsibility for household’s groceryshopping2
SUMMARY & CONCLUSIONSAlthough they usually read food packaging labels, consumers sometimes find it difficult to identify healthyfood options.Most consumers look for healthy options when food shopping. Two in five (43%) “always” look for healthy options and half (52%) “sometimes” do.Only 5% of surveyed consumers “never” look for healthy options. However, finding healthy foods is “difficult” for one in ten consumers (11%); only28% claim that this is “easy”.Package labeling is a primary source of healthfulness information. A majority say they always read labels on a packaged food before buying it forthe first time (59% high agreement). The Nutrition Facts panel (69%) and the ingredient list (67%) are the twoplaces where the most consumers look for information about foodhealthfulness. Typically, a consumer will look at these labels to determine whether apackaged food has ingredients that they want (45% looked for first) or don’twant (31% looked for first).3
SUMMARY & CONCLUSIONSWhile consumers currently use package information to make decisions about purchasing healthy foods,additional information in the form of a symbol or image would be helpful and would impact purchases.Package symbols and icons are already being used by consumers to make healthyfood purchase decisions, but consumers would be likely to use additional informationif provided. In addition to the Nutrition Facts panel and ingredient list, half of the surveyedconsumers frequently check front-of-package nutrition content icons like the FactsUp Front label, Whole Grain stamp, Heart-Check symbol and Great For You symbol(48%). Furthermore, a healthy symbol on a food package would have a strong influenceon a consumer’s purchase decision. A healthy symbol is ranked third in terms ofoverall impact, following the taste and price of a food item. Consumers agree that a symbol indicating whether a food is healthy would be veryhelpful (54%) and would make them more likely to purchase a product (45%).4
Shopping forHealthy Food5
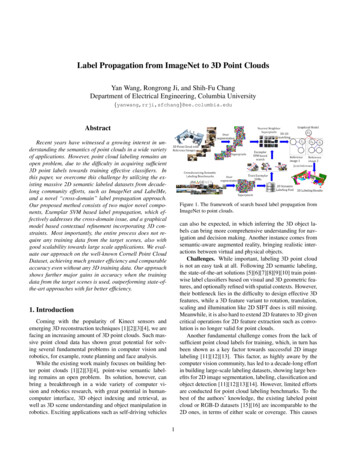
Nearly all surveyed consumers look for healthy options when shopping - at least some of the time. This behavioris more common among younger, highly educated consumers and those with children in the household.(% Always)Frequency Look for Healthy OptionsWhen Food Shopping(% of Total)Never5%51%45%42%45%Gen YGen X38%AgeAlways43%Gen tconditionNocondition48%47%42%Non-WhiteKidsNo kidsEducation& DietLess thancollege54%Sometimes52%41%Race &KidsHispanic/LatinoQ9. When shopping for food for your household, how often do you look for healthy options?Base Total Respondents; n 1017Gen Z Age 18-24; Millennial Age 25-34; Gen Y Age 35-44; Gen X Age 45-54; Boomer Age 55 White6
Finding healthy food is only moderately easy for most consumers. Those who are older, highly educated andwithout children find this easier than others.(% Easy; Rating 8-10)Ease of Finding Healthy Food31%(10-Point Scale; % of %Gen ZMillennial26%28%Less thancollegeGen YGen ition29%28%24%WhiteNon-WhiteKidsEducation& DietModerate(4-7)61%Average Rating: 6.219%30%Race &KidsQ10. Please indicate how easy or difficult it is to know which foods are healthy when food shopping.Base Total Respondents; n 1017Gen Z Age 18-24; Millennial Age 25-34; Gen Y Age 35-44; Gen X Age 45-54; Boomer Age 55 Hispanic/LatinoNo kids7
When shopping, most consumers look at the nutrition label and ingredient list for information about thehealthfulness of food items.Where Consumer Looksfor Information about Food Healthfulness(% Rating 4-5 on 5-Point Scale; 5 Always)The Nutrition Facts panel/nutrition label69%The ingredient list67%Nutrient content claims on the package56%Statements about the absence of certain ingredients54%The price50%Health claims on the package49%The brand or company name48%Front-of-package nutrition content icons48%The product name46%Specific words36%Photos on the frontCorporate Social Responsibility statementsA mobile phone appThe price is an indicator of healthy foods to more youngerconsumers with children and those who are on a foodassistance program compared to other consumers.Older, high-income consumers and those witha diet-related condition pay more attention tohealth claims on the package than others.40%Signs in the storeThe company websiteCompared to other consumers, the top four information sourcesare referenced by more older and highly-educated consumers aswell as those with children and with a diet-related condition.34%20%19%17%More consumers with high incomes and high education levels payattention to brands or company names when determining healthfulness.Millennials, non-Whites, those with children and those on foodassistance programs are more likely than others to refer to amobile phone app when determining a product’s healthfulness.Q11. When looking for healthy packaged foods while shopping, how frequently do you use each of the following in determining a product's healthfulness?Base Look for healthy options when shopping; n 9718
Consumers typically read the label for a food’s ingredients aswell as the inclusion of sugar, fat and sodium.Other Information that Consumers Look forto Determine a Food Product’s Healthfulness(Summarized from Open-Ended Responses)Most frequently mentioned words: IngredientsCalorie contentSugar contentFat contentSodium contentNutrition informationFreshnessLabelOrganicQ12. What other information do you find useful when determining whether a food is healthy when food shopping?Base Total Respondents; n 10179
Healthy FoodPackaging10
Overall, taste is the primary consideration when making a food purchase, followed by price. The healthysymbol ranks third following these two primary factors.Influence onPurchase Decision(Rank Order 1-5; 1 Most Influence)TastePriceHealthy symbol on packageConvenience of packaging or5% 13%preparationEnvironmental sustainability ofthe food6% 10%First25%26%31%14%18%28%20%13%44%26%Second9% 5%12% ghly educated and older consumers aremore influenced by taste.2.4Price has more of an impact on youngerconsumers, those with low incomes andthose on food assistance.3.1Healthy shoppers, those with high incomesand those with a diet-related condition aremore influenced by this symbol.3.5Convenience is more of a factor forMillennials and consumers with children.3.9Gen Z’s, those in the western US and thosewith lower incomes are most influenced bysustainability.FifthQ15. Please rank order the following five items in terms of how much influence each would have on your decision to purchase a particular packaged food product.Base Total Respondents; n 101711
Generally, consumers look for certain ingredients in food that they purchase rather than making sure foodsdon’t contain certain ingredients.What Tells Consumerthat Food is Healthy(Rank order 1-3; 1 Look for First)Packaged foods that containingredients that you wantPackaged foods that don’t containingredients you want to avoidHow the packaged food wasproduced (e.g., locally sourced,sustainable, non-GMO, condAverageRank1.8Older and White consumers, those livingin the South or West, and those withchildren are more likely than others tolook for certain ingredients.2.0Consumers with high incomes and thosewith a college education are the mostinclined to make sure that a packagedfood does not contain certain ingredients.2.2Gen Z’s, Hispanic consumers and thosewith children care the most about howfood is produced.ThirdQ13. Please rank order the following three statements in terms of what you look for on a food label or package that tells you if a food is healthy.Base Look for healthy options when shopping; n 97112
While most consumers always read the labels on their food before purchasing, many would find it helpful andwould be more likely to purchase foods if there was a “healthy” symbol on them.Agreement with Statementsabout Food Packaging(% Rating 1-5; 5 Strongly Agree)I always read labels on a packagedfood product before buying it for thefirst time59%Higher level of agreement among 24%17%Low income, low educationLow income, low education, no children, nothealthy shoppersI avoid certain foods or food productsregardless of its labeling56%28%16%It would be helpful to have a symbol orimage on food packages that indicateswhether a food is healthy54%32%14%I would be more likely to purchase afood that has a symbol or image on thepackage indicating that it is healthyI buy only fresh, unpackaged foods28%High (4 5)20%35%45%34%Moderate (3)38%Boomers, low income, Whites, no children,not healthy shoppersLow income, Whites, no children, nothealthy shoppersBoomers, females, Midwesterners, WhitesLow (1 2)Q14. Please indicate your level of agreement with the following statements.Base Total Respondents; n 101713
Organizationsand HealthyFood Labels14
Consumers are somewhat more trusting of health-focused organizations than of government agencies, andmuch less trusting of food companies in terms of statements made on food packaging.Level of Trust in Statements Made onFood Packaging by Organizations(Level 1-3 Unsure)Health-focused organizationsGovernment agencies (e.g.,Food & Drug Administration FDA)Food igher level of trust among 7%Males, high income, healthy shoppers6%High income, highly educated, Hispanics, non-Whites5%Gen Z’s, Males, Hispanics, non-WhitesUnsureQ16. What level of trust do you have in the statements made on food packaging by each of the following?Base Total Respondents; n 101715
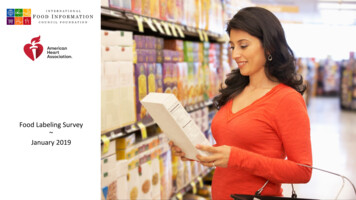
Over half of the consumers surveyed (62%) are at least somewhat familiar with the AHA HeartCheck symbol. Younger consumers, those with a diet-related condition and those with children aremore familiar than others.(% Very Familiar)Familiarity with American HeartAssociation’s Heart-Check Symbol(% of Total)Never seenit18%35%29%32%18%AgeVery26%Gen ZMillennialGen YEducation& DietLess tion34%35%35%Somewhat36%Gen X29%28%Seen it butdon't knowmuchabout it20%27%23%Nocondition22%Race &KidsHispanic/LatinoWhiteNon-WhiteQ17. How familiar are you with the American Heart Association's Heart-Check symbol that appears on some food and beverage packages, shown here?Bae Total Respondents; n 1017Gen Z Age 18-24; Millennial Age 25-34; Gen Y Age 35-44; Gen X Age 45-54; Boomer Age 55 KidsNo kids16
About one in three consumers would choose a food with the Heart-Check symbol over one withoutit; only one in four say it would have no impact. The symbol is more influential for Gen X’ers, thosewith a diet-related condition and those with children.(% Much More Likely)Likelihood to Choose One Food OverAnother If It Has the Heart-Check Symbol(% of Total)34%32%AgeMuchmore likely31%Symbolmakes nodifference25%32%29%29%Gen ZMillennial32%31%32%Less hiteKidsGen YGen X41%Education& Diet35%Somewhatmore likely44%29%Boomer27%Nocondition27%Race &KidsHispanic/LatinoQ18. When choosing between two identical food products, how likely are you to choose the one with the following symbol?Bae Total Respondents; n 1017Gen Z Age 18-24; Millennial Age 25-34; Gen Y Age 35-44; Gen X Age 45-54; Boomer Age 55 WhiteNo kids17
Demographics18
DemographicsTotalGen ZMillennialGen YGen XBoomerGender (Q2)MaleFemale47%5329%7130%7044%5657%4359%41Region 3451619%23372124%22302419%203526Household Income (Q4)Less than 25,000 25,000 - 49,999 50,000 - 74,999 75,000 - 99,999 100,000 - 149,999 150,000 - 199,999 200,000 or moreDon’t 3191244023%1321161863019%16211616840Relationship Status (Q19)Single, never marriedMarried or partneredDivorced, separated or widowedRather not say30%5515069%282141%544132%5711025%5717115%59260n 101796184209189339Gen Z Age 18-24; Millennial Age 25-34; Gen Y Age 35-44; Gen X Age 45-54; Boomer Age 55 19
DemographicsTotalGen ZMillennialGen YGen mployment Status (Q20)Employed full-timeEmployed part-timeTemporarily unemployed; seeking workUnemployed; not seeking workStudentFull-time tion (Q23)High School or lessTrade or Technical SchoolSome College – No degreeTwo-Year College degree (Associate’s)Four-Year College degree (Bachelor’s)Post-graduate work or degreeRather not 19022%422102022015%4191127240n 101796184209189339Proportion of grocery shopping done personally (Q8)AllMostSome/Shared with another personGen Z Age 18-24; Millennial Age 25-34; Gen Y Age 35-44; Gen X Age 45-54; Boomer Age 55 20
DemographicsTotalGen ZMillennialGen YGen 61076103Hispanic/Latino (Q5)13%24%16%18%14%3%# People in Household (Q21)One, just meTwoThreeFourFive or %371913932%54833Children in household (yes) (Q22)43%56%63%64%42%10%Average BMI (calculated average) (Q25/Q26)29.326.229.030.730.828.8Have any diet-related condition such as diabetes, high bloodpressure, high cholesterol or something similar (Q24)30%14%16%22%29%47%Receiving local, state or federal food assistance (Q27)21%26%35%23%16%13%n Ethnicity (Q6)White or CaucasianBlack or African AmericanAsian or Asian AmericanAmerican Indian, Alaska native, Native Hawaiian or otherPacific IslanderOther101796184209189339Gen Z Age 18-24; Millennial Age 25-34; Gen Y Age 35-44; Gen X Age 45-54; Boomer Age 55 21
on a consumer’s purchase decision. A healthy symbol is ranked third in terms of overall impact, following the taste and price of a food item. Consumers agree that a symbol indicating whether a food is healthy would be very help