Transcription
DATACLEANINGApril 2016
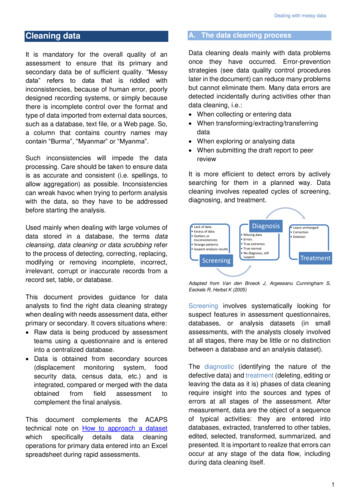
Dealing with messy dataTable of Contentsdata scrubbing refers to the process of detecting,correcting, replacing, modifying or removing messydata from a record set, table, or database.Introduction . 0A. The Data Cleaning Process . 0B. Sources of Error . 1C. First Things First . 2D. Screening Data . 2E. Diagnosing Data . 4F. Treatment of Data . 4G. Missing Values . 5H. Documenting Changes . 6I. Adapt Process . 7J. Recoding Variables . 7K. Quality Control Procedures . 9L. Data Integration . 10M. Key Principles for Data Cleaning . 10This document provides guidance for data analysts tofind the right data cleaning strategy when dealing withneeds assessment data. The guidance is applicable toboth primary and secondary data. It covers situationswhere: Raw data is generated by assessment teams usinga questionnaire. Data is obtained from secondary sources(displacement monitoring systems, food securitydata, census data, etc.) Secondary data is compared or merged with thedata obtained from field assessmentsThis document complements the ACAPS technicalnote on How to approach a dataset which specificallydetails data cleaning operations for primary dataentered into an Excel spreadsheet during rapidassessments.N. Tools and Tutorials for Data Cleaning . 11O. Sources and Background Readings . 11A. The Data Cleaning ProcessAnnex 1 – Checklist for Data Cleaning . 13Annex 2 – Sample Job Description . 15IntroductionNo matter how data are collected (in face-to-faceinterviews, telephone interviews, self-administeredquestionnaires, etc.), there will be some level of error.Messy data” refers to data that is riddled withinconsistencies. While some of the discrepancies arelegitimate as they reflect variation in the context,others will likely reflect a measurement or entry error.These can range from mistakes due to human error,poorly designed recording systems, or simply becausethere is incomplete control over the format and typeof data imported from external data sources. Suchdiscrepancies wreak havoc when trying to performanalysis with the data. Before processing the data foranalysis, care should be taken to ensure data is asaccurate and consistent as possible.Used mainly when dealing with data stored in adatabase, the terms data validation, data cleaning orData cleaning consists primarily in implementing errorprevention strategies before they occur (see dataquality control procedures later in the document).However, error-prevention strategies can reduce butnot eliminate common errors and many data errorswill be detected incidentally during activities such as: When collecting or entering data When transforming/extracting/transferring data When exploring or analysing data When submitting the draft report for peer reviewEven with the best error prevention strategies in place,there will still be a need for actively and rors/problems in a planned way.Data cleaning involves repeated cycles of screening,diagnosing, treatment and documentation of thisprocess. As patterns of errors are identified, datacollection and entry procedures should be adapted tocorrect those patterns and reduce future errors.
Dealing with messy dataThe four steps of data cleaning:execution (i.e., misuse of instruments, bias, etc.).Identifying and solving such inconsistencies goesbeyond the scope of this document. It isrecommended to refer to the ACAPS Technical BriefHow sure are you? to get an understanding of how todeal with measurement errors.Data entry error: "Data entry" is the process oftransferring information from the medium thatrecords the response (traditionally responses writtenon printed questionnaires) to a computer application.Under time pressure, or for lack of proper supervisionor control, data is often corrupted at entry time.Main errors includeAdapted from Van den Broeck J, Argeseanu Cunningham S, EeckelsR, Herbst K (2005) and Arthur D. ChapmanScreening involves systematically looking for suspectfeatures in assessment questionnaires, databases, oranalysis datasets.The diagnosis (identifying the nature of the defectivedata) and treatment (deleting, editing or leaving thedata as it is) phases of data cleaning requires an indepth understanding of all types and sources of errorspossible during data collection and entry processes.Documenting changes entails leaving an audit trail oferrors detected, alterations, additions and errorchecking and will allow a return to the original value ifrequired.B. Sources of ErrorAfter measurement, data are the object of a sequenceof typical activities: they are entered into databases,extracted, transferred to other tables, edited, selected,transformed, summarized, and presented. It isimportant to realise that errors can occur at any stageof the data flow, including during data cleaning itself.Many of the sources of error in databases fall into oneor more of the following categories:Measurement errors: Data is generally intended tomeasure some physical process, subjects or objects,i.e. the waiting time at the water point, the size of apopulation, the incidence of diseases, etc. In somecases, these measurements are undertaken by humanprocesses that can have systematic or random errorsin their design (i.e., improper sampling strategies) andAdapted from Kim et Al, 2003; Aldo Benini 2013 An erroneous entry happens if, e.g., age ismistyped as 26 instead of 25. Extraneous entries add correct, but unwantedinformation, e.g. name and title in a name-onlyfield. Incorrectly derived value occurs when a functionwas incorrectly calculated for a derived field (i.e.error in the age derived from the date of birth). Inconsistencies across tables or files occur e.g.when the number of visited sites in the provincetable and the number of visited sites in the totalsample table do not match.A large part of the data entry errors can be preventedby using an electronic form (e.g. ODK) and conditionalentry.Processing errors: In many settings, raw data are preprocessed before they are entered into a database.This data processing is done for a variety of reasons:1
Dealing with messy datato reduce the complexity or noise in the raw data, toaggregate the data at a higher level, and in somecases simply to reduce the volume of data beingstored. All these processes have the potential toproduce errors.Data integration errors: It is rare for a database ofsignificant size and age to contain data from a singlesource, collected and entered in the same way overtime. Very often, a database contains informationcollected from multiple sources via multiple methodsover time. An example is the tracking of the number ofpeople affected throughout the crisis, where thedefinition of “affected” is being refined or changedover time. Moreover, in practice, many databasesevolve by merging other pre-existing databases. Thismerging task almost always requires some attempt toresolve inconsistencies across the databasesinvolving different data units, measurement periods,formats etc. Any procedure that integrates data frommultiple sources can lead to errors. The merging oftwo or more databases will both identify errors (wherethere are differences between the two databases) andcreate new errors (i.e. duplicate records). Table 1below illustrates some of the possible sources andtypes of errors in a large assessment, at three basiclevels: When filling the questionnaire, when enteringdata into the database and when performing theanalysis.Table 1: Sources of data errorStageMeasurementEntryProcessingand AnalysisSources of errorLack or excess ofOutliers anddatainconsistenciesduplications byanalyst Data-cleaning errorsAdapted from Van den Broeck J, Argeseanu Cunningham S, EeckelsR, Herbst K (2005)Inaccuracy of a single measurement and data pointmay be acceptable, and related to the inherenttechnical error of the measurement instrument.Hence, data cleaning should focus on those errorsthat are beyond small technical variations and thatproduce a major shift within or beyond the analysis.Similarly, and under time pressure, consider thediminishing marginal utility of cleaning more and morecompared to other demanding tasks such as analysis,visual display and interpretation. Understand when and how errors are producedduring the data collection and workflow. Resources for data cleaning are limited.Prioritisation of errors related to populationnumbers, geographic location, affected groups anddate are particularly important because theycontaminate derived variables and the finalanalysis.The following sections of this document offer a stepby step approach to data cleaning.C. First Things FirstThe first thing to do is to make a copy of the originaldata in a separate workbook and name the sheetsappropriately, or save in a new file. Form missing Form double,collected repeatedly Answering box oroptions left blank More than one optionselected when notallowed Correct value filled outin the wrong box Not readable Writing error Answer given is out ofexpected (conditional)rangeALWAYS keep the source files in a separate folder andchange its attribute to READ-ONLY, to avoidmodification of any of the files. Lack or excess ofdata transferredfrom thequestionnaire Form of field notentered Value entered inwrong field Inadvertent deletionand duplicationduring databasehandling Lack or excess ofdata extracted fromthe database Data extraction,coding or transfererror Deletions or Outliers andinconsistencies carriedover fromquestionnaire Value incorrectlyentered, misspelling Value incorrectlychanged duringprevious data cleaning Transformation(programming) errorTo prepare data for screening, tidy the dataset bytransforming the data in an easy to use format.Within a tidied dataset:- Fonts have been harmonised- Text is aligned to the left, numbers to the right- Each variable has been turned into a column andeach observation into a row.- There are no blank rows- Column headers are clear and visually distinct.- Leading spaces have been deletedAfterwards, examine data for the following possibleerrors: Outliers andinconsistencies carriedover from the database Data extraction, codingor transfer error Sorting errors(spreadsheets)D. Screening Data2
Dealing with messy data Spelling and formatting irregularities: arecategorical variables written incorrectly? Is thedate format consistent? For numeric fields, are allof the values numbers? Etc.Lack of data: Do some questions have far feweranswers compared to others?Excess of data: Are there duplicate entries ormore answers than originally allowed?Outliers/inconsistencies: Are there values that areso far beyond the typical distribution that theyseem potentially erroneous?Remarkable patterns: Are there patterns thatsuggest that the respondent or enumerator hasnot answered or recorded questions honestly? (i.e.several questionnaires with the exact sameanswers)?Suspect analysis results: Do the answers to somequestions seem counterintuitive or extremelyunlikely?Common mistakes in needs assessments Misspelling of place names, particularly whentranslating between different alphabets (e.g.Arabic to English) Use of inconsistent date formats Totals differ from the results of disaggregatequestions (e.g. total number of householdmembers is not matching the aggregation of adifferent question where respondents are askedto list household members by age and gender) Values are outside of the acceptable range forvalues for that question, including negative valuesin fields that can only have positive values (e.g.price of bread) Unclear cause of missing data Merging of datasets with different units ofmeasurement (e.g. different interpretations of theterm household) or administrative boundaries. In case of multiple choice questions: selecting‘other, please specify’ for a variable that is one ofthe multiple choice options. Malfunctioning skip patterns Overall lack of consistency within the answersprovided by a respondent (e.g. the response toquestions on main needs is not in line with sectorspecific questions).Data cleaning can be partly automated throughstatistical software packages Descriptive statistictools can for instance be used during the screeningphase to predefine expectations, assumptions orcriteria about normal ranges, distribution shapes, andstrength of relationships. This can facilitate theflagging of dubious data, patterns, or results.However, screening methods are not only statistical.Many outliers are detected by perceived nonconformity with prior expectations or the norm. This isfor instance based on the analyst's experience, resultsfrom secondary data review, numerical constraints orplane common sense (weight cannot be negative,people cannot have more than 2 parents, womencannot bear 35 children, etc.).A particular problem is that of erroneous inliers, i.e.,data points generated by error but falling within theexpected range. Erroneous inliers will often escapedetection. Detection approaches include: Viewing data in relation to other variables, usingmultivariate views, such as scatter plots orheatmap. More advanced and resource intensive lausibility checks (examining the history of eachdata point or comparing to a similar location) or byre-measurement. However, under time pressure,such examination is rarely feasible. Instead, onecan examine and/or re-measure or do furtherinquiry about a sample of inliers to estimate anerror rate.Useful screening methods, from simpler to morecomplex, are: Screening of columns after sorting Use summary statistics Validated and/or double data entry Printouts of variables not passing range checksand of records not passing consistency checks Frequency distributions and cross-tabulations. Graphical exploration of distributions: box plots,histograms, and scatter plots using visual analysissoftware such as Tableau desktop Plots of repeated measurements on the sameindividual, i.e., growth curves Checking of questionnaires using fixed algorithms Statistical outlier detection. In many, if not most instances, data can only becleaned effectively with some human involvement.Know (and/or train data cleaners) commonmistakes and what errors to look for. Exploratory data analysis and data visualizationare two main ways to detect data errors. Different types of errors call for different detectionapproaches – a spell check will recognisemisspelled categorical variables while statisticaloutlier detection helps identification of extremevalues.3
Dealing with messy dataE. Diagnosing DataThe identification or highlighting of an error isfollowed by diagnosis – finding the cause for thiserror. To clarify suspect data, review all of arespondent’s answers to determine if the data makessense within the context. Sometimes it is necessary toreview a cross-section of different respondents’answers, to identify issues such as a skip pattern thatwas specified incorrectly.There are a multitude of possible diagnoses for eachsuspected data point: Missing data: Answers omitted by the respondent(nonresponse), questions skipped by theenumerator or dropout Errors: Typos or answers that indicate the questionwas misunderstood. True extreme: An answer that seems high but canbe justified by other answers (i.e., the respondentworking 60 hours a week because they work a fulltime job and a part-time job) True normal: A valid record. No diagnosis, still suspect: Make a judgment callon how to treat this data during the treatmentphase.Some data values are clearly logically or biologicallyimpossible (men cannot be pregnant; the price ofbread cannot be negative). Pre-defined cut-off pointsimmediately help to detect this type of error.Sometimes the suspected value falls within theacceptable range and the diagnosis is lessstraightforward. In these cases, it is necessary toapply a combination of diagnostic procedures: Go back to previous stages of the data flow to seewhether a value is consistently the same. Thisrequires access to well-archived and documenteddata with justifications for any changes made atany stage. Look for information that could confirm the trueextreme status of an outlying data point. Forexample, a very low score for weight-for-age (i.e., 6 Z-scores) might be due to errors in themeasurement of age or weight, or the subject maybe extremely malnourished, in which case othernutritional variables should also have extremelylow values. This type of procedure requires insightinto the coherence of the variables. This insight isusually available from experience or lessons learntand can be used to plan and program datacleaning. Collect additional information, i.e., question theenumerator about what may have happened and, ifpossible or necessary, repeat the measurement.Such procedures can only happen if data cleaningstarts soon after data collection.The diagnostic phase is labour intensive and thebudgetary, logistical, time and personnel requirementsare typically underestimated or even neglected at thedesign stage. Fewer resources are required ifconditional data entry is used (e.g. through electronicforms) and if it starts early in data collection process. Use common sense, experience, triangulation andlessons learnt to diagnose the type of error. Design your questionnaire form carefully to allowcross checks between questions. Consider the collection of additional informationfrom enumerator to understand the cause of errors(i.e. debriefings)F. Treatment of DataAfter identification of missing values, errors, and true(extreme or normal) values, analysts must decidewhat to do with problematic observations: Leave it unchanged: The most conservative courseof action is to accept the data as a valid responseand make no change to it. The larger the samplesize, the less one suspect response will affect theanalysis; the smaller the sample size, the moredifficult the decision. Correct the data: If the respondent’s original intentcan be determined, correct the answer (i.e. afterdiscussing with the enumerator, it is clear that therespondent meant the lack of income instead oftoo much income). Delete the data? The data seems illogical and thevalue is so far from the norm that it will affectdescriptive or inferential statistics. What to do?Delete just this response or delete the entirerecord? Remember that whenever data is deleted,there is a risk of consciously or subconsciously“cherry picking” the data to obtain the preferredresults. To understand the impact of deleting adata point, a binary variable can be created (1 suspicious record, 0 not suspicious). This newvariable can be used as a record filter in Pivottables or in-table filtering to understand the impactof potentially erroneous data in the final results. If time and resources allow, re-measure the suspector erroneous values.4
Dealing with messy dataThere are some general rules to support a decision onhow to treat the data: If the person undertaking data entry has enteredvalues different from the ones in the questionnaire,the value should be changed to what was recordedin the questionnaire form. (I.e. the value in thequestionnaire was 40,000 and the data entryoperator keyed in 4,000 – a zero was left out). When variable values do not make sense, if there isno data entry error, and there are no notes to helpdetermine where the error comes from, leave thedata as it is. By changing the value into a morereasonable result, significant bias is introducedand there is no justification for changing it. Thecase should be listed as an outlier (i.e. by usingconditional formatting for instance). When blank cells are found or the record wasrequired even though key informants may not havethat type of data or duplicate records were entered,then cases must be deleted from the data file. Impossible values are never left unchanged, butshould be corrected if a correct value can be found,otherwise they should be deleted. For biologicalcontinuous variables, some within-subject variationor small measurement variation could be present.If a re-measurement is done very rapidly after theinitial one and the two values are close enough tobe explained by variation alone, take the average ofboth as the final value. With true extreme values and values that are stillsuspect after the diagnostic phase, the analystshould examine the influence of such data points,individually and as a group, on analysis resultsbefore deciding whether or not to leave the dataunchanged. To limit the impact of outliers and extreme valuesanalysts can decide to present the median. This isacceptable as long as clearly explained within thefindings. Some authors have recommended that trueextreme values should always stay in the analysis.In practice, many exceptions are made to that rule.The investigator may not want to consider theeffect of true extreme values if they result from anunanticipated extraneous process. This becomesan “a posteriori” exclusion criterion. The datapoints should be reported as “excluded fromanalysis” in the methodology chapter of the finalreport.G. Missing ValuesMissing values require particular attention. The firstthing is to decide which blank cells need to be filledwith zeros (because they represent genuine negativeobservations, such as "no", "not present", "option nottaken", etc.) and which to leave blank (if theconvention is to use blanks for missing or N/A for “notapplicable”). Some analysts replace blank cells withsome explicit missing value code (e.g. using 999 toindicate a “do not know”).What to do with those cells remaining blank? Missingvalues can be classified as either random or nonrandom: Random missing values may occur because thesubject inadvertently did not answer somequestions. The assessment may be overly complexor too long, or the enumerator may be tired or notpaying sufficient attention, and miss the question.Random missing values may also occur throughdata entry mistakes. If there are only a smallnumber of missing values in the dataset (typically,less than 5%), then it is extremely likely to be arandom missing value. Non-random missing values may occur becausethe key informant purposefully did not answersome question. This for instance occurs if thequestion is confusing, not appropriate or perceivedas sensitive. The missing data is related to one ormore characteristics of the respondent – e.g. iffemale are more likely to refuse a question on thelevel of income compared to male respondents.The default option for dealing with missing values isto filter and exclude these values from analysis: Listwise / casewise deletion: All cases (e.g. arespondent) that have missing values areexcluded. If only one variable is analysed, listwisedeletion is simply analysing the existing data.When analysing multiple variables, then listwisedeletion removes cases if there is a missing valueon any of the variables. The disadvantage is theloss of data that occurs as all data is removed fora single case, even if some questions wereanswered. Pairwise deletion: Unlike listwise deletion whichremoves cases that have missing values on any ofthe variables under analysis, pairwise deletion onlyremoves the specific missing values from theanalysis (not the entire case). In other words, allavailable data is included. When conducting acorrelation on multiple variables, this techniqueenables a bivariate correlation between all5
Dealing with messy dataavailable data points, and ignores only thosemissing values if they exist on some variables. Inthis case, pairwise deletion will result in differentsample sizes for each variable. Pairwise deletion isuseful when the sample size is small or if missingvalues are large because there are not manyvalues to start with.Try conducting the same test using both deletionmethods to see how the outcome changes. Note thatin these techniques, "deletion" means exclusion withina statistical procedure, not deletion (of variables orcases) from the dataset.A second option is to delete all cases with missingvalues. Thus, you are left with complete data for allcases. The disadvantage to this approach is that thesample size of the data is reduced, resulting in a lossof statistical power and increased error in estimation(wider confidence intervals). It can also affect therepresentativeness of a sample: after removing thecases with non-random missing values from a smalldataset, the sample size could be insufficient. Inaddition, results may be biased in case of non-randommissing values. The characteristics of cases withmissing values may be different than the caseswithout missing values.Another option is imputation: to replace the missingvalues. This technique preserves all cases byreplacing missing data with a probable value based onother available information. A simple procedure forimputation is to replace the missing value with themean or median. Hot-deck imputation replacesmissing values with the value for that same variabletaken from a complete record for a similar person inthe same dataset. Once all missing values have beenimputed, the data set can then be analysed usingstandard techniques for complete data. However, thismethod can also bias results and p-values.Under certain conditions, maximum likelihoodapproaches have also proven efficient to dealing withmissing data. This method does not impute any data,but rather uses all the data available for the specificcases to compute maximum likelihood estimates.Detailing technicalities, appropriateness and validity ofeach techniques goes beyond the scope of thisdocument. Ultimately, choosing the right techniquedepends on how much data are missing, why this datais missing, patterns, randomness and distribution ofmissing values, the effects of the missing data andhow the data will be used for analysis. It is stronglyrecommended to refer to a statistician in case of asmall dataset with a large number of missing values.Pragmatically, for needs assessment with fewstatistical resources, creating a copy of the variableand replacing missing values with the mean ormedian may often be enough and preferable to losingcases in multivariate analysis from small samples. There are several methods to deal with missingdata, including deleting cases with missing values,imputing and the maximum likelihood approach.However, providing an explanation on why dataare missing ("women could not be interviewed",“the last questionnaire section could not be filleddue to lack of time”) may be much moreinformative to end user’s than a plethora ofstatistical fixes.Set up a dummy variable with value 0 for thosewho answered the question and value 1 for thosewho did not. Use this variable to show the impactof different methods.Look for meaning in non-random missing values.Maybe the respondents are indicating somethingimportant by not answering one of the questions.H. Documenting ChangesDocumentation of error, alterations, additions anderror checking is essential to: Maintain data quality Avoid duplication of error checking by differentdata cleaners. Recover data cleaning errors Determine the fitness of the data for use. Inform users who may have used the data knowingwhat changes have been made since they lastaccessed the dataCreate a change log within the workbook, where allinformation related to modified fields is sourced. Thiswill serve as an audit trail showing any modifications,and will allow a return to the original value if required.Within the change log, store the following information: Table (if multiple tables are implemented) Column, Row Date changed Changed by Old value New value Comments6
Dealing with messy data Make sure to document what data cleaning stepsand procedures were implemented or followed, bywhom, how many responses were affected and forwhich questions. ALWAYS make this information available whensharing the dataset internally or externally (i.e. byenclosing the change log in a separate worksheet)I. Adapt ProcessOnce errors have been identified, diagnosed, treatedand documented and if data collection/entry is stillongoing, the person in charge of data cleaning shouldgive instructions to enumerators or data entryoperators to prevent further mistakes, especially ifthey are identified as non-random. Feedback willensure common errors are not repeated and willimprove the assessment validity and the precision ofoutcomes. Main recommendations or corrections caninclude: Programmingofdatacapture,datatransformations, and data extractions may needrevision. Corrections of questions in the questionnaire form. Amendment of the assessment protocol, design,timing, enumerators training, data collection, andquality control procedures. In extreme cases, it may be necessary to reconduct some field assessment (few sites) orcontact again key informants or enumerators toask additional information or more details orconfirm some records. Data cleaning often leads to insight into the natureand severity of error-generating processes. Identify basic causes of errors detected and usethat information to improve data collection and thedata entry process to prevent those errors
Data integration errors: It is rare for a database of significant size and age to contain data from a single source, collected and entered in the same way over time. Very often, a database contains information collected from multiple sources via multiple methods o