Transcription
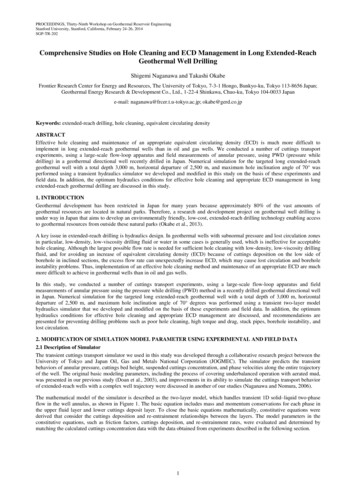
PROCEEDINGS, Thirty-Ninth Workshop on Geothermal Reservoir EngineeringStanford University, Stanford, California, February 24-26, 2014SGP-TR-202Comprehensive Studies on Hole Cleaning and ECD Management in Long Extended-ReachGeothermal Well DrillingShigemi Naganawa and Takashi OkabeFrontier Research Center for Energy and Resources, The University of Tokyo, 7-3-1 Hongo, Bunkyo-ku, Tokyo 113-8656 Japan;Geothermal Energy Research & Development Co., Ltd., 1-22-4 Shinkawa, Chuo-ku, Tokyo 104-0033 Japane-mail: naganawa@frcer.t.u-tokyo.ac.jp; okabe@gerd.co.jpKeywords: extended-reach drilling, hole cleaning, equivalent circulating densityABSTRACTEffective hole cleaning and maintenance of an appropriate equivalent circulating density (ECD) is much more difficult toimplement in long extended-reach geothermal wells than in oil and gas wells. We conducted a number of cuttings transportexperiments, using a large-scale flow-loop apparatus and field measurements of annular pressure, using PWD (pressure whiledrilling) in a geothermal directional well recently drilled in Japan. Numerical simulation for the targeted long extended-reachgeothermal well with a total depth 3,000 m, horizontal departure of 2,500 m, and maximum hole inclination angle of 70 wasperformed using a transient hydraulics simulator we developed and modified in this study on the basis of these experiments andfield data. In addition, the optimum hydraulics conditions for effective hole cleaning and appropriate ECD management in longextended-reach geothermal drilling are discussed in this study.1. INTRODUCTIONGeothermal development has been restricted in Japan for many years because approximately 80% of the vast amounts ofgeothermal resources are located in natural parks. Therefore, a research and development project on geothermal well drilling isunder way in Japan that aims to develop an environmentally friendly, low-cost, extended-reach drilling technology enabling accessto geothermal resources from outside these natural parks (Okabe et al., 2013).A key issue in extended-reach drilling is hydraulics design. In geothermal wells with subnormal pressure and lost circulation zonesin particular, low-density, low-viscosity drilling fluid or water in some cases is generally used, which is ineffective for acceptablehole cleaning. Although the largest possible flow rate is needed for sufficient hole cleaning with low-density, low-viscosity drillingfluid, and for avoiding an increase of equivalent circulating density (ECD) because of cuttings deposition on the low side ofborehole in inclined sections, the excess flow rate can unexpectedly increase ECD, which may cause lost circulation and boreholeinstability problems. Thus, implementation of an effective hole cleaning method and maintenance of an appropriate ECD are muchmore difficult to achieve in geothermal wells than in oil and gas wells.In this study, we conducted a number of cuttings transport experiments, using a large-scale flow-loop apparatus and fieldmeasurements of annular pressure using the pressure while drilling (PWD) method in a recently drilled geothermal directional wellin Japan. Numerical simulation for the targeted long extended-reach geothermal well with a total depth of 3,000 m, horizontaldeparture of 2,500 m, and maximum hole inclination angle of 70 degrees was performed using a transient two-layer modelhydraulics simulator that we developed and modified on the basis of these experiments and field data. In addition, the optimumhydraulics conditions for effective hole cleaning and appropriate ECD management are discussed, and recommendations arepresented for preventing drilling problems such as poor hole cleaning, high torque and drag, stuck pipes, borehole instability, andlost circulation.2. MODIFICATION OF SIMULATION MODEL PARAMETER USING EXPERIMENTAL AND FIELD DATA2.1 Description of SimulatorThe transient cuttings transport simulator we used in this study was developed through a collaborative research project between theUniversity of Tokyo and Japan Oil, Gas and Metals National Corporation (JOGMEC). The simulator predicts the transientbehaviors of annular pressure, cuttings bed height, suspended cuttings concentration, and phase velocities along the entire trajectoryof the well. The original basic modeling parameters, including the process of covering underbalanced operation with aerated mud,was presented in our previous study (Doan et al., 2003), and improvements in its ability to simulate the cuttings transport behaviorof extended-reach wells with a complex well trajectory were discussed in another of our studies (Naganawa and Nomura, 2006).The mathematical model of the simulator is described as the two-layer model, which handles transient 1D solid–liquid two-phaseflow in the well annulus, as shown in Figure 1. The basic equation includes mass and momentum conservations for each phase inthe upper fluid layer and lower cuttings deposit layer. To close the basic equations mathematically, constitutive equations werederived that consider the cuttings deposition and re-entrainment relationships between the layers. The model parameters in theconstitutive equations, such as friction factors, cuttings deposition, and re-entrainment rates, were evaluated and determined bymatching the calculated cuttings concentration data with the data obtained from experiments described in the following section.1
Naganawa and OkabeFigure 1: Concept of two-layer model for 1D solid–liquid two-phase flow in annulus.2.2 ExperimentsThe experimental apparatus used for simulated model verification was a large-scale flow-loop apparatus referred to as the CuttingsTransport Flow-Loop System (CTFLS). A flow diagram and photograph of the apparatus are shown in Figure 2. The CTFLS has a9-m long test section simulating a borehole annulus that consists of a 5-in inner diameter outer pipe for the borehole casing and2.063-in outer diameter inner pipe for the drill pipe. The inclination angle of the test section can be arbitrarily set between vertical(0 ) and horizontal (90 ) in 15 increments. The inner pipe can be set either concentric or eccentric to the outer pipe. To enablevisual observation of the flow behavior in the annulus, the middle section of the 7-m long outer pipe is composed of transparentacrylic resin.Figure 2: Cuttings Transport Flow-Loop System (CTFLS) experimental apparatus.This apparatus is a once-through type of flow loop, meaning that drilling conditions with arbitrary penetration rates can bereproduced by controlling the feed rate of cuttings into the test section. Cuttings are fed and mixed into the fluid flow line at theinlet (bottomhole side) of the test section by operating a screw feeder at a given rate. Cuttings discharged from the outlet (surfaceside) of the test section are separated from the drilling fluid at the shaker screen and are conveyed to the reservoir hopper by abucket conveyer. Weights of the cuttings feed hopper and reservoir hopper are continuously measured by the respective load cells;these data are used to calculate the weight of the cuttings in the test section annulus. The drilling fluid is diverted to the return tankand subsequently pumped again into the flow loop. Data from sensors, such as hopper weight, differential pressure, and temperature,are digitized and stored in a computer, which can be simultaneously monitored online.The experimental conditions are summarized in Table 1. In the experiment, fluid flow rates were changed in five equal steps from70 m3/h to 30 m3/h. The cumulative weight of fed and returned cuttings and frictional pressure loss in the annulus werecontinuously recorded as time series data. From this data, the cuttings volume concentration in the annulus and frictional pressureloss for each fluid flow rate under steady state condition were obtained. The procedure to obtain this steady state data is describedin our previous study (Naganawa, 2013).Table 1: Experimental Conditions.Hole I.D.Drill Pipe O.D.DP EccentricityHole InclinationDrilling FluidFluid DensityFluid TemperatureFluid Flow RateCuttings Diameter5″2.063″0.80, 30, 45, 60, 75 WaterMud 2 (water 5% bentonite 0.1% PHPA)1.0 SG (Water), 1.03 SG (Mud 2)30 C30–70 m3/h (0.79–1.85 m/s) in 10 m3/h steps3.2 mm ( 1/8″)2PV 1, YP 0, Initial Gel 0PV 20, YP 14, Initial Gel 3
Naganawa and OkabeCuttings DensityPenetration Rate2.4 SG10 m/h (0.13 m3/h)2.3 Annular Pressure Data from Geothermal Exploration WellAnnular pressure data was obtained from a geothermal exploration well (Well B) recently drilled in Japan using the PWD method.As shown in Figure 3, the profile of the well included a total depth (TD) of 2,300 m, total vertical depth (TVD) of 1,859 m, andhorizontal departure of 1,259 m. The test section in which PWD data was obtained for this study was a 12–1/4-in hole section of1,322 m to 1,457 m measured depth (MD) with a maximum hole inclination angle of approximately 40 . The mud logging andPWD data obtained are also shown in Figure 3.(a) Well profile(b) Mud logging/PWD dataFigure 3: Profile of Well B and obtained mud logging/pressure while drilling (PWD) data.Unlike the conditions in typical geothermal fields, the formations in which Well B was drilled have relatively high formationpressure, and in some cases abnormal pressure; therefore, the mud weight was maintained at approximately 1.5 SG. The mudrheology was controlled at plastic viscosity (PV) 19 cp and yield point (YP) 28 lbf/100ft2. The operating conditions wereselected to maintain a mud flow rate of 605 gpm and an average rate of penetration of 3.17 m/h. During the drilling process in thistest section, the rotating mode for a steerable motor was generally used.2.4 Modification of Friction Factors in the Simulation ModelThe results of the preliminary simulation study for the Well B 12–1/4-in hole section by using original simulator we developed areshown in Figure 4. As shown in the figure, that cuttings deposit bed was formed along the tangential section. However, althoughthe measured ECD, using PWD ranged from 1.55 to 1.6 SG, as shown in Figure 3, the maximum simulated ECD was 1.525 SG.Thus, we attempted to modify the friction factors defined in the simulator model as constitutive equations to match the measuredand simulated ECDs.(a) Cuttings bed height(b) Equivalent circulating density (ECD) distributionFigure 4: Results of preliminary simulation study for Well B using original simulator.3
Naganawa and OkabeWe determined that two types of parameters should be modified. The first includes pipe wall friction factors f1 and f2. The originalequation of the friction factor was taken from Doron et al. (1987), which is defined as 16 / Ref1 , f 2 0 . 046 / Re0 .2.(1)To compensate the underestimation of ECD for Well B as previously mentioned, we modified the friction factors to be larger thanthose in the original model: 16 / Re 0 . 86 f1 , f 2 0 . 12 0 . 046 / Re.(2)The second parameter to be modified is the friction factor between the upper suspended fluid layer and lower cuttings deposit bedlayer, f12. Doron et al. (1987) used the following definition proposed by Televantos et al. (1979), which is half the friction factor fora rough pipe wall surface developed by Colebrook (1939):12 f 12 d2 . 51p 0 . 86 ln 3 .7 DRe 12 2 f 122 .(3)The original version of our simulator used the same definition. In the present study, however, we attempted to adopt the originalColebrook equation, defined as follows, to produce a closer match in the cuttings concentration in the annulus:1f 12 d2 . 51p 0 . 86 ln 3 .7 DRe 12f 122 .(4)These two friction factor modifications can be graphically demonstrated, as shown in Figure 5.(a) Pipe wall friction factors f1, f2(b) Friction factor between layers f12Figure 5: Modification of friction factor equations.A comparison of steady-state hydraulic behaviors between CTFLS experiments and the simulations is shown in Figure 6.Modification of pipe wall friction factors (center column shown as (b) in the figure) resulted in an overestimation of cuttingsconcentration in the annulus and frictional pressure loss, compared with the experimental results. Conversely, modification offriction factor between the two layers (right column shown as (c) in the figure) resulted in significantly closer match to theexperimental results except for some discrepancy in frictional pressure loss at the lower flow rate region. Although the significantincrease in frictional pressure loss for medium-range hole inclination angles of 30 to 45 was observed in the experiments,frictional pressure loss increased to a large extent for hole inclination angles higher than 60 in the simulation. The experimentalresults may be related to a disturbed dune formed for medium-range hole inclination angles, as reported in our previous study(Naganawa and Okabe, 2013). However, because the simulation used the two-layer model, it could not fully depict such a disturbeddune for such hole inclination angles.4
Naganawa and Okabe(a) Experimental results(b) f1, f2 modification(c) f12 modificationFigure 6: Simulation results for Cuttings Transport Flow-Loop System (CTFLS) experimental conditions by using amodified simulator.The re-simulated result for Well B by using the modified simulator that adopted only f12 is shown in Figure 7. The cuttings bedheight was simulated as sufficiently low. Presumably, effective hole cleaning was achieved in the actual field. However, ECDestimation by simulation could not determine the actual behavior of ECD obtained by PWD. Therefore, because a limitation mayexist in the mathematical model, care must be taken in interpreting the simulation results.(a) Cuttings bed height(b) Equivalent circulating density (ECD) behaviorFigure 7: Simulation result for Well B by using modified simulator.3. SIMULATION OF LONG EXTENDED-REACH TARGET WELL3.1 Model Well and Simulation ConditionsTo evaluate the feasibility of good hole cle
Keywords: extended-reach drilling, hole cleaning, equivalent circulating density ABSTRACT Effective hole cleaning and maintenance of an appropriate equivalent circulating density (ECD) is much more difficult to implement in long extended-reach geothermal wells than in oil and gas wells. We conducted a number of cuttings transport