Transcription
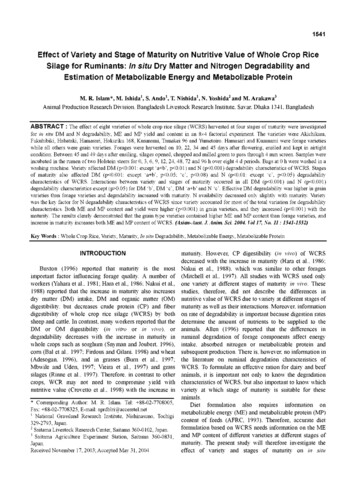
1541Effect of Variety and Stage of Maturity on Nutritive Value of Wh이e Crop RiceSilage for Ruminants: In situ Dry Matter and Nitrogen Degradability andEstimation of Metabolizable Energy and Metabolizable ProteinM. R. Islam*, M. Ishida*1, S. Ando1, T. Nishida1, N. Yoshida2 and M. Arakawa3Animal Production Research Division, Bangladesh Livestock Research Institute, Savar, Dhaka 1341, BangladeshABSTRACT : The effect of eight varieties of whole crop rice silage (WCRS) harvested at four stages of maturity were investigatedfor in situ DM and N degradability, ME and MP yield and content in an 8x4 factorial experiment. The varieties were Akichikara,Fukuhibiki, Habataki, Hamasari, Hokuriku 168, Kusanami, Tamakei 96 and Yumetoiro. Hamasari and Kusanami were forage varietieswhile all others were grain varieties. Forages were harvested on 10, 22, 34 and 45 days after flowering, ensiled and kept in airtightcondition. Between 45 and 49 days after ensiling, silages opened, chopped and milled green to pass through 4 mm screen. Samples wereincubated in the rumen of two Holstein steers for 0, 3, 6, 9, 12, 24, 48, 72 and 96 h over eight 4 d periods. Bags at 0 h were washed in awashing machine. Variety affected DM (p 0.001: except ‘a b’,p 0.01) and N (p 0.001) degradability characteristics of WCRS. Stagesof maturity also affected DM (p 0.001: except ‘a b’,p 0.05; ‘c’,p 0.08) and N (p 0.01: except ‘c’,p 0.05) degradabilitycharacteristics of WCRS. Interactions between variety and stages of maturity occurred in all DM (p 0.001) and N (p 0.001)degradability characteristics except (p 0.05) for DM ‘b’,DM ‘c’,DM ‘a b’ and N ‘c’. Effective DM degradability was higher in grainvarieties than forage varieties and degradability increased with maturity. N availability decreased only slightly with maturity. Varietywas the key factor for N degradability characteristics of WCRS since variety accounted for most of the total variation for degradabilitycharacteristics. Both ME and MP content and yield were higher (p 0.001) in grain varieties, and they increased (p 0.001) with thematurity. The results clearly demonstrated that the grain type varieties contained higher ME and MP content than forage varieties, andincrease in maturity increases both ME and MP content of WCRS. (Asian-Aust. J. Anim. Sci. 2004. Vol 17, No. 11:1541-1552)Key Words :Whole Crop Rice, Variety, Maturity, In situ Degradability, Metabolizable Energy, Metabolizable ProteinINTRODUCTIONBuxton (1996) reported that maturity is the mostimportant factor influencing forage quality. A number ofworkers (Yahara et al., 1981; Hara et al., 1986; Nakui et al.,1988) reported that the increase in maturity also increasesdry matter (DM) intake, DM and organic matter (OM)digestibility, but decreases crude protein (CP) and fiberdigestibility of whole crop rice silage (WCRS) by bothsheep and cattle. In contrast, many workers reported that theDM or OM digestibility (in vitro or in vivo), ordegradability decreases with the increase in maturity inwhole crops such as sorghum (Snyman and Joubert, 1996),corn (Bal et al., 1997; Firdous and Gilani, 1998) and wheat(1QrQccpc fRiirn( esogan, 99K)), Qndan inn grasses( urn pte qa1 ., 1997;Mbwile and Uden, 1997; Vieira et al., 1997) and grasssilages (Rinne et al., 1997). Therefore, in contrast to othercrops, WCR may not need to compromise yield withnutritive value (Crovetto et al., 1998) with the increase in* Corresponding Author: M. R. Islam. Tel: 88-02-7708005,Fax: 88-02-7708325, E-mail: aprdblri@accesstel.net1 National Grassland Research Institute, Nishinasuno, Tochigi329-2793, Japan.2 Saitama Livestock Research Center, Saitama 360-0102, Japan.3 Saitama Agriculture Experiment Station, Saitama 360-0831,Japan.Received November 17, 2003; Accepted May 31, 2004maturity. However, CP digestibility (in vivo) of WCRSdecreased with the increase in maturity (Hara et al., 1986;Nakui et al., 1988), which was similar to other forages(Mitchell et al., 1997). All studies with WCRS used onlyone variety at different stages of maturity in vivo. Thesestudies, therefore, did not describe the differences innutritive value of WCRS due to variety at different stages ofmaturity as well as their interactions. Moreover, informationon rate of degradability is important because digestion ratesdetermine the amount of nutrients to be supplied to theanimals. Allen (1996) reported that the differences inruminal degradation of forage components affect energyintake, absorbed nitrogen or metabolizable protein andsubsequent production. There is, however, no information inthe literature on ruminal degradation characteristics ofWCRS. To formulate an effective ration for dairy and beefanimals, it is important not only to know the degradationcharacteristics of WCRS, but also important to know whichvariety at which stage of maturity is suitable for theseanimals.Diet formulation also requires information onmetabolizable energy (ME) and metabolizable protein (MP)content of feeds (AFRC, 1993). Therefore, accurate dietformulation based on WCRS needs information on the MEand MP content of different varieties at different stages ofmaturity. The present study will therefore investigate theeffect of variety and stages of maturity on in situ
1542ISLAM ET AL.degradability of DM and N as well as ME and MP contentof WCRS.MATERIALS AND METHODSAgronomy, variety and sample preparationA detailed description of sample preparation waspresented in Islam et al. (2004a; 2001). Differences amongvarieties, maturities, and proportion of head and straw ineach variety can also be seen in Islam et al. (2004a). Inshort, eight varieties of rice (Akichikara, Fukuhibiki,Habataki, Hamasari, Hokuriku 168, Kusanami, Tamakei 96and Yumetoiro) were grown under identical condition atSaitama, Japan in 1997, and harvested in 1998. Two of thevarieties, Hamasari and Kusanami are regarded as ‘feed’ (i.e.forage) type rice while others are ‘grain’ types. All varietieswere harvested at four stages of maturity; 10 (MS1), 22(MS2), 34 (MS3) and 45 (MS4) days after flowering andensiled. Silages were opened between 45 and 49 days afterensiling, chopped by a machine (Yamamoto P-156, Japan)and stored at -18 C until further processing.All samples from each variety at each maturity stageswere ground green through a 4 mm screen (Retsch,Germany).In situ degradationIn situ degradation procedure followed was principallythe same as described by Hoffman et al. (1993). Eachvariety at each stages of maturity was incubated over eight4 d (96 h) periods. One variety with all four maturity stageswas incubated in each period. Two steers fitted with rumencannulae (648 kg, SD 25; 3.5 years old) were used toincubate sample. Nylon bags (polyester made bags; 10x20cm; pore size 45 jim; T-NO, Tetron Screen, NBC Industries,Tokyo) were filled with fresh sample (ca. 5 g on DM basis).Bags were placed in a polyester mesh bag secured to theruminal cannula via a nylon cord. At each time point, bagswere incubated in the steers in a reverse order for 0, 3, 6, 9,12, 24, 48, 72 and 96 h. The advantage of incubation in areverse order enable to bring out all bags at the same timeafter incubation which minimizes error because all bagswere washed at the same time (von Keyserlingk et al.,1996). A standard forage, alfalfa, was also incubated in therumen of those two steers for 12, 24 and 48 h and DMdegradability was determined to investigate the effect ofperiod. Bags at 0 h were included in all cases but notincubated in the rumen. After removal of the bags fromrumen, the polyester mesh bags including all nylon bagswere immersed in ice water (for 10 min) to stop microbialactivity. The polyester bag, including the nylon bags wasrinsed with cold water to remove particulate material. Thebags were then removed from the polyester bags and placedin a domestic washing machine (Hitachi PS-555, Japan).The machine washed the bags (including 0 h bags) for 10min and agitates for 3 min prior to drain water. Afterremoving the bags from washing machine, bags werewashed again by hand with cold tap water until the waterbecame clear. All bags were dried at 60 C for 48 h in aforced draft air oven.Animals, feeding and feed analysisThe Holstein steers fitted with rumen cannula fed a dietconsisting of 10 kg of alfalfa hay offered once in a day.They were also fed on mineral block and water ad libitum.N content of WCRS was determined from fresh samplewhile N content of in situ residues of WCRS wasdetermined from dried sample. All analysis was done induplicates.Data fittingThe disappearance of DM and N at each individualincubation time was calculated as the difference betweenthe feed and the portion remaining after incubation in therumen. These values were fitted to the model developed by0rskov and McDonald (1979) as p a b (1-e-ct), where,p disappearance (%) of DM and N from the bags at time t,a proportion of immediately soluble DM or N, b proportion of degradable fraction which degrade at afractional rate c (% per h). Solubility of DM and N wasdetermined similarly by washing of 0 h bags, which wassubjected only to washing procedure. Data were fitted bySAS (1988).Effective degradability (ED) or availability of DM andN was calculated by fractional rate of passage of theparticulate matter in the rumen at 5% per h (ED5) by themodel of McDonald (1981) as ED a (bc/(c kp)), where, a,b, c are described as above and k passage rates.ME and MP estimationThe ME (MJ kg-1 DM) was estimated according toTerada et al. (1988) and total digestible nutrients(TDN, %DM) was estimated according to Abe et al. (1988)as follows:ME -1.312 0.0603xCP 0.05xOa 0.0215xOb 0.0505 xNCWFETDN 54.18 0.287x (OCC Oa)-0.183xObThe chemical composition was assayed based onenzymatic analysis of Abe et al. (1979).The fermentable metabolizable energy (FME, MJ kg-1DM), ME from fats and oils (MEF, MJ kg-1 DM), ME fromfermentation of acids (MEA, MJ kg-1 DM) were estimatedaccording to AFRC (1993). However, the values of fat andoils, and organic acid content of whole crop rice given in
ME AND MP OF WHOLE CROP RICETable 1. Effect of variety and stages of maturity on DM degradability characteristics of whole crop rice (% or as stated)Variety (V)Maturity (M)148 h DM lossWashing lossbc (h-1)(a 646.120.966.20.062Hokuriku amakei 80.039KusanamiMS154.730. 43***NS15***1 MS1, MS2, MS3 and MS4 are maturity stages at harvest means harvesting on 10, 22, 34 and 45 days after flowering respectively; ED5 is effectivedegradability at the passage rate of 5% per h; S effect of steer. R2 is the proportion of variation accounted for by the model.this series (Islam et al., 2004a) were used in calculation.For protein (g kg-1 DM), quickly degradable protein(QDP), slowly degradable protein (SDP), rumen degradableprotein (RDP), effective rumen degradable protein (ERDP),undegradable protein (UDP), digestible undegradableprotein (DUP), microbial crude protein (MCP), digestiblemicrobial true protein (DMTP) and metabolizable protein(MP) were also calculated according to AFRC (1993) fromthe in situ nitrogen degradability data of this paper, and CPcontent and ADIN of whole crop rice given in this series
1544ISLAM ET AL.Table 2. Means of main effect of variety and stages of maturity on in situ DM degradability characteristics of whole crop rice (% or asstated)n48 h DM lossWashing lossb(a b)ED5c .5fHokuriku 1.6dTamakei 8.1Maturity 160.03769.3a60.6b66.6ab1646.9a19.4c0.03854.4aMS41 MS1, MS2, MS3, MS4, and ED5 as described in Table 1.3, c, d, e, f, g Values with different superscripts in a column within the same subclass differ (p 0.001 to 0.01).아(Islam et al., 2004a). For FME content, 3 times maintenance existed (p 0.001) for washing loss, and ED, but there werelevel of feeding was used and hence all parameters (e.g. no interactions (p 0.05) on ‘b’,‘a b’ and ‘c’. Steers did notMCP, DMTP, MP) related to FME are applied to dairy cows affect (p 0.05) the in situ degradability parameters (p 0.05)except for 48 h DM loss (p 0.05). Washing loss increased,only.ME yield (MJ ha-1) was calculated from its ME content but in contrast ‘b’ decreased with the increase in maturity.and DM yield. Similarly, MP (kg DM ha-1) content was Rate of degradation generally decreased with the increase inmaturity. Potential degradability increased from MS1 tocalculated from MP content and DM yield.MS3, but remain similar or decreased slightly at MS4compared to MS3. ED increased with the increase inStatistical analysismaturity(Table 1).Data on variety and stages of maturity was analyzed byDMsolubilityat 0 h was higher (p 0.001) in ‘grain’SAS using general linear model procedure (SAS, 1988) invarietiesthan‘forage’ varieties with the exception of a grainan 8x4 factorial experiment with reps, which includes 8varieties at 4 maturity stages. The statistical model was as variety, Hokuriku 168 of which DM loss was the lowest.Moreover, ‘c’ was higher in grain varieties but in contrast,follows:‘b’ fraction was higher (p 0.001) in forage varieties. The‘a b’ was highest (p 0.001) in Hokuriku (71.7%) and the丫谁 卩 Vi Mj Sk (VxM)ij Eijklowest in Akichikara (59.6%). ED was higher (p 0.001) ingrain varieties than forage varieties at all passage ratesWhere, Yijk dependent variable, i population mean,(Table 2).V average effect of variety i, Mj average effect ofDM solubility at 0 h increased (p 0.001), but ‘b’maturity stage j, Sk average effect of steer k; (VxM)j fraction decreased (p 0.001) with the increase in maturity.average effect of interaction of variety i and maturity j, andThe ‘c’ decreased (p 0.001) from MS1 to MS3, but ‘c’ atEijk residual error, assumed to be normally, identically andMS4 did not differ (p 0.05) with the rate at other stages ofindependently distributed. All means were tested by leastmaturity. In contrast, ‘a b’ increased (p 0.001) from MS1square difference (SAS, 1988).to MS3, but ‘a b’ at MS4 did not differ (p 0.05) with otherstages of maturity. However, ED increased (p 0.001) withRESULTSthe increase in maturity at all passage rates (Table 2).DM degradabilityVariety affected (p 0.001) 48 h DM loss, washing loss N degradabilityVariety affected (p 0.001) on 48 h N loss, washing loss,(’a’),all in situ parameters (‘a b’,p 0.01) and ED at allinsitudegradability characteristics and availability of N.passage rates. Stage of maturity also affected (p 0.001) theMaturitysimilarly affected (p 0.001) 48 h loss, washing48 h DM loss, washing loss, in situ degradabilityloss,insitudegradability characteristics (‘c’; p 0.05) andcharacteristics (‘a b’,p 0.05; ‘c’,p 0.08) and ED at allavailability.Interactions between variety and stages ofpassage rates. Interactions between variety and maturity
ME AND MP OF WHOLE CROP RICE1545Table 3. Effect of variety and stages of maturity on in situ N degradability characteristics of whole crop rice (% DM or as stated)Maturity (M)1Variety (V)48 h N lossNWashing lossb(a b)ED5c 0.10385.481.4Hokuriku S470.10.9553.314.50.08569.463.9Tamakei 20***33***NS17***13***VxM1 MS1, MS2, MS3, MS4, ED5, S and R2 are as described in Table 1.maturity occurred (p 0.001) in all above parameters.Solubility at 0 h was the highest (p 0.001) in Hamasari(forage variety) despite its lowest DM solubility. In contrast,N solubility of Kusanami (forage variety) and Hokuriku(grain variety) was low, which was similar in pattern to DMsolubility. Hamasari, on the other hand, contained thelowest (p 0.001) but Hokuriku contained the highest ‘b’fraction. Rate of degradation was the highest (p 0.001) inHabataki. Potential degradability and availability (at allpassage rate) was the highest (p 0.001) in Hamasari andlowest in Hokuriku (Table 4).N solubility and ‘c’ decreased (p 0.001) from MS1 toMS3, but increased slightly at MS4. Slowly degradablefraction (b) was, however, the highest (p 0.001) at MS3
1546ISLAM ET AL.Table 4. Means of main effect of variety and stages of maturity on in situ N degradability of whole crop rice (% DM or as stated)nN48 h N loss Washing lossbED5c (h-1)(a a1.25b61.1f70.5fHokuriku ei 161 MS1, MS2, MS3, MS4 and ED5 as described in Table 1.a, b, c, d, e, f, g Values with different superscripts in a column within the same subclass differ (p 0.001 to 0.05).and lowest at MS4. Potential degradability and availability slowly degradable DM decreased (8-14%) in most varietiesat all passage rates decreased (p 0.001) with the increase in with the increase in maturity. In contrast, Hoffman et al.(1993) reported that both rapidly and slowly degradablematurity (Table 4).DM fractions of most grasses and legumes decreased withthe increase in maturity. Despite these contrasting results,Metabolizable energy and metabolizable proteinBoth variety and stages of maturity affected (p 0.001) the range of slowly and rapidly degradable DM fractions ofthe FME, ME, TDN and ME yield. These parameters WCRS was in agreement with the ranges reported byincreased, but MEF and MEA decreased with the increase Hoffman et al. (1993). The range of rapidly degradable DMin maturity in all varieties (Table 5). There were no fraction was also in agreement with the ranges of corninteractions (p 0.05) between variety and maturity on those silage (44-57%) and grass silages (28-59%) reported by vonparameters. The FME, ME, TDN and ME yield of grain Keyserlingk et al. (1996), while the range of slowlyvarieties were higher (p 0.001) than forage varieties (Table degradable DM fraction (31-42% and 13-58%, respectively)reported by them contrasts with WCRS. However, it is6).All QDP, SDP, RDP, ERDP, UDP, DUP, MCP, DMTP, worth to mention that unlike the present study, vonMP and MP yield differed (p 0.001) due to the variety and Keyserlingk et al. (1996) did not described the variety andstages of maturity. There were no interactions (p 0.05) maturity status of forages they studied. In the present study,between variety and maturity on these parameters (Table 7). the contrasting characteristics of both slowly and rapidlyThe ERDP, MCP, MP and MP yield was generally higher in degradable fraction may be explained by the differences ingrain varieties than forage varieties, and these parameters botanical fractions of varieties at different maturity stages.Grain varieties contained a higher proportion of head thanincreased with maturity (Table 8).straw compared to forage varieties, which might lead tohigher rapidly and lower slowly degradable fraction in theDISCUSSIONformer varieties than the latter. It is also worth to mentionthat both rapidly and slowly degradable DM were mostlyDM degradabilityBuxton (1996) reported that maturity stage is the most similar in all varieties at MS1, while rapidly degradableimportant factor influencing forage quality. The results of fraction increased, slowly degradable fraction on the otherthis study suggest that both variety and maturity are equally hand decreased with the increase in maturity. Thisimportant in determining quality of WCRS because they phenomenon also likely to be due to the fact that, whileaccounted for by similar proportion of variation on effective proportion of head increased, proportions of straw on theDM degradability, but variety accounted for by most of the other hand decreased with the increase in maturity.The rate of degradation of DM was generally higher invariation for effective N degradability (Tables 1 and 3).grainvarieties than forage varieties presumably because theTherefore, both selection of variety and harvesting at arate of degradation of DM of head was higher than leaf orsuitable maturity are equally important.The rapidly degradable DM increased (12-17%), but stem, which might lead to higher rate of degradation of
ME AND MP OF WHOLE CROP RICEgrain type varieties. In general, rate of DM degradation atMS1 was higher than other stages of maturity (Table 1). Therate of DM degradation of varieties at different maturitiesdid not follow any trend, which disagreed with the data ofHoffman et al. (1993) where rate of degradation of foragesgenerally decreased with the maturity. The range of rate of1547DM degradation of grasses (Hoffman et al., 1993) andhybrid maize (Vferbic et al., 1995) was in agreement withthe range of rate of degradation of WCRS in the presentstudy. Ovenell-Roy et al. (1998) on the other hand reporteda much higher rate of degradation (9-15%) for barleycultivars.Table 5. Effect of variety and stages of maturity on energy characteristics of whole crop rice (MJ kg-1 DM or as stated)Maturity stages (M)1ME yield (MJ ha-1)Variety (V)MEFMEATDN SNSNS25***17***16***11***14***VxM1 MS1, MS2, MS3, MS4, ED5, S and R2 are as described in Table 1.
1548ISLAM ET AL.Table 6. Main effect means of variety and stages of maturity on metabolizable energycrop 5dHokuriku 16880.70c0.62g0.69dTamakei 85.53Forage160.750.704.15Maturity cs (MJ kg-1 DM or as stated) of wholeMETDN (%)ME yield (kg d56.3c59.3b59.5a51,476c74,153b100,743a107,282a1 MS1, MS2, MS3 and MS4 as described in Table 1.a, b, c, d, e, f, g Values with different superscripts in a column within the same subclass differ (p 0.001).Availability of DM at all passage rates was higher forgrain type varieties (except Hokuriku) compared to foragetype. As stated earlier, grain type varieties contained ahigher proportion of grain than straw (Islam et al., 2004a).Furthermore, ED of head was higher than leaf or stem(Islam et al., 2004b; accepted Manuscript ED 402) whichmay lead to higher availability of grain type varieties thanforage type. Increased availability of DM with the increasein maturity also likely to be due to the fact that proportionof grain increased with the maturity.N degradabilityVariety is the key factor affects N degradability ofWCRS as it accounted for by 50-84% of the total variationin contrast to 8-20% of the total variation accounted for bymaturity (Table 3). On average 73% of the N in WCRSsolubilized immediately. In contrast to DM solubility, whichwas the lowest, rapidly degradable N of Hamasari was thehighest. However, N solubility of another forage variety,Kusanami and grain variety, Hokuriku was lower than othervarieties, similar to the pattern of DM solubility. The reasonfor high N solubility of Hamasari and low N solubility ofKusanami or Hokuriku was not clear and cannot beexplained by the proportion of botanical fractions. Nsolubility rather may be associated with the internalstructure of each of botanical fraction (Ramanzin et al.,1986; Verbic et al., 1995). The rapidly soluble N content ofWCRS was twice than those reported by von Keyserlingk etal. (1996) for corn and grass silages, and much higher thanother silages, grasses and legumes (AFRC, 1993; Hoffmanet al., 1993). In contrast, the slowly degradable fraction ofWCRS was much lower than those reported for differentforages and silages (AFRC, 1993; Hoffman et al., 1993; vonKeyserlingk et al., 1996).The rate of N degradation was similar to the rate ofdegradation of grasses (Hoffman et al., 1993), but waslower than corn and grass silages (von Keyserlingk et al.,1996). In fact, rate of degradation of N of leaf and stem ofWCRS was too low (Islam et al., 2004b; acceptedManuscript ED 402) may be due to the ash content of theformer and association of fiber content in the latter whichmight lead to lower rate of degradation of WCRS. Generally,the grain varieties have higher rate of degradation thanforage varieties may be due to fact that rate of Ndegradation of head was higher than leaf or stem (Islam etal., 2004b; accepted Manuscript ED 402).Like rapidly soluble N, availability of N was high forHamasari and low for Kusanami and Hokuriku. Availabilityof ruminal N of WCRS was higher than those reported forforages and silages (AFRC, 1993; Hoffman et al., 1993; vonKeyserlingk et al., 1996). This may be due to the higherruminal solubility of N from WCRS compared to otherforages. Availability of N generally decreased at all passagerates with the increase in maturity was in agreement withHoffman et al. (1993), but the magnitude of decrease inWCRS was
Effect of Variety and Stage of Maturity on Nutritive Value of Wh이e Crop Rice Silage for Ruminants: In situ Dry Matter and Nitrogen Degradability and Estimation of Metabolizable Energy and Metabolizable Protein M. R. Islam*, M. Ishida*1, S. Ando1, T. Nishida1, N. Yoshida2 and M. Arakawa3