Transcription
Value of a GridConnection to DistributedGeneration Customersprepared for:Energy Networks Association
DISCLAIMERThis report has been prepared for the Energy Networks Association (ENA).The analysis and information provided in this report is derived in whole or in part from informationprepared by a range of parties other than Oakley Greenwood (OGW), and OGW explicitlydisclaims liability for any errors or omissions in that information, or any other aspect of the validityof that information. We also disclaim liability for the use of any information in this report by anyparty for any purpose other than the intended purpose.DOCUMENT INFORMATIONProjectValue of a Grid Connection to Distributed Generation CustomersClientEnergy Networks AssociationStatusFinal ReportReport prepared byLance Hoch (lhoch@oakleygreenwood.com.au)Rohan Harris (rharris@oakleygreenwood.com.au)Date17 November 2014
Value of a Grid Connection to Distributed Generation Customers17 November 2014Final ReportTable of CONTENTS1.Summary of key points . 12.Background and purpose . 93.4.2.1.Current and forecast use of rooftop PV systems in the NEM.92.2.Objective of this report . 11Services the grid provides . 113.1.Access to a continuous supply of electricity . 123.2.Market access: the ability to sell excess power generated by the PV system . 123.3.Start-up power and power quality . 13Value of a grid connection to a distributed generation customer . 134.1.The value of the continuous supply provided by a grid connection . 144.1.1. The value of energy that the customer would not receive withoutthe grid connection .154.1.2.5.Cost of a standalone power system (SAPS) .184.2.The value of market access provided by a grid connection . 204.3.The value of start-up power and power quality provided by a grid connection . 214.4.Summary of the value provided by a grid connection to a customer witha rooftop PV system . 21The value and other impacts rooftop PV has on the grid . 22Appendix A : Estimating the electricity production of an average-sizedrooftop PV system . 25Appendix B : SAPS specification and costs . 26B.1Specification . 26B.2SAPS system components and costs – 4 kW (constrained A/C) system. 26B.3SAPS system components and costs – 6 kW (moderate A/C capability) system . 27Appendix C : Calculating the annual value the customer gets from being ableto sell excess PV electricity generation . 28Appendix D : Methodology used to estimate the impact of rooftop PV on networkcosts and revenues and potential cross-subsidies . 29i
Value of a Grid Connection to Distributed Generation Customers17 November 2014Final ReportTable of FIGURESFigure 1: Annual value of a grid connection to a residential customer in the Endeavour Energyservice area with a rooftop PV system . 3Figure 2: Monthly costs of two SAPS with those of a typical residential customer in Western Sydney . 5Figure 3: Comparison of the network charges paid by a customer without a PV system withthe charges paid and value received by a customer with a rooftop PV system . 6Figure 4: Annual impacts of a rooftop PV system on the Endeavour Energy network andother customers . 7Figure 5: Estimated half–hourly seasonal consumption of the average residential customer(Endeavour Energy 2013) . 16Figure 6: Seasonal half-hourly PV output in kW (Australian Eastern Standard Time) - NSW . 17Figure 7: Annual value of a grid connection to a residential customer in the Endeavour Energyservice area with a rooftop PV system . 21Figure 8: Annual impacts of a rooftop PV system on the Endeavour Energy network andother customers . 23ii
Value of a Grid Connection to Distributed Generation Customers17 November 2014Final Report1.Summary of key pointsThe deployment of rooftop PV systems has increased dramatically in the last decade, and isforecast to continueThe number of rooftop PV systems installed in Australia has increased dramatically – from almostnone in 2000 to over 1.2 million by June of 2014. These systems now represent a total nameplategeneration capacity of 3,420 MW and were estimated to have generated 3,951 GWh in the 201314 year. Further strong growth is forecast: by 2023-24 rooftop PV systems are expected togenerate 14,114 GWh representing 7.5% of the total electricity requirements of customers in theNEM 1.Other forms of distributed generation are nearing the point where they will also start to bedeployed by customers. These will include battery storage (including the use of electric vehiclebatteries) to store electricity generated by the PV system and to be drawn on when needed), fuelcells and micro-wind turbines, any of which could be paired with rooftop PV systems.Each of these types of distributed generation — either singly or in combination with others — willhave its own unique impact on the electricity grid. The grid is made up of the transmission anddistribution network “poles and wires” that move electricity from the sources of generation toAustralian homes and businesses.Given that rooftop PV is the fastest growing form of distributed generation in Australia – and thetype likely to continue to provide the largest source of distributed electricity generation for thenext five to ten years – it is important to understand the impact that these systems are having nowand may have in the future on the electricity supply system and electricity customers. In addition,such an effort with regard to rooftop PV systems can also provide a methodology that can betransferred for use in considering the likely impacts of other forms of distributed generation.The vast majority of the households that have installed rooftop PV systems have stayedconnected to the grid and have derived significant benefits from that connectionThe overwhelming majority of the rooftop PV systems installed to date are on homes that continueto be connected to the grid. This connection provides significant value to the customer with arooftop PV system. The value of grid services occurs in three different areas.Continuous supply – Customers receive a continuous supply of electricity, made up of theirown generation and the grid as a back-up whenever their own generation cannot provide allthe electricity they need.Market access - Customers can sell the excess power generated by the PV system toretailers at the feed-in tariff rate.Start-up power, power balancing and power quality – the grid provides a number of virtuallyinvisible services to customers. These include:The ability to provide large increases in the amount of electricity delivered over veryshort time periods. This is important because some consumer appliances – such as airconditioners - can require significantly more power to start up than they do once theyare running.1These figures are based on the Medium 50% POE forecast in AEMO’s 2014 National Electricity Forecast Report, June2014.1
Value of a Grid Connection to Distributed Generation Customers17 November 2014Final ReportA steady and even supply of electricity, which is required for appliances to operateproperly and which could be difficult for a PV system to provide on its own because itsoutput can drop quickly (even if only temporarily) due to passing clouds.A high level of power quality, which is important for certain home appliances, such asdesktop computers.All customers benefit from the continuous supply, start-up power, power balancing and powerquality provided by the grid. Market access is an additional service that users of rooftop PVsystems (or other distributed generation systems) enjoy that is available to, but not used by, othercustomers.Customers with rooftop PV systems receive essentially the same service from the electricitynetwork – but pay considerably less than other customersTo quantify the value a grid connection provides to a customer that uses a distributed generationsystem, we developed a case study of a residential customer with a rooftop PV system in thewestern Sydney suburbs, where Endeavour Energy is the electricity distribution company 2. Thisquantification used the following information:The regulated retail tariff and the network tariff that were in place in the Endeavour Energyservice area during the 2013-14 year.The annual consumption and half-hourly consumption profile of a typical residential customerin the Endeavour Energy service area.The annual and half-hourly output of an average-sized rooftop PV system in NSW.Analysis of these inputs revealed the following:An average residential customer uses 5,000 kWh over the course of a year.A typical rooftop PV system in the Endeavour Energy area will produce 3,742 kWh underaverage weather conditions.Of that, 2,044 kWh (about 55% of the total output) would be used directly by the household,with the other 45% (about 1,698 kWh) being exported back to the grid.As a result, about 2,956 kWh of the total 5,000 kWh consumed annually by the averageresidential customer in the Endeavour Energy area would still need to be supplied by thegrid.The case study revealed that a residential customer in the Endeavour Energy service area withan average-sized rooftop PV system derives the following benefits from their grid connection:The ability to use their electric appliances even when the PV system is not generatingelectricity (such as at night), worth approximately 729 per year at 2013-14 retail electricityprices 3.Sales of excess electricity generated by their PV system worth about 93 per year.2Endeavour Energy serves an area primarily to the west and south of Sydney including Sydney’s Greater West, theSouthern Highlands and the Illawarra, and which includes some of the fastest growing areas in Australia.3Which is calculated by multiplying Origin Energy’s retail electricity price in the Endeavour Energy area by the 2,956kWh that the PV customer still relies on from the grid. Note that all dollar figures in this document are exclusive of GST.2
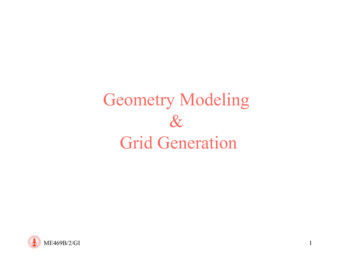
Value of a Grid Connection to Distributed Generation Customers17 November 2014Final ReportAccess to the in-rush energy required to start certain equipment such as air conditioning.Without such a service from the grid, the customer would either need to install sufficientonsite generation and storage or to downsize or forego the use of larger air conditioningequipment.Avoidance of damage to their equipment provided by the grid’s ability to instantaneouslybalance the supply of electricity to the needs of the customer and to maintain a high level ofpower quality through frequency, voltage and harmonic distortion control.Figure 1 below displays these values.Figure 1: Annual value of a grid connection to a residential customer in the Endeavour Energy service areawith a rooftop PV systemBenefit of the in-rushenergy and energybalancing servicesprovided by the grid(not easily quantifiable) 900 800 93 700 600 500 400 822 729 300 200 100 0Value of energy not servedwithout a grid connectionValue obtained from ability tosell excess PV electricityTotal value provided bythe grid connectionSource: OGW analysisAs can be seen, the total benefit provided by the grid connection to a customer with a rooftop PVsystem in this case study comes to approximately 822, and this does not include either:the value of the in-rush energy capability provided by the grid, or the grid’s ability to instantlytop up the supply needed by the customer in the event that even very short reductions in thePV output occur due to short cloudy periods, orthe fact that the value to the customer to have electricity at night is likely to be higher thanjust the cost of purchasing that electricity.3
Value of a Grid Connection to Distributed Generation Customers17 November 2014Final ReportThis customer would pay 453 in his or her annual bill to the network (comprised of 131 in fixedcharges and 322 4 in volume-based charges) to get these services.In order to have access to a level of electricity supply similar to that enjoyed by the averagecustomer in the Endeavour Energy service area, a customer that wanted to use a PV systemwithout a connection to the grid would need to install:a PV system of at least 4kW in capacity with sufficient battery storage to allow enoughelectricity to be generated in the day and stored in order to provide the electricity neededafter the sun goes down and during cloudy periods, anda petrol- or diesel-fired generator to provide electricity during extended cloudy periods and inthe event the PV system needs maintenance or repair.The cost of such a system for a family of four including 2 school age children that uses about5,000 kWh a year for heating, lighting, refrigeration and other appliances, but that has gas waterheating and cooking would be in the order of 56,500 inclusive of GST and after all applicablerenewable energy credits are taken into account. It would also require some annual costs formaintenance.The monthly cost of such a system can be compared to the monthly cost the customer without arooftop PV system pays:The total annual retail bill for such a customer in the western Sydney suburbs will beapproximately 1,488 per year or about 124 per month 5, of which approximately 677 or 56 per month would be for network services (comprised of 131 in fixed charges and 546in volume-based charges).The monthly cost of the standalone system can be estimated by dividing the total initial costby the number of years of useful life the system can be expected to provide and then dividingthat by twelve to get an average monthly cost. Using an estimated cost of the standalonesystem of 56,500 this comes to about 430 per month 6 – significantly more than the cost theaverage customer pays for electricity delivered through the grid 7. If financed at the cost of ahome mortgage at 5%, the finance cost would be 166 per month, requiring total repaymentsof 596 per month.It should be noted that this SAPS would be able to support only a very moderate level of airconditioning – probably no more than a single, relatively small split system. A SAPS capable ofrunning two or three split systems – enough to cool the lounge room, master bedroom andpossibly one other bedroom or study – would cost about 72,500 inclusive of GST and after allapplicable renewable energy credits are taken into account. The monthly cost of such a systemwould be about 550. (If financed at the cost of a home mortgage at 5%, the finance cost wouldbe 299 per month, requiring total repayments of 850 per month)4This is based on the PV customer’s electricity consumption from the grid multiplied by Endeavour Energy’s first tier kWhprice on its N70 tariff for 2014-15.5This is calculated based on the 2013-14 regulated retail tariff for the Endeavour Energy service area.6This calculation is based useful life-weighted cost of 11 years for the SAPS based on information on typical componentcosts and lifetimes. See Section 4.1.2 and Appendix B for more information. It is still a bit conservative in that it doesnot include any costs for fuel or maintenance.7It should be noted, however, that to date SAPS have generally only been installed in residences that are not close toexisting electricity lines, and the cost of connection is therefore very high.4
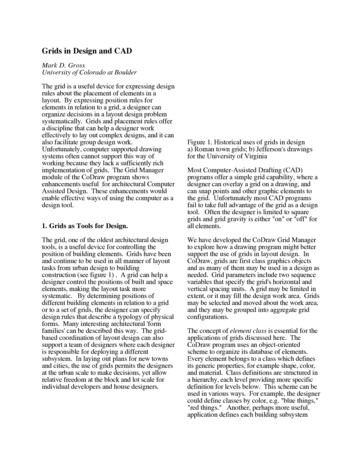
Value of a Grid Connection to Distributed Generation Customers17 November 2014Final ReportThe monthly costs of these two SAPS and those faced by the average Endeavour Energycustomer that does not have a PV system are compared in Figure 2 below.Figure 2: Monthly costs of two SAPS with those of a typical residential customer in Western Sydney 900 800 700 600 850 500 400 596 300 200 124 56 68 100 0Monthly cost of a SAPS with constrained air conditioning capabilityMonthly cost of a SAPS with a higher level of air conditioning capabilityNetwork component the monthly bill of an average customerNon-network component the monthly bill of an average customerSource: OGW analysisThe high cost of these systems is likely to mean that at least for some time most customers whoinstall rooftop PV systems to lower their bills and reduce the greenhouse gas emissionsassociated with their use of electricity will continue to maintain a connection to the grid. Theexception will be – as it is at present – where the cost of connecting to the grid is quite high due tothe distance from existing electricity lines. Expected reductions in the cost of batteries will reducethe cost disadvantage of these systems, but as the batteries account for about 40% of totalinstalled SAPS costs, even significant reductions here will have more modest impacts on overallcost-effectiveness.Finally, Figure 3 compares the 677 in annual network charges paid by a typical residentialcustomer in Western Sydney that does not have a rooftop PV system with the 453 in annualnetwork charges paid by a typical residential customer that uses a rooftop PV system and the 822 that the customer with a rooftop PV system receives in value from his or her grid connection.5
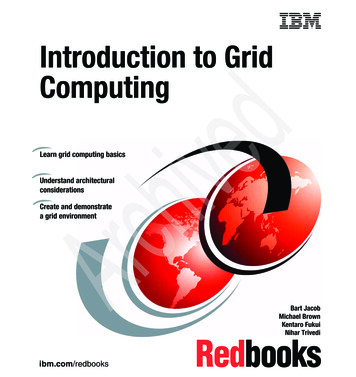
Value of a Grid Connection to Distributed Generation Customers17 November 2014Final ReportFigure 3: Comparison of the network charges paid by a customer without a PV system with the charges paidand value received by a customer with a rooftop PV system 900 800 700 600 500 822 676 400 300 453 200 100 0Network charges for a non-PV customerNetwork charges for a rooftop PV customerValue provided by the grid connection to a rooftop PV customerSource: OGW analysisRooftop PV systems have impacts on the gridA rooftop PV system that is connected to the grid has two important impacts on the grid that canaffect customers’ bills:It can reduce peak demand on the grid, which can delay and/or reduce the need for capitalexpenditure by the grid and therefore exert downward pressure on grid costs and the networkprices that need to be charged to customers in order to recover those costs.It reduces electricity consumption supplied by the grid. Given that network revenue isprimarily recovered through charges on consumption, this puts upward pressure on the perkilowatt hour (kWh) price the grid charges its customers.Where the fall in revenue recovered from customers with rooftop PV systems is greater than thereduction in future capital costs, rooftop PV system will have a net upward pressure on networkprices. To the extent that this upward pressure results in a higher price for each kWh of electricityconsumed, the annual bill of an average residential customer without a rooftop PV system will goup more than the bill of an average customer with a rooftop PV system, simply because the latterwill consume less electricity than the former. This essentially constitutes a cross-subsidy fromnon-PV customers to customers with rooftop PV systems.On the other hand, If the reduction in future capital costs is greater than the fall in revenuerecovered from customers with rooftop PV systems, the use of the rooftop PV system would exerta downward pressure on network prices, which would benefit all customers of the grid.Analysis of these impacts in the Endeavour Energy service area indicates that use of a rooftopPV system will:6
Value of a Grid Connection to Distributed Generation Customers17 November 2014Final Reportreduce the network component of the bill of the average residential electricity customer in theEndeavour Energy distribution system that uses a typical rooftop PV system byapproximately 223 per year 8;reduce the future annual capital expenditure requirements of the grid by approximately 125per year (made up of a fall in distribution network costs of approximately 109, andtransmission network costs of approximately 16 per year) 9; andthereby result in an annual cross-subsidy from non-rooftop PV residential customers to eachcustomer with a rooftop PV system of about 98.Figure 2 displays these values.Figure 4: Annual impacts of a rooftop PV system on the Endeavour Energy network and other customers 250 200 109 150 223 100 16 98 50 0Reduction in networkbill received byaverage PV customerBenefit provided by arooftop PV system tothe distribution systemBenefit provided by arooftop PV system tothe transmission systemNet cross subsidyreceived by the ownerof a rooftop PV systemSource: OGW analysisThe calculation of the cross-subsidy discussed above was undertaken assuming that peakdemand on the grid occurs at 4:30 PM Eastern Standard Time. However, the level of the subsidyis very sensitive to the actual time of grid peak demand. For example, if the time of peak demandwere 5:30 PM instead of 4:30 PM, the cross-subsidy increases substantially – from 98 to 163per annum. This is because the benefits accruing to the network business are smaller, due to8Calculated by multiplying the 2,044 kWh in reduced grid-supplied electricity due to the PV system multiplied byEndeavour Energy; variable charge for electricity consumption of 10.8934 cents per kWh.9Based on the published long-run marginal costs of Endeavour Energy and TransGrid.7
Value of a Grid Connection to Distributed Generation Customers17 November 2014Final Reportthe fact that the PV system produces much less energy at 5:30 PM than it does at 4:30 PM 10.However, because the PV system generates the same amount of electricity regardless of whenpeak demand occurs, and because customers are charged based on their total consumption andnot when that consumption occurs, the fall in the revenue from customers with rooftop PVsystems that needs to be recovered through higher charges remains the same regardless ofwhen peak demand occurs 11.In this regard, it should be noted that:the time of maximum demand can differ from one distribution system to another,as well as from one local area to another within a given distribution system, andthe time of peak demand in most distribution systems is occurring later in the day due insignificant part to the installation of rooftop systems which provide the electricity needed bythe household in the daylight hours but which rely on the grid once sun angles get low in thelate afternoon.ConclusionIt is clear that customers who install rooftop PV systems and maintain a grid connection derivesignificant value from that connection. However, these systems can also provide benefits to thegrid in terms of reduced peak demand which can reduce the future capital expenditurerequirements of the grid. The balance between the reduction in future capital costs and the lossof revenue recovered from customers with rooftop PV systems will determine whether networkprices go down, with benefits to all customers, or go up and impose a cross-subsidy fromcustomers who do not use rooftop PV systems to customers that do.In the Endeavour Energy service area, as discussed previously, customers with rooftop PVsystems receive significant benefits from those systems, but pay materially less for the gridservices they receive than do other customers, despite the fact that those other customers do notreceive any additional services from the grid. It is also the case that a significant portion of thedifference in the amounts paid is a cross-subsidy from customers who do not have rooftop PVsystems to customers that do.These findings also reinforce the need for pricing reforms that reflect the factors that drive thecost of providing network services. The current reliance on revenue recovery through chargeson energy consumption (a) increases the financial attractiveness of rooftop PV systems (andother measures) to customers, (b) results in potential cross-subsidies when that take-up occurs,and (c) thereby feeds the risk of a so-called ‘death spiral’.In sum, the form of pricing currently used provides a poor signal to customers of both:10If the time of peak demand were earlier, the PV system would produce more energy, and its impact on peak demandwould be greater and the cross-subsidy smaller. There are other factors that also affect these outcomes. In addition tothe impact of reduced (or increased) impact of the PV system on network peak demand described above, the cost ofaugmentation is also important. Where augmentation costs are lower, the cross-subsidy will be higher – because thereduction in peak demand has a lower benefit. It must also be remembered that augmentation of the network isundertaken at the local area level. The time of peak demand may vary across these local areas, as will the cost of theaugmentations required. The examples above have used average figures for simplicity.11An additional complicating factor is that there may already be sufficient capacity in the network. In such a case, thenetwork will not experience an actual reduction in capital expenditure in that year. More generally therefore, the actualvalue of the cross subsidy will change over time as the balance of the supply and demand of network capacity in thelocal area changes over time.8
Value of a Grid Connection to Distributed Generation Customers17 November 2014Final Reportthe factors that drive the cost of grid services, andthe value a connection to the grid provides.Given this, it would seem worthwhile to consider alternative pricing structures that better reflectthe cost incurred by the network in serving the customer. This would encourage moreeconomically efficient investment decisions – that is, decisions that would reduce or avoid crosssubsidies between customers, and reduce the long-term costs for all consumers.2.Background and purpose2.1.Current and forecast use of rooftop PV systems in the NEMThe dramatic increase in the use of small-scale distributed electricity generation systems –particularly rooftop solar PV systems – has been well documented. From virtually none of thesesystems being used at the household or business level in 2000, the Clean Energy Regulatorestimates that, as at 1 June 2014, a total of 1,237,152 solar PV systems had been installedaround Australia with a total nameplate generation capacity of 3,420 MW 12.These systems have delivered material reductions in the electricity bills of the customers thathave installed them, and have also reduced the greenhouse gas emissions associated with theelectricity consumed by these end users. It is also clearly the case that, as long as electricitypeak demand occurs during daylight hours, rooftop PV systems are likely to help satisfy thatdemand.Further, a number of studies – including the most recent forecast issued by the Australian EnergyMarket Operator (AEMO) – project that installations will continue to grow based on continuingreductions in the price of PV panels. Battery storage systems are also expected to experiencematerial reductions in cost, which will provide the potential for consumers to further reduce theirreliance on the grid for the electricity they need. There is also evidence that the average size ofthe systems being installed is increasing. For example, the average size of the rooftop PVsystems that have been installed to date in NSW is about 2.6 kW – but the systems going in atpresent tend to be in the 4 kW range 13. New business models and potential changes in theNational Electricity Rules (NER) may also facilitate significant increases in take-up by commercialand industrial end users. As will be discussed later, the potential for continued upward pressureon electricity prices would also encourage more take-up of rooftop PV systems – especially ifthose price increases are predominately placed on the cost of each kWh of electricity consumed.More specifically, AEMO’s 2014 National Electricity Forecast Report (NEFR) anticipates thatelectricity consumption among residential and commercial customers will fall by 0.5% annuallythrough 2016-17, and that the key drivers of this are strong growth in (a) rooftop PV installations(forecast at 24% annually), particularly in Queensland and Victoria, and (b) energy efficiencysavings (forecast at 10% annually). In the medium to long term (2016-17 to 2023-24) AEMOforecasts residential and commercial electricity consumption to increase slightly, with the averageannual increase over this period being 0.2%. This results in
Value of a Grid Connection to Distributed Generation Customers prepared for: Energy Networks Association. DISCLAIMER . This report has been prepared for the Energy Networks Association (ENA).