Transcription
National Institute of Technology CalicutDepartment of Mechanical EngineeringMASTER PRODUCTION SCHEDULE (MPS) Anticipated build schedule for manufacturing endproducts (or product options) A statement of production, not a statement of marketdemand MPS takes into account capacity limitations, as well asdesires to utilize capacity fully Stated in product specifications – in part numbers forwhich bill of material exist Since it is a build schedule, it must be stated in termsused to determine component-part needs and otherrequirements; not in monetary or other global unit ofmeasure Specific products may be groups of items such as modelsinstead of end items The exact product mix may be determined withFinal Assembly Schedule (FAS), which is notascertained until the latest possible moment If the MPS is to be stated in terms of productgroups, we must create a special bill of material(planning bill) for these groupsTask performed by a master production schedulerConstruct and update the MPS Involves processing MPS transactions, maintainingMPS records and reports, having a periodic reviewand update cycle (rolling through time), processingMPS1March 2016
National Institute of Technology CalicutDepartment of Mechanical Engineeringand responding to exception conditions, andmeasuring MPS effectiveness on a routine basis On a day-to-day basis, marketing and productionare coordinated through the MPS in terms of OrderPromising Order promising is the activity by which customerorder requests receive shipment datesAn effective MPS provides Basis for making customer delivery promises Utilising plant capacity effectively Attaining the firm’s strategic objectives as reflectedin the production plan and Resolving trade-off between manufacturing andmarketing Since MPS is the basis for manufacturing budgets, thefinancial budgets should be integrated with productionplanning/MPS activities When MPS is extended over a time horizon, is a betterbasis for capital budgeting Based on the production output specified in the MPS theday-to-day cash flow can be forecasted The MPS should be realizable and not overstated When scheduled production exceeds capacity, usuallysome or all of the following occur: Invalid priority Poor customer service (missed deliveries)MPS2March 2016
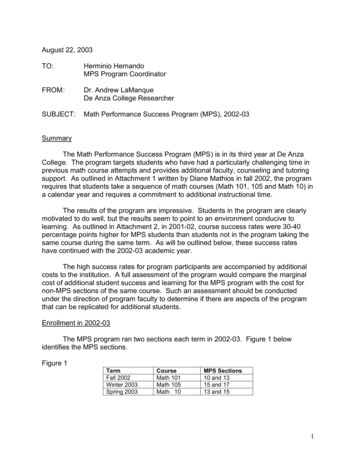
National Institute of Technology CalicutDepartment of Mechanical Engineering Excess in-process inventories High expediting costs Lack of andmanagementMasterProductionScheduleFront EndMaterialRequirementsPlanning (MRP)Material andCapacity msBack EndFig. 1: Manufacturing Planning and Control SystemMPS3March 2016
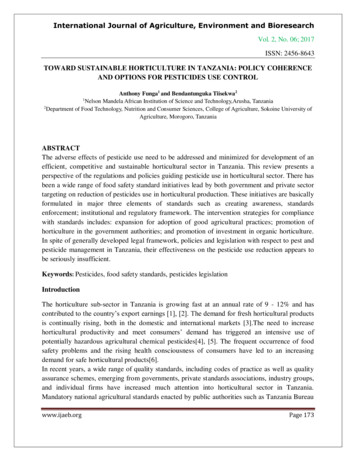
National Institute of Technology CalicutDepartment of Mechanical EngineeringCapacity constraintsForecastsWhat to produceMasterSchedulingProduction planCustomer orderWhen to produceHow much to produceProduct lead time constraintsFig. 2: The Master Production ScheduleLinkage to Other Company ActivitiesThe Demand Management Block Represents a company’s forecasting, order entry, orderpromising and physical distribution activities Includes all activities that place demand onmanufacturing capacities Demand may be actual and forecast customer rements, international requirements and servicepart requirementsThe Production Plan Block Represents role of production in the strategic businessplan of the companyMPS4March 2016
National Institute of Technology CalicutDepartment of Mechanical Engineering Reflects the desired aggregate output frommanufacturing necessary to support the companygame plan The aggregate plan constraints the MPS, since the sumof the detailed MPS quantities must always equal thewhole dictated by the production planThe Rough-cut Capacity Planning Block Provides a rough evaluation of potential capacityproblems from a particular MPSStructured Approach to Master Scheduling Select the items and /or levels in the product structureto be included in the master schedule Determine the time horizon and time fences for themaster schedule Obtain demand information for each item in theschedule over the time horizon Prepare tentative master schedule Perform rough-cut capacity planning on the tentativemaster schedule Revise the tentative master schedule so it is capacityfeasibleNote on Master Schedule Stability Freezing and time fencing concepts are used for stability No changes (or changes only after tougher negotiations)incorporated in certain number of recent periods of theschedule in the case of freezingMPS5March 2016
National Institute of Technology CalicutDepartment of Mechanical Engineering Frozen period provides a stable target for manufacturingto hit Time fences specify periods in which various types ofchanges can be handled Two common fences are demand fence and planningfence Demand fence is the shorter of the two Inside the demand fence, the forecast is ignored incalculating the available Within the demand fence it is very difficult to change theMPS Planning fence indicates the time at which the masterproduction scheduler should be planning more MPSquantities Between the demand fence and the planning fence,management trade-offs must be made to make changes Outside the planning fence, the master productionscheduler can make changesMPS6March 2016
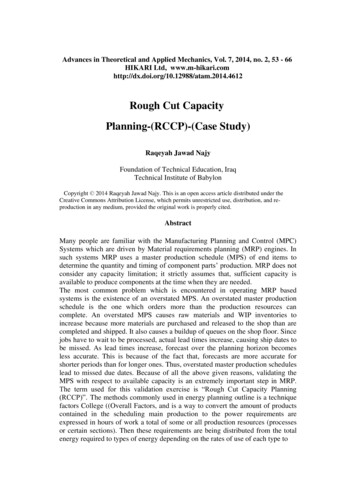
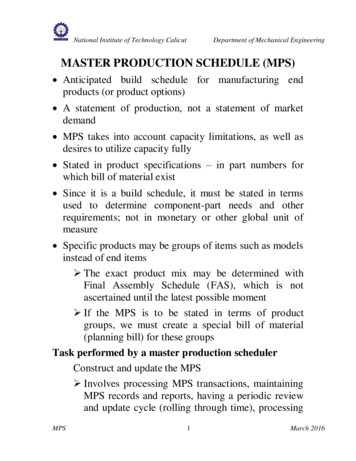
National Institute of Technology CalicutTodayDepartment of Mechanical EngineeringPTFDTFZone 1Zone 2Zone 3Master scheduleProduction PlanAssemble ProductMfg. PartsPurchase Material Aggregate PlansCumulative lead timeDTF Demand time fence; PTF Planning time fenceFig. 3: Master Schedule Time FencesBusiness Environment and MPS Encompasses the production approach used, the varietyof products produced, and the markets served by thecompany Based on the marketing environment the firms areclassified asMake-to-stock, Make-to-order and Assemble-to-orderThe MPS approach to this environment The choice between these alternatives is largely one ofthe unit (end items, specific customer orders, or somegroup of end items and product options) used for theMPSMPS7March 2016
National Institute of Technology CalicutDepartment of Mechanical EngineeringMake-to-stock Produces in batches, carry finished goods inventories formost end items MPS is the production statement of how much of andwhen each end items is to be producedE.g.:- Consumer goods and supply items Many organisations tend to group end items into modelgrouping in the MPS preparation The end item information is delayed until the latestpossible time and the end item schedule is available inthe final assembly schedule. All product so grouped are run together in batches toachieve economical run for component partsMake-to-order Carry no finished goods inventory and builds eachcustomer order as needed Very large number of possible production configurations Small probability of anticipating a customer’s exact need Customers expect to wait for a large portion of the entiredesign and manufacturing lead timeE.g.: - Special purpose machine tools MPS unit is typically defined as the particular end itemor set of items comprising a customer orderMPS8March 2016
National Institute of Technology CalicutDepartment of Mechanical EngineeringAssemble-to-order Limitless number of possible end item configurations, allmade from combination of basic components andsubassemblies Customer delivery time is often shorter than totalmanufacturing lead time Large number of end item possibilities makes forecastingexact end item configurations extremely difficult andstocking end items very risky Tries to maintain flexibility by starting basic componentsand subassemblies into production and not starting finalassembly until a customer order is receivedE.g.: - Dell computers The MPS unit is stated in planning bills of material The MPS unit (Planning bill) has its components as a setof common parts and optionsNote Choice of MPS unit is somewhat open to definition bythe firm Some firms may produce end items that are held ininventory, yet still use assemble-to-order approaches Some firms use more than one of these approaches at thesame timeStructural Features Identifying the general product structure of anorganisation and locating the point of greatestMPS9March 2016
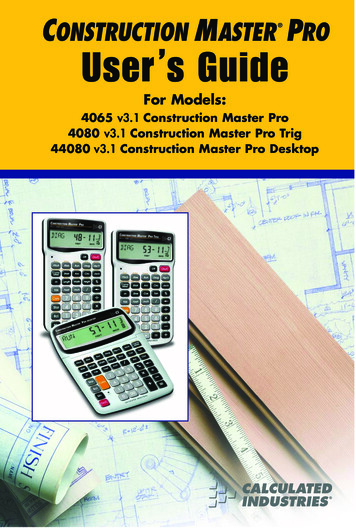
National Institute of Technology CalicutDepartment of Mechanical Engineeringcommonality – the narrowest part of the productstructure helps organisations to identify the MPS unit orlevelFinishedproductFinishedproductLimited number ofstandard Itemsassembled fromcomponentsMany items made fromcommon subassembliesFinishedproductMany items made fromlimited number ofmaterialsFig. 4: General Product StructuresTable 1: Master Schedule LevelsEnvironmentForecastMaster schedule levelClassificationMake-to-stock End itemsEnd itemsSingle-levelmaster scheduleMake-to-order None requiredDLT PLTEnd item from actualordersSingle-levelmaster scheduleMake-to-order Families withplanning billDLT PLTFamily planning billand percentage of enditemsTwo-levelmaster scheduleAssemble-toorderGeneric end item andpercentage of optionsTwo-levelmaster scheduleGeneric enditem withplanning billDLT Delivery lead time; PLT Product lead timeMPS10March 2016
National Institute of Technology CalicutDepartment of Mechanical EngineeringVehiclesOne of 2EnginesOne of 4InteriorsOne of 3TransmissionsOne of 5BodiesNumber of possible models (2)(4)(3)(5) 120combinationsNumber of product modules 2 4 3 5 14OptionsPLANNINGBILLEngine A0.60Engine B0.40Interior C0.40Transmissions G0.60Interior D0.30Transmissions H0.25Interior E0.20Transmissions I0.15Interior F0.10Body J0.30Body K0.30Body L0.20Body M0.10Body N0.10Fig. 5: An Example of Planning Bill of MaterialMPS11March 2016
National Institute of Technology CalicutDepartment of Mechanical EngineeringMaster Production Scheduling Technique MPS record is a time-phased record to showrelationships between production output, sales forecast,and expected inventory balanceWeek Number1 2 3 4 5 6 7 8Forecast 10 10 10 10 10 10 10 10Available 5 5 5 5 5 5 5 5MPS- 10 10 10 10 10 10 10On hand 15910510101051011105101210510Fig. 6: A time-phased MPS record The above record (Fig. 6) is a highly simplified exampleof master production schedule involving an item with abeginning inventory of 15 units, sales forecast of 10 unitsper week, and MPS of 10 units per week as well The MPS row states the timing for completion of unitsavailable to meet demand The details for starting production of the variouscomponents and assembly of the product are taken careof by the MRP system The “available” row represents the expected inventoryposition at the end of each week Any negative values in the available row representsexpected back orders An MPS is allocated to a period where availableinventory quantity is equal to zero or less if MPS is notallocatedMPS12March 2016
National Institute of Technology CalicutDepartment of Mechanical Engineering Reason for carrying positive projected inventory balance Forecasts involve some degree of error, and the MPSis a plan for production that may not be exactlyachieved Projected inventory balance provides a tolerance forerrors that buffers production from sales variationsVarious MPS approaches for seasonal productsThe forecast for the next 12 weeks is given in Fig. 7 whichshows an average demand of 10 units and the MPS plannerplans 10 units as MPS in every week as the planner followsa level strategy. Currently the planner has 20 units as onhand inventory. (This on-hand inventory, the plannermaintains to buffer against demand variability, andproduction uncertainty which will be reflected as MPSvariability.) The MPS record in that case is as shown inFig. 7.Week Number1 2 3 4 5 6 7 8Forecast 5 5 5 5 5 5 15 15Available 25 30 35 40 45 50 45 40MPS10 10 10 10 10 10 10 10On hand 209153510101530101115251012152010Fig. 7: Level StrategyFor the same situation given above (for the level strategy),the MPS record, when chase strategy is followed, is givenin Fig. 8. In this strategy also the planner uses the on-handinventory to buffer against demand and MPS uncertainty.MPS13March 2016
National Institute of Technology CalicutDepartment of Mechanical EngineeringWeek Number1 2 3 4 5 6 7 8Forecast 5 5 5 5 5 5 15 15Available 20 20 20 20 20 20 20 20MPS5 5 5 5 5 5 15 15On hand 209152015101520151115201512152015Fig. 8: Chase strategyThere are many alternative MPS plans possible betweenthese two extremes.Lot sizing in MPSWhenever an MPS is planned, the lot size is 30 units. Therecord given in Fig. 9 shows that the MPS planner plans anMPS quantity, when available quantity is zero or negative.Week Number1 2 3 4 5 6 7 8 9Forecast 5 5 5 5 5 5 15 15 15Available 15 10 5 30 25 20 5 20 5MPS3030On hand 2010 11 1215 15 1520 5 203030Fig. 9: MPS with Lot sizing Manufacturing in batches produces inventories that lastbetween production runs. This inventory is called cyclestock.Safety Stock in MPS Revise the MPS in the Fig. 9 considering a safety stockof 5 units. Assume that the on-hand contains the safetystock. Fig. 10 shows the revised MPS record.MPS14March 2016
National Institute of Technology CalicutDepartment of Mechanical EngineeringWeek Number1 2 3 4 5 6 7 8Forecast 5 5 5 5 5 5 15 15Available 15 10 35 30 25 20 35 20MPS3030On hand 20Safety stock 59 10 11 1215 15 15 1535 20 35 203030Fig. 10: Modified MPS record considering safety stockRolling Through Time This helps to updates the record to reflects the actualconditions It is necessary not only to construct the MPS but also toprocess actual transactions and modify the MPS Consider the MPS record given in Fig. 9. The first week is over and the following changesoccurred: The actual sales were 10 units in the firstweek instead of 5 units and a different forecast isavailable for the next 12 weeks. The new forecast at the end of the first week is for 10units per week for the next 5 weeks and 15 units perweek for the following 7 weeks (7 through 13). The new 12-week forecast incorporates 25 more unitsthan the original 12-week forecasts in the first fiveweeks. The implication of this (without revising the MPS) isavailable in Fig. 11.MPS15March 2016
National Institute of Technology CalicutDepartment of Mechanical EngineeringWeek Number2 34 5 6789Forecast 10 10 10 10 10 15 15 15Available 0 -10 10 0 -10 -25 -10 -25MPS3030On hand 1010 1115 15-10 -253012 1315 15-10 2530Fig. 11: Using the revised forecast after one weekThe MPS record shown in Fig. 11 indicates that the planhas several periods with shortages.The planner revises the plan considering allocation of MPSquantity in a period when available becomes zero ornegative is given in Fig. 12.Week Number2 3 4 5 6 7 8 9Forecast 10 10 10 10 10 15 15 15Available 30 20 10 30 20 5 20 5MPS303030On hand 1010 11 12 1315 15 15 1520 5 20 53030Fig. 12: MPS revised to accommodate revised forecast afterone week Identify the problems associated with the revised MPSgiven in Fig. 12.As per the plan in Fig. 9, the production department has togive 30 units in week 4 of the production calendar, but therevised plan asks this quantity by now (week 2 ofproduction calendar). This is impossible.MPS16March 2016
National Institute of Technology CalicutDepartment of Mechanical EngineeringProduction department has to give 30 units in week 5 as perthe plan in Fig. 12 which as per the plan in Fig. 9 is toprovide only in week 8. This is also a difficult task for theproduction department. Assume that the MPS planner was preparing the planwith safety stock (of 15 units) regularly and as a resultthe on-hand inventory for the first period is 35 units. Theplan in Fig. 9 modified on the basis of on-hand 35 unitsand safety stock 15 is as shown in Fig. 13.Week Number1 2 3 4 5 6 7 8 9Forecast 5 5 5 5 5 5 15 15 15Available 30 25 20 45 40 35 20 35 20MPS3030On hand 35 Safety stock 1510 11 1215 15 1535 20 353030Fig. 13: MPS plan in Fig. 9 modified considering on-hand 35and safety stock 15When the plan is as shown in Fig. 13, the rolling throughtime resulted in the plan as shown in Fig. 14. In this planno changes is made in MPS.Week Number2 3 4 5 6 78 9Forecast 10 10 10 10 10 15 15 15Available 15 5 25 15 5 -10 5 -10MPS3030On hand 25 Safety stock 1510 1115 155 -103012 1315 155 -1030Fig. 14: Modified MPS plan in Fig.13 after rolling throughtimeFig. 14 shows that the severity of the problem due tochange in current demand and forecast are less compared tothe plan in Fig.11.MPS17March 2016
National Institute of Technology CalicutDepartment of Mechanical EngineeringOrder Promising For many products, customers do not expect immediatedelivery, but place orders for future delivery The delivery date (promise date) is negotiated through acycle of order promising, where the customer either askswhen the order can be shipped or specifies a desiredshipment date If the company has a backlog of orders for futureshipments, the order promising task is to determine whenthe shipment can be made The delivery date promise procedure is explained with anMPS record of an item shown belowWeek Number1 2 3 4 5 6 7 8 9Forecast 5 5 5 5 5 5 15 15 15Available 15 10 5 30 25 20 5 20 5MPS3030On hand 2010 11 1215 15 1520 5 203030Fig. 15: A typical MPS plan for ATP incorporation To decide the promise date the quantity available forpromise is to be known Available-to-promise (ATP) is the term used torepresent this quantityConventions used in the MPS record with order promise Forecast row shows the forecasting when items will beshippedMPS18March 2016
National Institute of Technology CalicutDepartment of Mechanical Engineering There is a row labeled “Orders” represents thecompany’s backlog of orders at the start of first week The frequently used convention in the case of availablerow is to use the greater of forecast or booked orders inany period for projecting the available inventory balance This is consistent with the concept that actual orders,“consume” the forecast That is, we start out with an estimate (the forecast), andactual orders come into consume (either partially, fully,or over the estimate) Calculation procedure associated with available row isCurrent period available Previous period available MPS – (Greater of forecast or orders) An ATP value is calculated for each period in whichthere is an MPS quantity and also for the first period To calculate the available to promise only the actualorders and scheduled production are considered ATP calculation procedureFist period ATP On-hand any first-period MPS - (all orders until the next MPS)Later period ATP MPS in that period - (all ordersin that and subsequent periods until the next MPS)Both of these rules, however, have to be modified toreflect subsequent periods ATP deficienciesMPS19March 2016
National Institute of Technology Calicut1Forecast 5Orders5Available 15ATP10MPSOn hand 2025310Department of Mechanical EngineeringWeek Number5 6 7 8 9 10 11 125 5 15 15 15 15 15 153 45 525 30 25 20 5303020 5303020 53030203030Fig. 16: MPS record with ATP Suppose an order for 35 units was booked for week 10 inthe current period for the above item The ATP row changes as follows1Forecast 5Orders5Available 15ATP10MPSOn hand 20253103525Week Number4 5 6 7 8 9 10 115 5 5 15 15 15 15 153530 25 20 5 20 5 0 -1530250303030121503030Fig. 17: MPS Record with ATP showing ATP calculationunder subsequent period ATP deficiency Note that the later customer orders are covered by thelater MPS quantities The 35 units order for week 10 could have been coveredby 10 units in week 1 plus 25 units from the MPS ofweek 4.MPS20March 2016
National Institute of Technology CalicutDepartment of Mechanical Engineering This would have left no units for promising from week 1until week 3, greatly reducing promise flexibility The convention is to preserve early promise flexibility byallocating units to actual orders as late as possible The available row provides the master productionscheduler with a projection of the item availabilitythroughout the planning horizon This is important information for managing the masterproduction schedule A negative available quantity at the end of the planninghorizon is a signal for more MPS During the planning horizon there is typically somelength of time in which changes are to be made only ifabsolutely essential, to provide stability for planning andexecution At the end of this period, master production schedulershave maximum flexibility to create additional MPSquantity Accurate order promising allows the company to operatewith reduced inventory levels That is, order promising allows the actual shipments tobe closer to the MPS Companies in effect buffer uncertainties in demand bytheir delivery date promises Firms manage the delivery dates rather than carry safetystock to absorb uneven customer order patternMPS21March 2016
National Institute of Technology CalicutDepartment of Mechanical EngineeringExercise Problem1. ProblemNeptune Manufacturing Company’s production managerwants a master production schedule covering next year’sbusiness. The company produces a complete line of smallfishing boats for both saltwater and freshwater use andmanufactures most of the components part used inassembling the products. The firm uses MRP to coordinateproduction schedule of the component part manufacturingand assembly operations. The production manager has justreceived the following sales forecast for next year from themarketing RaySeriesTotalSales Forecast (standard boats for each series)1 Quarter 2nd Quarter 3rd Quarter 4th ,00010,0006,0007,00021,00024,00014,00015,000The sales forecast is stated in terms of “standard boats”,reflecting total sales volume for each of the firm’s threemajor product lines.Another item of information supplied by marketingdepartment is the target ending inventory position for eachproduct line. The marketing department would like theproduction manager to plan on having the followingMPS22March 2016
National Institute of Technology CalicutDepartment of Mechanical Engineeringnumber of standard boats on hand at the end of each quarterof next year:Product LineQuarterly TargetEnding Inventory(In Standard Boats)FunRay series 3,000 boatsSunRay series 1,000 boatsStingRay series 3,000 boatsThe inventory position for each product is:Product LineCurrent Inventory level(In Standard Boats)FunRay series 15,000 boatsSunRay series 3,000 boatsStingRay series 5,000 boatsThe master production schedule specify the number ofboats (in standard units) to be produced for each productline in each quarter of next year on the firm’s singleassembly line. The assembly line can produce up to 15,000standard boats per quarter (250 boats per day during the 60days in a quarter).Two additional factors are taken into account by theproduction manager in preparing the master productionschedule: the assembly line changeover cost and theinventory carrying cost for the finished goods inventory.Each assembly line changeover costs 5,000 reflectingmaterial handling costs of changing the stocking ofcomponent part on the line, adjusting the layout, and so on.After some discussion with the company comptroller, theproduction manager concluded that the firm’s inventoryMPS23March 2016
National Institute of Technology CalicutDepartment of Mechanical Engineeringcarrying cost is 10 percent of standard boats cost per year.The item value for each of the product line standard unitsis:Product LineStandard Boat CostFunRay series 100SunRay series150StingRay series 200The master production scheduler has calculated theproduction lot sizes as 5,000, 3,000 and 4,000 units,respectively.a) Develop a master production schedule for next year, byquarter, for Neptune’s fishing boat line. Identify anyproblems.b) Verify the lot size calculations using the EOQ formula.Solution for part (a) of the problemWhen the MPS is prepared here, the constraints to besatisfied are demand, capacity, end of the period inventoryand lot sizing. Prepare a tentative MPS satisfying demandand lot sizing constraints. If the planned production is morethan the lot size, the production batch is determined as theplanned quantity for meeting the requirements.FunRay SeriesPeriod1Forecast8000Available7000MPSOn-hand March 2016
National Institute of Technology CalicutDepartment of Mechanical EngineeringSunRay SeriesPeriodForecastAvailableMPSOn-hand 3000StingRay SeriesPeriodForecastAvailableMPSOn-hand heduled production for assembly lineFunRay seriesSunRay seriesStingRay 00600014,00050003000700015,000MPS quantity in 2 nd quarter is higher than the capacity.Also, the required quarterly ending inventory is notachieved using the tentative MPS.Now, considering the excess capacity available in certainperiod, try to satisfy the capacity constraint. The capacityand demand constraints should be satisfied, and the lotsizing and end of the period inventory constraints should besatisfied to the maximum possible extend.MPS25March 2016
National Institute of Technology CalicutDepartment of Mechanical EngineeringModified MPSFor StingRay series, modify the planned production as11000 units in first period and for SunRay series, modifythe first period MPS quantity as 4000 units.FunRay SeriesPeriod1Forecast8000Available7000MPSOn-hand 15,000Lot Size 5000Ending inventory 00300032000200030004200010001000SunRay SeriesPeriodForecastAvailableMPSOn-hand 3,000Lot Size 3000Ending inventory 10001400030004000StingRay SeriesPeriodForecastAvailableMPSOn-hand 5000Lot Size 4000Ending inventory 0004700030007000March 2016
National Institute of Technology CalicutDepartment of Mechanical EngineeringMPS quantities for assembly lineFunRay seriesSunRay series 4000StingRay series ,00060001000700014,000Above MPSs are satisfying production capacity constraintsand end of the period inventory constraints. The lot sizingconstraints are satisfied under the modified rule (If MPSquantity is greater than suggested lot size, then the lot sizeis equal to MPS quantity.). But this constraint is notsatisfied for period 4 of SunRay series. The constraints the end of the period inventory given is considered as theminimum requirement.Think of some modification for SunRay series consideringexcess capacity available in period 3 and without any MPSquantity in period 4.2. Problem(a) Complete the following MPS time phased record of theproduct.ForecastOrdersAvailableAvailable to promiseMPSWeek1 2 3 4 5 6 7 820 20 20 30 30 30 30 3025 15 12On hand 20, MPS lot size 50.(b) The following events occurred during week 1: Actual demand during week 1 was 30 units.MPS27March 2016
National Institute of Technology CalicutDepartment of Mechanical Engineering Marketing forecasted that 40 units would be neededfor week 9. An order for 10 in week 2 was accepted. An order for 20 in week 4 was accepted. An order for 60 in week 6 was accepted. The MPS in week 1 was produced as planned.Update the record after rolling through time. Assume thatthe demand time fence (DTF) is 4 weeks. Management isnot interested to make any change in quantity and period ofMPSs in DTF. Do you have any difficulty after rollingthrough week 1?Solution(a)Week1 2 3 4 5 6Forecast20 20 20 30 30 30Orders25 15 12Available45 25 5 25 45 15Available to promise 1850 50MPS5050 507 830 3035 55050On hand 20, MPS lot size 50.(b) When the record is processed at the end of week 1 andno change in MPS is made in DTF, the MPS record is asfollows:MPS28March 2016
National Institute of Technology Calicut2Forecast20Orders25Available15*Available to promise 3MPS320123*Department of Mechanical Engineering4302033*2050Week5630 3060*83 230**507 8 930 30 4043 13 2350505050On hand 40, MPS lot size 50.* Only orders are considered for available to calculate** If you use the ATP (available to promise) calculationmethod, the ATP quantity is negative. But the ATPquantity available in the immediate previous period is usedto meet the actual order of succeeding period and hence theATP for the period 5 is made zero. Note that the latercustomer orders are covered by the later MPS quantities.Incorporation of MPS execution related information inthe MPS recordConsider the record in the part (a) of problem 2. Assumethat the lead time for this item is two weeks when itsimmediate components (i.e., first level item in its bill ofmaterial) are available. The record can be modified toinclude the planned order release and scheduled receipt.The MPS 50 units in week 1 of the record shows that 50units will be received in the beginning of week 1 to thefinished goods inventory. That is, a production order mighthave been released in an early week and based on thisproduction order, production activities might be going-onMPS29March 2016
National Institute of Technology CalicutDepartment of Mechanical Engineeringin the production shops. The record will be moreinformative if the order receipt and order releases areshown in it. The record below shows these details in anMPS record.Week1 2 3 4 5 6Forecast20 20 20 30 30 30Orders25 15 12Available45 25 5 25 45 15Available to promise 1850 50MPS5050 50Scheduled receipt50Planned order release50 5050MPS307 830 3035 55050March 2016
Planning fence indicates the time at which the master production scheduler should be planning more MPS quantities Between the demand fence and the planning fence, management trade-offs must be made to make changes Outside the planning fence, the mast