Transcription
August 22, 2003TO:Herminio HernandoMPS Program CoordinatorFROM :Dr. Andrew LaManqueDe Anza College ResearcherSUBJECT:Math Performance Success Program (MPS), 2002-03SummaryThe Math Performance Success Program (MPS) is in its third year at De AnzaCollege. The program targets students who have had a particularly challenging time inprevious math course attempts and provides additional faculty, counseling and tutoringsupport. As outlined in Attachment 1 written by Diane Mathios in fall 2002, the programrequires that students take a sequence of math courses (Math 101, 105 and Math 10) ina calendar year and requires a commitment to additional instructional time.The results of the program are impressive. Students in the program are clearlymotivated to do well, but the results seem to point to an environment conducive tolearning. As outlined in Attachment 2, in 2001-02, course success rates were 30-40percentage points higher for MPS students than students not in the program taking thesame course during the same term. As will be outlined below, these success rateshave continued with the 2002-03 academic year.The high success rates for program participants are accompanied by additionalcosts to the institution. A full assessment of the program would compare the marginalcost of additional student success and learning for the MPS program with the cost fornon-MPS sections of the same course. Such an assessment should be conductedunder the direction of program faculty to determine if there are aspects of the programthat can be replicated for additional students.Enrollment in 2002-03The MPS program ran two sections each term in 2002-03. Figure 1 belowidentifies the MPS sections.Figure 1TermFall 2002Winter 2003Spring 2003CourseMath 101Math 105Math 10MPS Sections10 and 1315 and 1713 and 151
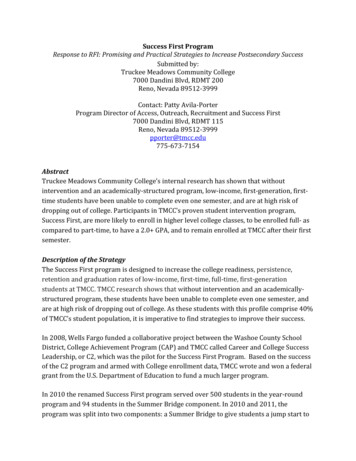
As outlined in Figure 2, 52-64 students enrolled in MPS math courses during thethree terms, and 739-807 students enrolled in other sections of the same math courses.Figure 2TermFall 2002Winter 2003Spring 2003# MPSSections222CourseMath 101Math 105Math 10# MPS CourseEnrollment525564Figure 3 lists the ethnic group percentages in each course. The MPS sectionshave twice as many African American and Hispanic students on a percentage basis, ascompared to the non-MPS sections. Overall, about 40% of MPS students are ofHispanic origin. For De Anza College, about 10% of students each term identifythemselves as Hispanic.Figure 3MPS and Non-MPS Section Student EthnicityBy Percentage of Course EnrollmentDe Anza College, 2002-2003AsianAfricanAmerican FilipinoNativeHispanic AmericanPacificIslander WhiteOtherMATH101. 5. . e: End of Term Enrollment File.2
MethodologyThe computation of Pass (i.e. course “success”) uses the grades captured in theend of term enrollment file. Figure 4 outlines the major definitions used in thecalculations. As noted in Figure 4, the pass rate for each course does not includestudents who dropped before receiving a grade of W.Figure 4DefinitionsThe following definitions were used in the calculations.The data reported is from the official end of termenrollment files.Pass: includes grades of A,B,C or PDid Not Pass:D,F,NP or IWithdrew:WFor the course GPA calculation, A 4, B 3, C 2, D 1,all other grades are coded as 0.Percents are based on the total grades for the class(including W’s) at the end of the term. Students who dropthe class before the 3rd week are not counted.Ethnicity- ‘Under Represented’ includes students whoselected on the application for admission one of thefollowing groups: African American, Filipino, Hispanic,Native American, Pacific Islander.All other groups, including Asian, White, Other andDecline to State are listed as “All Other.”Language results are based on an application foradmission question that reads:"Primary Language: English [or] Not English."Not English has been translated into “English Learner.”Not all students answer this question.3
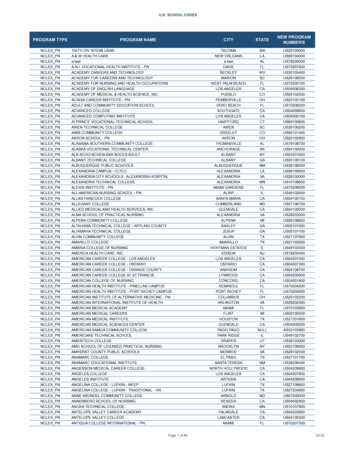
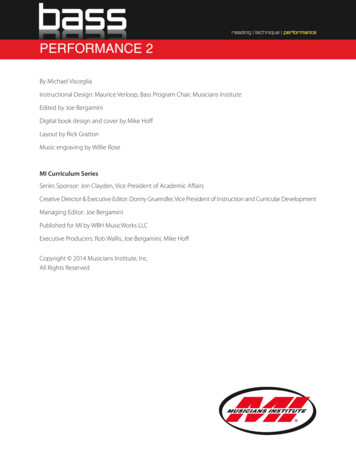
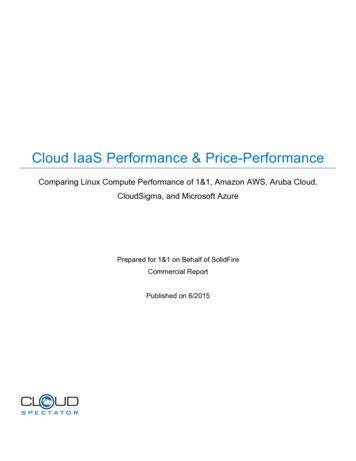
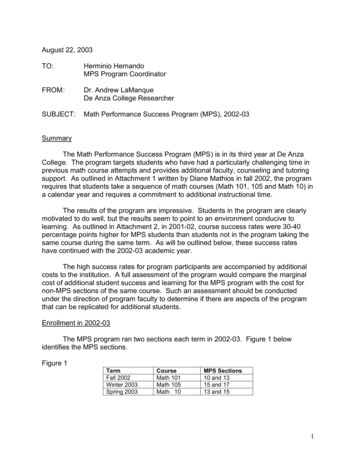
ResultsAs graphed in Figure 5 below, for the three terms / courses combined, 89% ofMPS students passed compared to 59% of non-MPS students. Similar results outlinedin Attachment 3 hold for each course, with Math 101 showing the largest difference inpass rates between MPS students (90%) and non-MPS students (49%) in fall 2002.Figure 5Percent A, B, C, or P GradesMPS and Non-MPS Students 2002-03Math 101, 105, 10, De Anza on-MPSSuccessfulAttachment 3 outlines additional comparisons on the program. When coursegrades are converted to numerical scores, the average course grades for the twogroups are statistically different, with MPS students scoring higher grades on average.The difference in program results holds across ethnicity. However, furtheranalysis reveals that African American student success as a group lags behind that ofHispanic students. For example, while 95% of Hispanic students passed Math 101,only 60% of African American students passed. The African American numbers aresmall: Only 5 students were enrolled in the MPS Math 101 in fall 2002, and the successrate is still well above the rate for non-MPS students (35% in Math 101, fall 2002) butthe difference suggests further tracking is warranted.In Math 101 and Math 10, male students in the MPS program had higher passrates than female students (94% versus 89% and 95% versus 87%, respectively). Thisresult was the opposite for non-MPS students, with female students scoring higher passrates in Math 101 and Math 10 but not Math 105. While the number of students issmall, it may warrant additional investigation into the learning / teaching styles of theparticipants and instructors.4
Again, while the number of students in each category is small, it is interesting tonote that English Learners tended to pass at higher rates than students who indicatedthat English was their primary language. These results held true for both MPS and nonMPS students.SummaryAs measured by course pass rates, MPS students do better on average thanstudents not in the program. While not measuring learning directly, this result suggeststhat students learn more math skills / knowledge in the MPS program than they wouldhave otherwise. It is suggested that future assessments examine the learning thattakes place in both MPS and non-MPS sections via an instrument that measureslearning directly, for example, the same end of term exam given to all students passingthe same course. Future work might also compare the instructional methods used inthe MPS sections to those found in non-MPS sections.5
Attachment 1Math Performance Success ProgramDiane Mathios, Fall 2002The Math Performance Success Program (MPS) offers students a teamapproach to success, particularly for those who have had difficulty in previous mathcourses. Instructors, counselors and tutor/mentors collaborate to help studentscomplete their mathematics requirements. Students take elementary algebra in the fall,intermediate algebra in the winter, and a college-transferable math class in the spring.Two sections each quarter of MPS classes are offered.The MPS Program serves a diverse group of students. Students are recruitedfrom several De Anza College programs, including SLAMS, STARS, EOPS, PUENTE,DSS and EDC. In addition, the program actively seeks to include students from thosegroups who have traditionally had poor success in basic skills and college mathcourses.Students in the MPS Program attend class for two hours of instruction. Thisinstructional time provides both whole class activities as well as collaborative groupwork, with group work comprising about 50% of the instructional time. The courseinstructors collaborate on the instruction, using a common calendar, similar activitiesand common tests. Mentor/tutors are available during the class to assist students whohave questions about the material.A counselor is available for each class section. The counselor and instructorwork closely to ensure student success. The counselor is available daily during class totalk to students regarding their grade to date, missing assignments and absences. Inaddition, the counselor provides individual and academic counseling for students in theprogram. The MPS team of instructors and counselors meets on a weekly basis to planprogram activities and discuss concerns related to students’ achievement in the class.In addition to in-class tutoring, the program offers students group tutoring outsideof class. Each week, approximately 40 hours of tutoring are offered at various timesthroughout the day and early evening. The tutors are trained to reinforce the methodsand approach taught in the regular class. For students interested in working with otherstudents outside of class, study groups have been formed. Whenever possible, a tutoralso attends the study group to assist with student questions.The program also arranges for guest speakers to visit the classes. Thesespeakers have included men and women working in technical fields, motivationalspeakers, and informational sessions on transfer agreements to the UC or CSU system.MPS Program team members are dedicated to the philosophy that any willingstudent with the proper support and services can be successful in mathematics. TheMPS Program has served more than 325 students in the previous three years.6
Attachment 2Math Performance Success ProgramStatistics for 2001 – 2002 Academic YearDecember 10, 2002QUARTERCOURSECOURSE AL #MPSNonMPSMPSNonMPSMPSNonMPSMPSNonMPSMPSNonMPSFall 2001Math 10180%52%11%23%9%25%91%75%82709Winter 2002Math 10588%52%9%22%3%27%97%73%101750Spring 2002Math 1093%72%6%11%1%17%99%83%68716Spring 2002Math 1192%71%0%14%8%15%92%85%24378Source: De Anza College MPS Program; FHDA Institutional ResearchDefinitions:Course Success %:Number of students receiving an A, B, C, CR, or P grade / total number ofstudents receiving a grade.Course Non-Success %:Number of students receiving a D, F, or NP grade/ total number of studentsreceiving a grade.Course Withdraw %:Number of students who withdrew after 3rd week census/total number ofstudents enrolled at end of 3rd week census.Retention %:Number of students receiving a successful or non-successful grade/totalnumber of students receiving a grade.MPS:All math sections offered by the MPS Program.Non-MPS:All math sections offered excluding math sections offered by the MPSProgram.7
Attachment 3 - MPS Grade Distributions for 2002-03De Anza Research: 03ELEMENTARY ALGEBRAOverall RatePassDid Not Pass WithdrewPercentPercentPercentMPS90%6%Other49%25%4% MA25% TH101.PassStudent Enrollment (HC)HCMATH101. 2002FMPSOtherHCAvg Grade Grade NoteQ Points2 MPS52###2.87 * Difference Statisitically Significant0739####1.430 Other2FPercentDid Not 6%24%52100%36549%18725%18725%739100%By GenderPassHCMATH101. MPS FemaleMaleOther FemaleMaleDid Not 4%9529%8727%325100%By EthnicityPassHCMATH101. MPSHCWithdrewDid Not tUnder Represented2589%27%14%28100%All %11022%11624%491100%Other Under RepresentedAll OtherBy LanguagePassHCMATH101. MPS EnglishDid Not PassPercent3590%English Learner3100%Not %14825%154English Learner2657%817%Not Reported4949%3131%Other %1226%46100%2121%101100%
MPS Grade Distributions for 2002-03De Anza Research: 03INTERMED ALGEBRAOverall RatePassDid Not Pass WithdrewPercentPercentPercentMPS89%4%Other58%21%7% MA21% TH105.PassStudent Enrollment (HC)HCMATH105. 2003WMPSOtherHCAvg Grade Grade NoteQ Points2 MPS55###2.73 * Difference Statisitically Significant0807####1.780 Other3WPercentDid Not 4%47%55100%47158%16821%16821%807100%By GenderPassHCMATH105. MPS FemaleMaleOther FemaleMaleDid Not 1860%6819%8022%366100%By EthnicityPassHCMATH105. MPSHCWithdrewDid Not tUnder Represented2690%13%27%29100%All %11720%12221%590100%Other Under RepresentedAll OtherBy LanguagePassHCMATH105. MPS EnglishDid Not PassPercentHCPercent5%HCPercent3786%English Learner3Not Reported936157%12921%138English Learner3767%815%Not Reported7359%3125%Other 0%9100%22%628100%1018%55100%2016%124100%
MPS Grade Distributions for 2002-03De Anza Research: 03ELEM STATS/PROBABILITYOverall RatePassDid Not Pass WithdrewPercentPercentPercentMPS89%6%Other69%11%5% MA21% TH010.PassStudent Enrollment (HC)HCMATH010. 2003SMPSOtherHCAvg Grade Grade NoteQ Points2 MPS64###2.81 * Difference Statisitically Significant0748####2.120 Other3SPercentDid Not 6%35%64100%51369%7911%15621%748100%By GenderPassHCMATH010. MPS FemaleMaleOther FemaleMaleDid Not 00%69%3910%8221%395100%23968%4011%7421%353100%Did Not PassPercentHCPercentWithdrewHCPercentUnder Represented3387%25%All Other2492%28%9964%1912%3741470%6010%119By LanguagePassHCMATH010. MPS EnglishEnglish LearnerNot ReportedOther EnglishEnglish LearnerNot ReportedPercent95%HCAll OtherHC18PassOther Under RepresentedTotal274By EthnicityMATH010. MPSHCWithdrewDid Not 17%147100%
SQL ProgramCREATE VIEW IRPASL.VW MPS CRSE GRADES(INST,INST CD,FISCAL YEAR,TERM,TERM CD,COURSE,SECTION 3,COURSE TITLE,SID,OFFICIAL GRADE,GPA,SUCCESS GROUP,SUCCESS IND,ETHNICITY,ETHNIC GROUP,GENDER,NATIVE LANGUAGE,DISTANCE LEARNING IND,MPS SECTION IND,RECORD COUNT)AS SELECT DISTINCTAL1.College,'De Anza College',AL1.FISCAL YEAR,AL1.TERM,CASEWHEN SUBSTRING (AL1.TERM,5,1) 'W' THEN SUBSTRING(AL1.TERM,1,4) '01'WHEN SUBSTRING (AL1.TERM,5,1) 'S' THEN SUBSTRING(AL1.TERM,1,4) '02'WHEN SUBSTRING (AL1.TERM,5,1) 'M' THEN SUBSTRING(AL1.TERM,1,4) '03'WHEN SUBSTRING (AL1.TERM,5,1) 'F' THEN SUBSTRING(AL1.TERM,1,4) '04'ELSE 'NA'END AS TERM CD,AL1.Course,AL1.SECTION 3,AL3.COURSE TITLE,AL1.Sid,AL1.Official Grade,case when al1.official grade 'P' then 3when AL1.official grade 'A' then 4when AL1.official grade 'B' then 3when AL1.official grade 'C' then 2when AL1.official grade 'D' then 1else 0 end AS GPA,case when al1.official grade 'P' then 'Pass'when AL1.official grade 'A' then 'Pass'when AL1.official grade 'B' then 'Pass'when AL1.official grade 'C' then 'Pass'when AL1.official grade 'W' then 'Withdrew'when AL1.official grade 'WR' then 'Withdrew'else 'Did Not Pass' end AS SUCCESS GROUP,casewhen al1.official grade 'P' then 'Y'when AL1.official grade 'A' then 'Y'when AL1.official grade 'B' then 'Y'when AL1.official grade 'C' then 'Y'when AL1.official grade 'W' then 'N'when AL1.official grade 'WR' then 'N'ELSE 'N' END AS SUCCESS IND,ETHNICITY,CASEWHEN AL1.ETHNICITY 'Black' then 'Under Represented'WHEN AL1.ETHNICITY 'Hispanic' then 'Under Represented'WHEN AL1.ETHNICITY 'Pacific Islander' then 'Under Represented'WHEN AL1.ETHNICITY 'Filipino' then 'Under Represented'WHEN AL1.ETHNICITY 'Native American' then 'Under Represented'ELSE 'All Other' END AS ETHNIC GROUP,8
CASE WHEN AL1.GENDER 'Unrecorded' THEN 'Female' ELSE AL1.GENDER END AS GENDER,case when AL2.Native Language Cd 'E' then 'English'when AL2.Native Language Cd 'N' then 'English Learner'else 'Not Reported' end AS NATIVE LANGUAGE,CASEWHEN SUBSTRING (AL1.SECTION 3,3,1 ) 'Z' THEN 'Distance Section'ELSE 'Traditional Section' END AS DISTANCE LEARNING IND,CASEWHEN AL1.TERM AL1.COURSE AL1.SECTION 3 '2002FMATH101.10' THEN 'MPS'WHEN AL1.TERM AL1.COURSE AL1.SECTION 3 '2002FMATH101.13' THEN 'MPS'WHEN AL1.TERM AL1.COURSE AL1.SECTION 3 '2003WMATH105.15' THEN 'MPS'WHEN AL1.TERM AL1.COURSE AL1.SECTION 3 '2003WMATH105.17' THEN 'MPS'WHEN AL1.TERM AL1.COURSE AL1.SECTION 3 '2003SMATH010.13' THEN 'MPS'WHEN AL1.TERM AL1.COURSE AL1.SECTION 3 '2003SMATH010.15' THEN 'MPS'ELSE 'Other' END AS INCLUDED MPS SECTION IND,'1'FROMIRPASL.LOOKUP COURSE TITLE AL3,IRPASL.ENROLLMENT AL1 LEFT OUTER JOINIRPASL.LA NATIVE LANGUAGE AL2 ON AL1.SID AL2.SIDWHEREAL1.College 'DA'AND (NOT AL1.Official Grade IS NULL)AND AL1.TERM AL1.COURSE IN ND AL1.COURSE AL3.COURSE/* */9
De Anza College Researcher SUBJECT: Math Performance Success Program (MPS), 2002-03 Summary The Math Performance Success Program (MPS) is in its third year at De Anza College. The program targets students who have had a particularly challenging time in previous math course attempts and prov