Transcription
Reducing Urban Heat Islands:Compendium of StrategiesUrban Heat Island Basics
AcknowledgementsReducing Urban Heat Islands: Compendium of Strategies describes thecauses and impacts of summertime urban heat islands and promotesstrategies for lowering temperatures in U.S. communities. This compendiumwas developed by the Climate Protection Partnership Division in the U.S.Environmental Protection Agency’s Office of Atmospheric Programs. EvaWong managed its overall development. Kathleen Hogan, Julie Rosenberg,and Andrea Denny provided editorial support. Numerous EPA staff inoffices throughout the Agency contributed content and provided reviews.Subject area experts from other organizations around the United States andCanada also committed their time to provide technical feedback.Under contracts 68-W-02-029 and EP-C-06-003, Perrin Quarles Associates,Inc. provided technical and administrative support for the entirecompendium, and Eastern Research Group, Inc. provided graphics andproduction services.PositvEnergy provided support in preparing the Trees and Vegetation, CoolRoofs, and UHI Activities chapters under contract PO #2W-0361-SATX.Experts who helped shape this chapter include:Hashem Akbari, Ryan Bell, Tony Brazel, David Cole, Maury Estes, GordonHeisler, David Hitchcock, Brenda Johnson, Megan Lewis, Greg McPherson,Tim Oke, Danny Parker, Alan Perrin, Joyce Rosenthal, David Sailor, JasonSamenow, Haider Taha, James Voogt, Darrell Winner, Kathy Wolf, and BarryZalph.
ContentsUrban Heat Island Basics. . . . . . . . . . . . . . . . . . . . . . . . . . . . . . . . . . . . . . . . . . 11. What Are Urban Heat Islands?. . . . . . . . . . . . . . . . . . . . . . . . . . . . . . . . . . . . . . . . . . . . . . . . . 11.1 Surface Urban Heat Islands. . . . . . . . . . . . . . . . . . . . . . . . . . . . . . . . . . . . . . . . . . . . . . . 21.2 Atmospheric Urban Heat Islands . . . . . . . . . . . . . . . . . . . . . . . . . . . . . . . . . . . . . . . . . 32. How Do Urban Heat Islands Form? . . . . . . . . . . . . . . . . . . . . . . . . . . . . . . . . . . . . . . . . . . . . 72.1 Reduced Vegetation in Urban Areas . . . . . . . . . . . . . . . . . . . . . . . . . . . . . . . . . . . . . . 72.2 Properties of Urban Materials . . . . . . . . . . . . . . . . . . . . . . . . . . . . . . . . . . . . . . . . . . . . 82.3 Urban Geometry. . . . . . . . . . . . . . . . . . . . . . . . . . . . . . . . . . . . . . . . . . . . . . . . . . . . . . . . 102.4 Anthropogenic Heat. . . . . . . . . . . . . . . . . . . . . . . . . . . . . . . . . . . . . . . . . . . . . . . . . . . . 122.5 Additional Factors . . . . . . . . . . . . . . . . . . . . . . . . . . . . . . . . . . . . . . . . . . . . . . . . . . . . . . 123. Why Do We Care about Urban Heat Islands? . . . . . . . . . . . . . . . . . . . . . . . . . . . . . . . . . . 133.1 Energy Consumption . . . . . . . . . . . . . . . . . . . . . . . . . . . . . . . . . . . . . . . . . . . . . . . . . . . 133.2 Air Quality and Greenhouse Gases. . . . . . . . . . . . . . . . . . . . . . . . . . . . . . . . . . . . . . . 143.3 Human Health and Comfort. . . . . . . . . . . . . . . . . . . . . . . . . . . . . . . . . . . . . . . . . . . . . 143.4 Water Quality. . . . . . . . . . . . . . . . . . . . . . . . . . . . . . . . . . . . . . . . . . . . . . . . . . . . . . . . . . . 154. Strategies to Reduce Urban Heat Islands . . . . . . . . . . . . . . . . . . . . . . . . . . . . . . . . . . . . . 165. Additional Resources . . . . . . . . . . . . . . . . . . . . . . . . . . . . . . . . . . . . . . . . . . . . . . . . . . . . . . . . 16Endnotes. . . . . . . . . . . . . . . . . . . . . . . . . . . . . . . . . . . . . . . . . . . . . . . . . . . . . . . . . . . . . . . . . . . . . . . 18
Urban Heat Island BasicsAs urban areas develop, changes occur in the landscape. Buildings, roads, and otherinfrastructure replace open land and vegetation. Surfaces that were once permeable and moist generally become impermeable and dry.* This development leads tothe formation of urban heat islands—the phenomenon whereby urban regions experiencewarmer temperatures than their rural surroundings.This chapter provides an overview of different types of urban heat islands, methods foridentifying them, and factors that contribute to their development. It introduces key concepts that are important to understanding and mitigating this phenomenon, as well as additional sources of information. It discusses: General features of urban heat islands Surface versus atmospheric heat islands Causes of urban heat island formation Urban heat island impacts on energy consumption, environmental quality, and human health Resources for further information.1. What Are Urban Heat Islands?Many urban and suburban areas experience elevated temperatures compared to their outlying rural surroundings; this difference in temperature is what constitutes an urban heatisland. The annual mean air temperature of a city with one million or more people canbe 1.8 to 5.4 F (1 to 3 C) warmer than its surroundings,1 and on a clear, calm night, thistemperature difference can be as much as 22 F (12 C).2 Even smaller cities and towns willproduce heat islands, though the effect often decreases as city size decreases.3This chapter focuses on surface and atmospheric urban heat islands. These two heat islandtypes differ in the ways they are formed, the techniques used to identify and measurethem, their impacts, and to some degree, the methods available to mitigate them. Table 1summarizes the basic characteristics of each type of heat island. These features are described in more detail in the following sections of this chapter.* This change in landscape may differ in regions such as deserts, where moisture may increase in urban areas if development introduces grass lawns andother irrigated vegetation.URBAN Heat Island Basics – DRAFT1
Table 1: Basic Characteristics of Surface and Atmospheric Urban Heat Islands (UHIs)4FeatureSurface UHIAtmospheric UHITemporal Development Present at all times of the day andnight Most intense during the day and inthe summer May be small or non-existent duringthe day Most intense at night or predawn andin the winterPeak Intensity(Most intense UHIconditions) More spatial and temporal variation:n Day: 18 to 27 F (10 to 15 C)n Night: 9 to 18 F (5 to 10 C) Less variation:n Day: -1.8 to 5.4 F (-1 to 3 C)n Night: 12.6 to 21.6 F (7 to 12 C)Typical IdentificationMethod Indirect measurement:n Remote sensing Direct measurement:n Fixed weather stationsn Mobile traversesTypical Depiction Thermal image Isotherm map Temperature graph1.1 Surface Urban Heat IslandsOn a hot, sunny summer day, the sun canheat dry, exposed urban surfaces, like roofsand pavement, to temperatures 50 to 90 F(27 to 50 C) hotter than the air,5 whileshaded or moist surfaces—often in morerural surroundings—remain close to airtemperatures. Surface urban heat islandsare typically present day and night, buttend to be strongest during the day whenthe sun is shining.On average, the difference in daytime surface temperatures between developed andrural areas is 18 to 27 F (10 to 15 C); thedifference in nighttime surface temperatures is typically smaller, at 9 to 18 F (5 to10 C).6The magnitude of surface urban heat islands varies with seasons, due to changesin the sun’s intensity as well as groundcover and weather. As a result of suchvariation, surface urban heat islands aretypically largest in the summer.72How Weather InfluencesUrban Heat IslandsSummertime urban heat islands aremost intense when the sky is clearand winds are calm. Heavy cloudcover blocks solar radiation, reducingdaytime warming in cities. Strongwinds increase atmospheric mixing,lowering the urban-rural temperaturedifference. This document, ReducingUrban Heat Islands: Compendiumof Strategies, focuses on mitigatingsummertime heat islands throughstrategies that have maximum impactunder clear, calm conditions.To identify urban heat islands, scientistsuse direct and indirect methods, numericalmodeling, and estimates based on empirical models. Researchers often use remotesensing, an indirect measurement technique, to estimate surface temperatures.They use the data collected to producethermal images, such as that shown inFigure 1.REDUCING URBAN HEAT ISLANDS – DRAFT
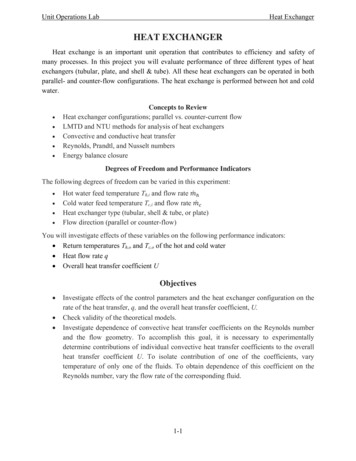
NASA/Marshall Space Flight CenterFigure 1: Thermal Image Depicting aSurface Urban Heat IslandThis image, taken from an aircraft, depicts amidday surface urban heat island in Salt LakeCity, Utah, on July 13, 1998. White areas arearound 160 F (70 C), while dark blue areas arenear 85 F (30 C). Note the warmer urban surfacetemperatures (left side of image) and coolersurfaces in the neighboring foothills (on the right).Canopy layer urban heat islands are themost commonly observed of the twotypes and are often the ones referred to indiscussions of urban heat islands. For thisreason, this chapter and compendium usethe more general term atmospheric urbanheat islands to refer to canopy layer urbanheat islands.Atmospheric urban heat islands are oftenweak during the late morning and throughout the day and become more pronouncedafter sunset due to the slow release of heatfrom urban infrastructure. The timing ofthis peak, however, depends on the properties of urban and rural surfaces, the season,and prevailing weather conditions.1.2 Atmospheric Urban HeatIslandsWarmer air in urban areas compared tocooler air in nearby rural surroundingsdefines atmospheric urban heat islands.Experts often divide these heat islands intotwo different types: Canopy layer urban heat islands existin the layer of air where people live,from the ground to below the tops oftrees and roofs. Boundary layer urban heat islandsstart from the rooftop and treetoplevel and extend up to the point whereurban landscapes no longer influencethe atmosphere. This region typicallyextends no more than one mile (1.5km) from the surface.8URBAN Heat Island Basics – DRAFT3
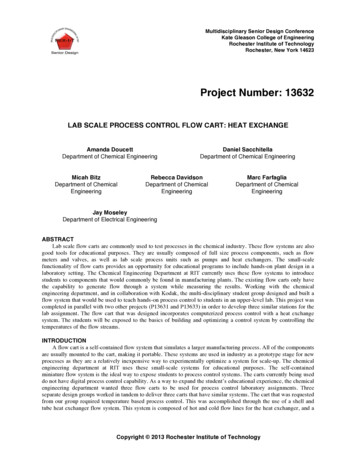
Surface and Air Temperatures: How Are They Related?Surface temperatures have an indirect, but significant, influence on air temperatures,especially in the canopy layer, which is closest to the surface. For example, parksand vegetated areas, which typically have cooler surface temperatures, contribute tocooler air temperatures. Dense, built-up areas, on the other hand, typically lead towarmer air temperatures. Because air mixes within the atmosphere, though, the relationship between surface and air temperatures is not constant, and air temperaturestypically vary less than surface temperatures across an area (see Figure 2).Figure 2: Variations of Surface and Atmospheric TemperaturesTemperatureSurface Temperature (Day)Air Temperature (Day)Surface Temperature (Night)Air Temperature (Night)DAYRural SuburbanPond WarehouseUrbanor Industrial ResidentialDowntownPark Suburban RuralUrbanResidentialModified from Voogt, 2000NIGHTSurface and atmospheric temperatures vary over different land use areas. Surfacetemperatures vary more than air temperatures during the day, but they both are fairly similarat night. The dip and spike in surface temperatures over the pond show how water maintainsa fairly constant temperature day and night, due to its high heat capacity.* Note: The temperatures displayed above do not represent absolute temperature values orany one particular measured heat island. Temperatures will fluctuate based on factors such asseasons, weather conditions, sun intensity, and ground cover.4REDUCING URBAN HEAT ISLANDS – DRAFT
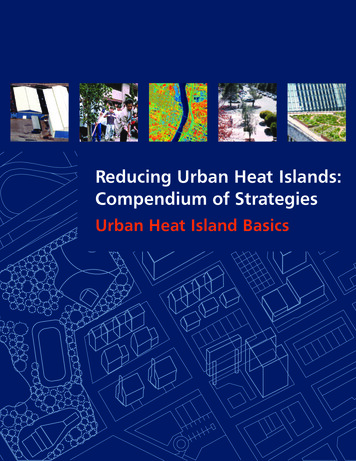
Atmospheric heat islands vary much less inintensity than surface heat islands. On anannual mean basis, air temperatures in largecities might be 1.8 to 5.4 F (1 to 3 C) warmer than those of their rural surroundings.9Researchers typically measure air temperatures through a dense network ofsampling points from fixed stations ormobile traverses, which are both directmeasurement methods. Figure 3 illustratesa conceptual isotherm map that depicts anatmospheric urban heat island. The centerof the figure, which is the hottest area, isthe urban core. A simple graph of temperature differences, as shown in Figure 4, isanother way to show the results.Figure 3: Isotherm Map Depicting an AtmosphericNighttime Urban Heat Island 2 1 3Wind 4 3 3 6 1 2 5 2 3 1 1Modified from Voogt, 2000 4 3 Park 2 5 2This conceptual map with overlaid isotherms (lines of equal air temperature)exhibits a fully developed nighttime atmospheric urban heat island. Thedotted red line indicates a traverse along which measurements are taken.Figure 4: Conceptual Drawing of the Diurnal Evolution of the Urban HeatIsland during Calm and Clear ConditionsSunriseSunsetUrbanRural2 C(b)12TUR CLUHI1824TimeURBAN Heat Island Basics – DRAFT0612Modified from Oke, 1982, and Runnalls and Oke, 2000Heat Island IntensityAir Temperature(a)Atmospheric urban heat islandsprimarily result from different coolingrates between urban areas and theirsurrounding rural or non-urbansurroundings (section (a) of Figure5). The differential cooling rates aremost pronounced on clear and calmnights and days when rural areas cancool more quickly than urban areas.The heat island intensity (section(b)) typically grows from mid- to lateafternoon to a maximum a few hoursafter sunset. In some cases, a heatisland might not reach peak intensityuntil after sunrise.5
Urban Heat Islands, Climate Change, and Global WarmingUrban heat islands refer to the elevated temperatures in developed areas compared to more ruralsurroundings. Urban heat islands are caused bydevelopment and the changes in radiative andthermal properties of urban infrastructure as wellas the impacts buildings can have on the localmicro-climate—for example tall buildings canslow the rate at which cities cool off at night.Heat islands are influenced by a city’s geographiclocation and by local weather patterns, and theirintensity changes on a daily and seasonal basis.The warming that results from urban heat islandsover small areas such as cities is an exampleof local climate change. Local climate changesresulting from urban heat islands fundamentallydiffer from global climate changes in that theireffects are limited to the local scale and decreasewith distance from their source. Global climatechanges, such as those caused by increases inthe sun’s intensity or greenhouse gas concentrations, are not locally or regionally confined.Climate change, broadly speaking, refers toany significant change in measures of climate(such as temperature, precipitation, or wind)lasting for an extended period (decades orlonger). Climate change may result from: Natural factors, such as changes in thesun’s intensity or slow changes in theEarth’s orbit around the sun Natural processes within the climate system (e.g. changes in ocean circulation) Human activities that change the atmosphere’s composition (e.g. burning fossilfuels) and the land surface (e.g. deforestation, reforestation, or urbanization).The term climate change is often used interchangeably with the term global warming, butaccording to the National Academy of Sciences, “the phrase ‘climate change’ is growing6in preferred use to ‘global warming’ becauseit helps convey that there are [other] changesin addition to rising temperatures.”Global warming is an average increase inthe temperature of the atmosphere near theEarth’s surface and in the lowest layer of theatmosphere, which can contribute to changesin global climate patterns. Global warmingcan occur from a variety of causes, both natural and human induced. In common usage,“global warming” often refers to the warmingthat can occur as a result of increased emissions of greenhouse gases from human activities. Global warming can be considered partof global climate change along with changesin precipitation, sea level, etc.The impacts from urban heat islands andglobal climate change (or global warming) are often similar. For example, somecommunities may experience longer growing seasons due to either or both phenomena. Urban heat islands and global climatechange can both also increase energy demand, particularly summertime air conditioning demand, and associated air pollution andgreenhouse gas emissions, depending on theelectric system power fuel mix.Strategies to reduce urban heat islands—thefocus of this document, Reducing UrbanHeat Islands: Compendium of Strategies—produce multiple benefits including lowering surface and air temperatures, energydemand, air pollution and greenhouse gasemissions. Thus, advancing measures tomitigate urban heat islands also helps to address global climate change.For more information on global warming seeEPA’s Climate Change website, www.epa.gov/climatechange .REDUCING URBAN HEAT ISLANDS – DRAFT
2. How Do Urban Heat IslandsForm?While many factors contribute to urbanheat island formation (see Table 2), thischapter focuses on vegetative cover andsurface properties because communitiescan directly address these factors withavailable technologies. See the “Trees andVegetation,” “Green Roofs,” “Cool Roofs,”and “Cool Pavement” chapters for detailedinformation on these strategies.2.1 Reduced Vegetation in Urban Areasreduce air temperatures through a processcalled evapotranspiration, in which plantsrelease water to the surrounding air, dissipating ambient heat. In contrast, urbanareas are characterized by dry, impervioussurfaces, such as conventional roofs, sidewalks, roads, and parking lots. As citiesdevelop, more vegetation is lost, and moresurfaces are paved or covered with buildings. The change in ground cover resultsin less shade and moisture to keep urbanareas cool. Built up areas evaporate lesswater (see Figure 5), which contributes toelevated surface and air temperatures.Figure 5: Impervious Surfaces and Reduced Evapotranspiration40% evapotranspiration30% evapotranspiration10% runoff55% runoff10% shallowinfiltration5% deepinfiltration25% shallowinfiltration25% deepinfiltrationModified from the Federal Interagency Stream Restoration Working Group (FISRWG)In rural areas, vegetation and open landtypically dominate the landscape. Treesand vegetation provide shade, which helpslower surface temperatures. They also helpHighly developed urban areas (right), which are characterized by 75%-100% impervious surfaces, have less surfacemoisture available for evapotranspiration than natural ground cover, which has less than 10% impervious cover (left).This characteristic contributes to higher surface and air temperatures in urban areas.URBAN Heat Island Basics – DRAFT7
2.2 Properties of Urban MaterialsProperties of urban materials, in particularsolar reflectance, thermal emissivity, andheat capacity, also influence urban heatisland development, as they determine howthe sun’s energy is reflected, emitted, andabsorbed.Figure 6 shows the typical solar energy thatreaches the Earth’s surface on a clear summer day. Solar energy is composed of ultraviolet (UV) rays, visible light, and infraredenergy, each reaching the Earth in differentpercentages: five percent of solar energy isin the UV spectrum, including the type ofrays responsible for sunburn; 43 percent ofsolar energy is visible light, in colors ranging from violet to red; and the remaining52 percent of solar energy is infrared, feltas heat. Energy in all of these wavelengthscontributes to urban heat island formation.Solar reflectance, or albedo, is the percentage of solar energy reflected by a surface.Much of the sun’s energy is found in thevisible wavelengths (see Figure 6); thus,solar reflectance is correlated with a material’s color. Darker surfaces tend to havelower solar reflectance values than lightersurfaces. Researchers are studying anddeveloping cool colored materials, though,that use specially engineered pigments thatreflect well in the infrared wavelengths.These products can be dark in color buthave a solar reflectance close to that of awhite or light-colored material. (See the“Cool Roofs” chapter for further discussionof cool colored roof products.)Figure 6: Solar Energy versus Wavelength Reaching Earth’s Surface1.00Normalized Solar 00.500.400.300.200.100.000200 400 600 800 1000 1200 1400 1600 1800 2000 2200 2400 2600WavelengthSolar energy intensity varies over wavelengthsfrom about(nanometers)250 to 2500 nanometers.8REDUCING URBAN HEAT ISLANDS – DRAFT
Urban areas typically have surface materials, such as roofing and paving, which havea lower albedo than those in rural settings.As a result, built up communities generally reflect less and absorb more of thesun’s energy. This absorbed heat increasessurface temperatures and contributes tothe formation of surface and atmosphericurban heat islands.Although solar reflectance is the maindeterminant of a material’s surface temperature, thermal emittance, or emissivity,also plays a role. Thermal emittance is ameasure of a surface’s ability to shed heat,or emit long-wave (infrared) radiation. Allthings equal, surfaces with high emittancevalues will stay cooler, because they willrelease heat more readily. Most construction materials, with the exception of metal,have high thermal emittance values. Thus,this property is mainly of interest to thoseinstalling cool roofs, which can be metallic.See the “Cool Roofs” chapter of the compendium for more information.Radiative and ThermalProperties—Cool Roofsand Cool PavementsAlbedo and emissivity are considered“radiative properties.” Heat capacity,on the other hand, is one of several“thermal properties” a material canpossess. For thin materials like roofing, which is typically placed overinsulation, reflectance and emittanceare the main properties to consider,as the heat capacity of a well insulated roof is low. For pavements,which are thicker than roofingproducts and are placed on top ofthe ground, which has its own set ofthermal characteristics, designers andresearchers need to consider a morecomplex set of factors that includeradiative and thermal properties—such as heat capacity, thermal conductivity, and density.Another important property that influencesheat island development is a material’s heatcapacity, which refers to its ability to storeheat. Many building materials, such as steeland stone, have higher heat capacities thanrural materials, such as dry soil and sand.As a result, cities are typically more effective at storing the sun’s energy as heatwithin their infrastructure. Downtown metropolitan areas can absorb and store twicethe amount of heat compared to their ruralsurroundings during the daytime.10URBAN Heat Island Basics – DRAFT9
2.3 Urban GeometryAn additional factor that influences urbanheat island development, particularly atnight, is urban geometry, which refers tothe dimensions and spacing of buildingswithin a city. Urban geometry influenceswind flow, energy absorption, and a givensurface’s ability to emit long-wave radiationback to space. In developed areas, surfacesand structures are often at least partiallyobstructed by objects, such as neighboring buildings, and become large thermalmasses that cannot release their heat veryreadily because of these obstructions. Especially at night, the air above urban centersis typically warmer than air over rural areas. Nighttime atmospheric heat islands canhave serious health implications for urbanresidents during heat waves (see textboxin Section 3.3, “Factors in Heat-Related Illnesses and Death.”)Researchers often focus on an aspect ofurban geometry called urban canyons,which can be illustrated by a relatively narrow street lined by tall buildings. Duringthe day, urban canyons can have competing effects. On the one hand, tall buildingscan create shade, reducing surface and airtemperatures. On the other, when sunlightreaches surfaces in the canyon, the sun’senergy is reflected and absorbed by building walls, which further lowers the city’soverall albedo—the net reflectance fromsurface albedo plus urban geometry—and can increase temperatures.11 At night,urban canyons generally impede cooling,as buildings and structures can obstructthe heat that is being released from urbaninfrastructure.Table 2: Factors that Create Urban Heat IslandsFactors Communities are Focusing On Reduced vegetation in urban regions: Reduces the natural cooling effect from shade and evapotranspiration. Properties of urban materials: Contribute to absorption of solar energy, causing surfaces, and the air abovethem, to be warmer in urban areas than those in rural surroundings.Future Factors to Consider Urban geometry: The height and spacing of buildings affects the amount of radiation received and emitted byurban infrastructure. Anthropogenic heat emissions: Contribute additional warmth to the air.*Additional Factors Weather: Certain conditions, such as clear skies and calm winds, can foster urban heat island formation. Geographic location: Proximity to large water bodies and mountainous terrain can influence local wind patternsand urban heat island formation.* Although communities currently can lower anthropogenic heat emissions through energy efficiency technologiesin the building and vehicle sectors, this compendium focuses on modifying vegetative cover and surface propertiesof urban materials, as they have long been regarded as urban heat island reduction strategies. An emerging bodyof literature on the role waste heat plays in urban heat island formation, though, may lead communities to focus onanthropogenic heat in the near future.10REDUCING URBAN HEAT ISLANDS – DRAFT
The Urban Surface Energy BudgetAn energy budget provides an equation that quantifies the balance of incomingand outgoing energy flows, or fluxes (see Figure 7). The surface energy budgets ofurban areas and their more rural surroundings will differ because of differences inland cover, surface characteristics, and level of human activity. Such differences canaffect the generation and transfer of heat, which can lead to different surface and airtemperatures in urban versus rural areas. Various elements of the budget include: Short-wave radiation is ultraviolet, visible light, and near-infrared radiation fromthe sun that reaches the Earth (see Figure 6). This energy is a key driver of urbanheat islands. Urban surfaces, compared to vegetation and other natural groundcover, reflect less radiation back to the atmosphere. They instead absorb and storemore of it, which raises the area’s temperature. Thermal storage increases in cities in part due to the lower solar reflectance ofurban surfaces, but it is also influenced by the thermal properties of constructionmaterials and urban geometry. Urban geometry can cause some short-wave radiation—particularly within an urban canyon—to be reflected on nearby surfaces, suchas building walls, where it is absorbed rather than escaping into the atmosphere.Figure 7: Urban Surface Energy BudgetShort-wave radiationSensible heatLatent heatThermal storageAdapted from David SailorLong-wave radiationAnthropogenic heatContinued on next pageURBAN Heat Island Basics – DRAFT11
The Urban Surface Energy Budget (continued) Similarly, urban geometry can impede the release of long-wave, or infrared,radiation into the atmosphere. When buildings or other objects absorb incoming short-wave radiation, they can re-radiate that energy as long-wave energy, orheat. However, at night, due to the dense infrastructure in some developed areasthat have low sky view factors (see section 2.3), urban areas cannot easily releaselong-wave radiation to the cooler, open sky, and this trapped heat contributes tothe urban heat island. Evapotranspiration describes the transfer of latent heat, what we feel as humidity, from the Earth’s surface to the air via evaporating water. Urban areas tend tohave less evapotranspiration relative to natural landscapes, because cities retainlittle moisture. This reduced moisture in built up areas leads to dry, imperviousurban infrastructure reaching very high surface temperatures, which contribute tohigher air temperatures.* Convection describes the transfer of sensible heat, what we feel as temperature,between the surface and air when there is a difference in temperature betweenthem. High urban surface temperatures warm the air above, which then circulatesupwards via convection. Anthropogenic heat refers to the heat generated by cars, air conditioners, industrial facilities, and a variety of other manmade sources, which contributes to theurban energy budget, particularly in the winter.* This change in landscape may differ in regions such as deserts, where moisture may increase inurban areas if development introduces grass lawns and other irrigated vegetation.The effects of urban geometry on urban heatislands are often described through the “skyview factor” (SVF), which is the visible areaof the sky from a given point on a surface.For example, an open parking lot or field thathas few obstructions would have a large SVFvalue (closer to 1). Conversely, an urban canyon in a downtown area that is surroundedby closely spaced, tall buildings, would have alow SVF value (closer to zero), as there wouldonly be a small visible area of the sky.2.4 Anthropogenic HeatAnthropogenic heat contributes to atmospheric heat islands and refers to heatproduced by human activities. It can comefrom a variety of sources and is estimated12by totaling all the energy used for heatingand cooling, running appliances, transportation, and industrial processes. Anthropogenic heat varies by urban activity andinfrastructure, with more energy-intensivebuildings and transportation producingmore heat.12 Anthropogenic heat typicallyis not a concern in rural areas and duringthe summer. In the winter, though, andyear round in dense, urban areas, anthropogenic heat can significantly contribute toheat island formation.2.5 Additional FactorsWeather and location strongly influenceurban heat island formation. While communities have little control over these factors,REDUCING URBAN HEAT ISLANDS –
On a hot, sunny summer day, the sun can heat dry, exposed urban surfaces, like roofs and pavement, to temperatures 50 to 90 F (27 to 50 C) hotter than the air,5 while shaded or moist surfaces—often in more rural surroundings—remain close to air temperatures. Surface ur