Transcription
POWER ENGINEERS, INC.TUCO to Yoakum 345-kV Transmission Line Repair approximately 1.8 miles of roadway on US 385 from FM 300 to 1.86 miles south ofFM 300. Seal coat approximately 11.9 miles of roadway on US 385 from Grubstake Road to the TerryCounty Line. Repair approximately 13.5 miles of roadway on US 385 from FM 300 to the Terry CountyLine. Repair approximately 1.3 miles of roadway on US 385 from Houston Street to FM 300. Repair approximately 0.46 mile of roadway on SH 114 to Houston Street. Seal coat approximately 7.8 miles of roadway along US 84 from the Lamb County Line toLubbock County Line (TxDOT 2016b).In Lubbock County, including the following 15 located within the study area: Seal coat approximately 5.4 miles of roadway along FM 1294 from the Hockley County Lineto Avenue N in Shallowater, Texas. Seal coat approximately 10.6 miles of roadway on FM 1729 from FM 179 to IH 27. Repair approximately 12.7 miles of roadway on FM 179 from 4 h Street to FM 41. Install pedestrian signals along FM 179 from Donald Preston Street to Loop 193. Widen non-freeway for approximately 4.1 miles on FM 179 from 800 feet north of SH 114 toDonald Preston Street. Repair approximately 1.2 miles of roadway on FM 597 from the Lubbock County Line to1.29 miles east of the Lubbock County Line. Seal coat approximately 8.3 miles of roadway on FM 597 from the Hockley County Line tonorth FM 2528. Repair approximately 10.1 miles of roadway on FM 597 from IH 27 to FM 400. Seal coat approximately 3.2 miles of roadway on SH 114 from the Hockley County Line toResearch Boulevard. Convert approximately 2.4 miles of non-freeway to freeway on US 62 from 1750 feet southof 82 d Street to Milwaukee Avenue. Add a new interchange for approximately 1.2 miles on US 62 from 2,000 feet west of LP 193in Wolfforth, TX to 1,000 feet west of FM 179. Repair approximately 2.3 miles of roadway on US 84 from Loop 388 in Shallowater, TX to0.64 mile northwest of FM 2528. Repair approximately 2.5 miles of existing roadway on US 84 from 0.82 mile southeast ofFM 2528 to northwest Loop 289. Construction of a new interchange for approximately 1.4 miles on US 84 from 0.64 milenorthwest of FM 2528 to 0.82 miles southeast of FM 2528.AUS 146-128 (PER-02) XCEL (10/02/2015) 135321 LD450
POWER ENGINEERS, INC.TUCO to Yoakum 345-kV Transmission Line Repair approximately 8.1 miles of existing roadway on US 84 from Hockley County line tosouth loop 388 in Shallowater, TX (TxDOT 2016b).In Lynn County, five projects are funded for development within the study area including: Seal coat approximately 5.2 miles of roadway on FM 1730 from the Lubbock County Line toFM 211. Repair approximately 16.4 miles of roadway on FM 2053 from the Lubbock County Line toUS 87. Seal coat approximately 9.5 miles of roadway on FM 400 from US 87 to FM 1054. Repair approximately 16.8 miles of roadway on US 87 from Lubbock County Line to SouthTahoka City Limits. Repair approximately 1.2 miles of roadway on US 87 from South Tahoka City Limits to thesouth.In Terry County, six roadway projects are funded for development within the study area including: Repair approximately 13.9 miles of roadway on US 385 from the Hockley County Line to theRailroad Crossing in Brownfield. Install rumble strips along roadway for approximately 11.7 miles on US 385 from theHockley County Line to SH 137. Repair approximately 1.3 miles of roadway on US 62 from 0.3 mile north of US 385 to theintersection of US 82. Repair 1.7 miles of roadway on US 62 from the intersection of US 82 to 0.1 mile south of theBrownfield city limit. Repair approximately 10.6 miles of roadway on US 62 from FM 213 in Wellman to thebeginning of the four-lane divide south of Brownfield. Repair approximately 17.5 miles of roadway on US 82 from the Yoakum County Line toBrownfield city limits (TxDOT 2016b).In Yoakum County, two roadway repair projects are funded for development: Repair roadway US 380 between the Texas New Mexico State Line and the West Plains Citylimits (approximately 14 miles in length). Repair roadway US 82 between the Plains City limits and the Terry County line(approximately 13 miles in length) (TxDOT 2016b).Aviation FeaturesAviation facilities reviewed include public and private airports, airstrips, airfields and heliports.Review of the Dallas-Fort Worth Sectional Aeronautical Chart and the FAA database were used toidentify FAA registered facilities.AUS 146-128 (PER-02) XCEL ( 10/02/2015) 135321 LDPAGE 38451
POWER ENGINEERS, INC.TUCO to Yoakum 345-kV Transmission LineOne FAA registered public airport was identified within the study area in Hale County. TheAbernathy Municipal Airport is located approximately four miles east of the City of Abernathy andeast of 1-27 and US Hwy 87. The Abernathy Municipal Airport features a 4,000-foot long asphaltrunway (FAA 2016).One FAA registered public airport was identified within the study area in Hockley County. TheLevelland Municipal Airport is located approximately two miles south of the City of Levelland andeast of US 385. The Levelland Municipal Airport features two runways, a 6,110-foot long asphaltrunway and a 2,072-foot long asphalt runway (FAA 2016).One FAA registered public airport was identified within the study area in Terry County. The TerryCounty Airport is located approximately four miles east of Brownfield and south of 1-380. The TerryCounty Airport features two asphalt runways, a 5,218-foot long runway and a 2,765-foot long runway(FAA 2016).No FAA registered public airports were identified within the study area in Lynn or Lubbock counties.The Lubbock Preston Smith International Airport is located five miles north of the City of Lubbock,in Lubbock County just outside of the study area. The northern most end of runway 17R/35L islocated approximately 3,395 feet outside of the study area boundary. The Lubbock Preston SmithInternational Airport consists of three runways: an 11,500-foot long concrete/grooved runway; an8,003 foot concrete/grooved runway; and a 2,891-foot long asphalt runway (FAA 2016).No FAA registered public airports were identified within the study area in Yoakum County.However, the Yoakum County Airport is located approximately seven miles west of study area. TheYoakum County Airport features two runways: a 5,001-foot long asphalt runway; and a 3,924-footlong asphalt runway. The Denver City Airport is located over 10 miles southwest of the study area.The Denver City Airport features two runways: a 5,780-foot runway; and a 3,960-foot runway (FAA2016).The Brownfield Regional Medical Center Heliport was identified within the study area in TerryCounty approximately one mile north of Brownfield and east of 1-82. This facility is private use andfeatures a concrete 30 x 30 foot helipad (FAA 2016).In addition, review of USGS topographic maps, aerial photograph interpretation, and fieldreconnaissance surveys were used in an attempt to identify private airstrips within the study area. Oneprivate use airport was identified within the study area in Hockley County. The McNabb FarmAirport is located approximately four miles east of Ropesville. This private use airport consists of twoturf runways: one 2,750-foot long; and one 1,500-foot long. There are two private use airports withinthe study area in Lubbock County. The Biggin Hill Airport is located approximately five milesnorthwest of the City of Shallowater and east of SH 385. The Biggin Hill Airport features a turf3,000-foot long runway. The Reese Airpark is located approximately 10 miles west of the City ofLubbock and north of SH 114. This airport features three asphalt runways: two 10,500-foot longrunways; and a 6,500-foot long runway (FAA 2016).Utility FeaturesUtility features inventoried include existing electrical transmission lines, pipelines, water wells, andwater tanks. Data sources used to identify existing electrical transmission and distribution linesinclude utility company and Xcel regional system maps, aerial imagery, USGS topographic maps,AUS 146-128 (PER-02) XCEL (10/02/2015) 135321 LDPAGE 39452
POWER ENGINEERS, INC.TUCO to Yoakum 345-kV Transmission Lineadditional available planning documents, and field reconnaissance surveys. Transmission linesidentified include: 10 230-kV transmission lines; 22 115-kV transmission lines; 16 69-kVtransmission lines; and four other transmission lines. The data for these "other" lines indicates that theline names are unknown and the voltage is indicated as NULL. Distribution lines are prevalentthroughout the developed portions of the study area; however, these features were not mapped.In addition, numerous water wells are located throughout the study area (High Plains Water District[HPWD] 2015; South Plains Underground Water Conservation District [SPUWD] 2015; Texas WaterDevelopment Board [TWDB] 2016a).2.2.2.6 Communication TowersReview of the Federal Communications Commission (FCC) database indicated that there are two AMradio transmitters within the study area boundary: 1) an AM radio tower is located the City ofBrownfield south of 1-80 and west of 1-62; and 2) an AM tower is located in Levelland north of SH215 and west of 1-385 (FCC 2015).A review of the FCC databases also indicated that there are numerous Antenna Structure Registration(ASR) facilities, including FM radio transmitters/microwave towers/cell towers/other electronicinstallations, within the study area boundary (FCC 2015).2.2.3SocioeconomicsThis section presents a summary of economic and demographic characteristics for each study areacounty and describes the socioeconomic environment of the study area. Literature sources reviewedinclude publications of the United States Bureau of the Census (USBOC) and the TWDB.2.2.3.1Population TrendsHale County experienced a population decline of one percent between 2000 and 2010 (USBOC 2000and 2010). According to TWDB projections, Hale County is projected to experience an overallpopulation increase over the next 40 years. Between 2010 and 2020, 2020 and 2030, 2030 and 2040,and 2040 and 2050, population changes in Hale County are projected to be at six percent, 4.3 percent,1.7 percent, and -0.8 percent, respectively (TWDB 2016b).Hockley County experienced a population growth of one percent between 2000 and 2010 (USBOC2000 and 2010). According to TWDB projections, Hockley County is projected to experience anoverall population increase over the next 40 years. Between 2010 and 2020, 2020 and 2030, 2030 and2040, and 2040 and 2050, population changes in Hockley County are projected to be at 10 percent,six percent, four percent, and one percent, respectively (TWDB 2016b).Lubbock County experienced a population growth of 15 percent between 2000 and 2010 (USBOC2000 and 2010). According to TWDB projections, Lubbock County is projected to experience anoverall population increase over the next 40 years. Between 2010 and 2020, 2020 and 2030, 2030 and2040, and 2040 and 2050, population changes in Lubbock County are projected to be at 11 percent,11 percent, 10 percent, and 10 percent, respectively (TWDB 2016b).Lynn County experienced a population decline of 10 percent between 2000 and 2010 (USBOC 2000and 2010). According to TWDB projections, Lynn County is projected to experience an overallpopulation increase over the next 40 years. Between 2010 and 2020, 2020 and 2030, 2030 and 2040,AUS 146-128 (PER-02) XCEL (10/02/2015) 135321 LDPAGE40453
POWER ENGINEERS, INC.TUCO to Yoakum 345-kV Transmission Lineand 2040 and 2050, population changes in Lynn County are projected to be at six percent, fivepercent, 0.3 percent, and -0.5 percent, respectively (TWDB 2016b).Terry County experienced a population decline of one percent between 2000 and 2010 (USBOC 2000and 2010). According to TWDB projections, Terry County is projected to experience an overallpopulation increase over the next 40 years. Between 2010 and 2020, 2020 and 2030, 2030 and 2040,and 2040 and 2050, population changes in Terry County are projected to be at seven percent, sixpercent, six percent, and five percent, respectively (TWDB 2016b).Yoakum County experienced a population growth of eight percent between 2000 and 2010 (USBOC2000 and 2010). According to TWDB projections, Yoakum County is projected to experience anoverall population increase over the next 40 years. Between 2010 and 2020, 2020 and 2030, and 2030and 2040, and 2040 and 2050, population changes in Yoakum County are projected to be at 13percent, 13 percent, 10 percent, and 10 percent, respectively (TWDB 2016b).By comparison, the population at the state level grew by 21 percent between 2000 and 2010 (USBOC2000 and 2010). Texas is expected to experience population increases of 17 percent, 14 percent, 12percent, and 11 percent, over the next four decades, respectively (T)VDB 2016b). Table 2-4 presentspast population trends and projections for Hale, Hockley, Lubbock, Lynn, Terry and YoakumCounties and for the State of Texas.TABLE 2-4 POPULATION TRENDS" PASTIS TAT E /COUNTY200020102020Texas20,851,820 25,145,561 111,128Sources: USBOC 2000 and 2010; TWDB 2016b2.2.3.2EmploymentThe civilian labor force (CLF) in Hale County increased by one percent (167 people) between 2000and 2013. The CLF in Hockley County increased by nine percent (916 people) between 2000 and2013. The CLF in Lubbock County increased by 21 percent (25,164 people) between 2000 and 2013.The CLF in Lynn County increased by five percent (132 people) between 2000 and 2013. The CLF inTerry County increased by three percent (128 people) between 2000 and 2013. The CLF in YoakumCounty increased by 20 percent (640 people) between 2000 and 2013. By comparison, the CLF at thestate level grew by 28 percent (2,758,614 people) from 2000 to 2013 (USBOC 2000 and 2013). Table2-5 presents the CLF for the study area counties and the state of Texas for the years 2000 and 2013.Between 2000 and 2013, Hale County experienced an increase in the unemployment rate from 6.7percent to 7.4 percent. Hockley County experienced a slight decrease in the unemployment rate fromAUS 146-128 (PER-02) XCEL (10/02/2015) 135321 LD454
POWER ENGINEERS, INC.TUCO to Yoakum 345-kV Transmission Line6.9 percent to 6.8 percent. Lubbock County experienced an increase in the unemployment rate from5.8 percent to 7.0 percent. Lynn County experienced no change in the unemployment rate from 6.1percent to 6.1 percent. Terry County experienced an increase in the unemployment rate from 5.7percent to 7.1 percent. Yoakum County experienced a decrease in the unemployment rate from 9.2percent to 8.1 percent. By comparison, the state of Texas experienced an increase in theunemployment rate from 2000 to 2013 from 6.1 percent to 8.1 percent (USBOC 2000 and 2013).Table 2-5 presents employment and unemployment data for the study area counties and the state ofTexas for the years 2000 and 2013.TABLE 2-5 LABOR FORCE AND EMPLOYMENTSTATElCOUNTY2000TexasLabor ForceEmploymentUnemploymentUnemployment RateHaleLabor 4,704UnemploymentUnemployment 007.0%2,6922,6521646.1%2,8242,6521726.1%Labor 366Unemployment Rate5.7%7.1%YoakumLabor ForceEmploymentUnemploymentUnemplovment Rate3,1522,8612919.2%3,7923,4863068.1%HockleyLabor ForceEmploymentUnemploymentUnemployment RateLubbockLabor ForceEmploymentUnemploymentUnemployment RateLynnLabor ForceEmploymentUnemploymentUnemployment RateTerrySources: USBOC 2000 and 2013AUS 146-128 (PER-02) XCEL ( 10/02/2015) 135321 LDPAGE 42455
POWER ENGINEERS, INC.TUCO to Yoakum 345-kV Transmission Line2.2.3.3 Leading Economic SectorsThe major occupations in the study area counties in 2013 include the category of management,business, science, and arts occupations. Table 2-6 presents the number of people employed in eachoccupation category during 2013 in each of the study area counties.TABLE 2-6OCCUPATIONS IN THE COUNTY WITHIN THE STUDY AREATOTAL NUMBER OF anagement, business, science,and arts occu pations3,4892 , 79545,3677401,741840Service occupations2,8901,88627,9764691,049510Sales and office occupations3,3592,42936,3416187435312 1 2931 , 77313 , 8384967111,0602 , 7731 , 55213 , 158329565545Natural resources, construction,and maintenance occu pationsProduction, transportation, andmaterial movin g occupationsSource: USBOC 2013.In 2000 and 2013, the industry that employed the most people in Hale County was educationalservices, and health care and social assistance. In 2000 and 2013, the industries that employed themost people in Hockley County were educational services, and health care and social assistance. In2000 and 2013, the industries that employed the most people in Lubbock County were educationalservices, and health care and social assistance. In 2000 and 2013, the industries that employed themost people in Lynn County were educational services, and health care and social assistance. In 2000,the industries that employed the most people in Terry County were agriculture, forestry, fishing andhunting, and mining. In 2013, the industries that employed the most people in Terry County wereeducational services, and health care and social assistance. In 2000 and 2013, the industries thatemployed the most people in Yoakum County were agriculture, forestry, fishing and hunting, andmining. Table 2-7 presents the number of people employed in each of the industries in the study areacounties for the years 2000 and 2013.AUS 146-128 (PER-02) XCEL (10/02/2015) 135321 LD456
POWER ENGINEERS, INC.TUCO to Yoakum 345-kV Transmission LineTABLE 2-7INDUSTRIES WITHIN THE STUDY AREATOTAL NUMBER OF 1 1 2871 , 2971 , 8821 , 8042,1363,5885824721 , 1914,2362,507785876814424516 , 9097 , 7565785464085987 , 7863,1043,1132,4172,4267931 , 112556973928938892Agriculture,forestry, fishing,and hunting, andminingConstructionManufacturingWholesale tradeRetail tradeTransportation,warehousing, andutilitiesInformationFinance andinsurance, realestate, rental, 43908810 , 77410 , 32815 , 362273853745,0135,527190232311330148195leasin gProfessional,scientific andmanagement,administrative, andwaste managementservicesEducationalservices, andhealth care andsocial assistanceArts, entertainment,recreation,accommodation ,and food servicesOther services,except publicadministrationPublicadministrationSource: USBOC 2000 and 2013.2.3PARKS AND RECREATION AREASThe PUC recognizes parks and recreational areas as those owned by a governmental body or anorganized group, club, or church. Federal and state databases and county/local maps were reviewed toidentify any parks and/or recreational areas within the study area. Field reconnaissance surveys werealso conducted to identify any additional park or recreational areas.AUS 146-128 (PER-02) XCEL (10/02/2015) 135321 LDPAGE 44457
POWER ENGINEERS, INC.TUCO to Yoakum 345-kV Transmission Line2.3. 1Nationa//State/County/Loca/ ParksNo national parks or monuments or state parks were identified within the study area counties(National Park Service [NPS] 2016; TPWD 2016a). Numerous city parks were identified within thestudy area. These are briefly summarized below.Abernathy City Park is located within the City of Abernathy. This park consists of 42 acres and offersplaygrounds, a public events pavilion, picnic areas, a five acre fishing pond, a walking trail,basketball, disc golf, and baseball and softball fields (City Data 2015a).The city parks located within the City of Lubbock include: Lt. Col. George Davis Park providesindividuals the opportunity to fly radio-controlled model airplanes at the Radio-Controlled ModelAirplane Field and also offers a picnic area (City of Lubbock 2015); Hinojosa Park has a pavedmultipurpose court for basketball and volleyball and a children's playground (City of Lubbock 2015).The City of Brownfield has numerous city parks covering approximately 141 acres. These parksinclude: Hamilton Park, Coleman Park, Terry County Park, Gillham Park & Howell Lake, FamilyFitness Fun Park, Kiddie Park, Judge Rhyne Trails Park, Jake Geron Park, and a skate park. Alsoincluded are the Franco softball field, girls softball fields, little league baseball fields and theBrownfield Family Aquatic Center (City of Brownfield 2015 and Brownfield Chamber and VisitorCenter 2015). Enoch Stuart Park is located northwest of Brownfield (City Data 2015b).The City of Levelland operates 10 recreation facilities with a diverse range of outdoor activitiesincluding basketball courts, tennis courts, pavilions, an amphitheater, sand volleyball courts, horseshoe pits, swings, slides, walking tracks, picnic tables, grills, baseball/softball fields, soccer fields,disc golf course, an activities building, and a civic center (City of Levelland 2015).Additional recreational activities such as hunting and fishing might occur on private propertiesthroughout the study area, but are not considered to be open to the general public.2.3.2Wildlife Viewing TrailsReview of the TPWD Panhandle Plains Wildlife Trail indicates that there are no wildlife viewingsites/driving loops located within the study area (TPWD 2016b).2.4HISTORICAL AND AESTHETIC VALUESSection 37.056(c)(4)(A-D) of PURA incorporates historical and aesthetic values as a considerationwhen evaluating proposed electric transmission facilities. The PUC's Standard Application for a CCNfurther stipulates that known historical sites within 1,000 feet of an alternative route will be listed,mapped, and their distance from the centerline of the route documented in the application filed forconsideration. Archeological sites within 1,000 feet of a route will be listed and their distance fromthe centerline documented, but they need not be shown on maps for the protection of the site. Sourcesconsulted to identify known sites (national, state, or local commission) shall also be listed.The THC is the state agency responsible for historic preservation. The THC, working in conjunctionwith the TARL maintains records of previously recorded cultural resources (archeological,architectural, and cemeteries) as well as records of previous field investigations. Information from theTHC's Restricted Access Texas Archeological Sites Atlas (ATLAS) was reviewed and GIS shapefilesAUS 146-128 (PER-02) XCEL ( 10/02/2015) 135321 LDPAGE 45458
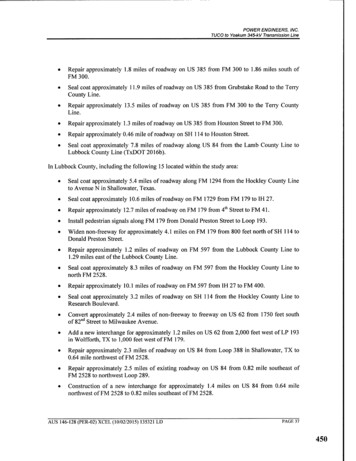
POWER ENGINEERS, INC.TUCO to Yoakum 345-kV Transmission Linewere acquired from the ATLAS and TARL to identify and map locations of previously recordedcultural resource sites within the study area.Together archeological and historical sites are often referred to as cultural resources. Under the NPS'sstandardized definitions, cultural resources include districts, sites, buildings, structures, or objectsimportant to a culture, subculture, or community for scientific, traditional, religious, or other reasons.For this study, cultural resources have been divided into three major categories: archeologicalresources, architectural resources, and historic cemeteries. These three categories correlate to theorganization of cultural resource records maintained by the THC and TARL. Archeological resources are locations on the ground surface or buried within the earth wherehuman activity has measurably altered or left deposits of physical remains (e.g., burnt rockmiddens, stone tools, petroglyphs, house foundations, bottles). Archeological resources candate to either prehistoric times or the historic era.Architectural Resources typically include standing buildings (e.g., houses, barns,outbuildings), but can also include structures (dams, canals, bridges, roads, silos), anddistricts that are non-archeological in nature.Cemeteries are places of intentional human interment and may include large public burialgrounds with multiple burials, small family plots with only a few burials, or individual gravesites. In some instances cemeteries may be designated as Historic Texas Cemeteries (HTC)by the THC and may be recognized with an Official Texas Historical Marker (OTHM). Othercemeteries may also be documented as part of the THC's Record, Investigate, and Protectprogram.2.4. 1Cultural BackgroundThe study area is located within the Plains Cultural Resource Planning Region as delineated by theTHC (Mercado-Allinger et al. 1996) and shown in Figure 2-3. Geographically, the study area islocated on the southern reaches of the Southern High Plains, along the southern edge of the LlanoEstacado. This region is largely devoid of topographic relief, and what slight relief exists occursprimarily as small lake and playa basins, dunes, and dry valleys. The majority of in situ NativeAmerican archeological deposits have been recorded in association with these features. Archeologistshave divided the prehistoric occupation of the region into three main periods: the Paleoindian,Archaic, and Late Prehistoric or Ceramic periods (Johnson and Holliday 2004).AUS 146-128 (PER-02) XCEL (10/02/2015) 135321 LDPAGE 46459
LegendCultural Resource PlanningRegion BoundaryQ County Boundary03060120180MilesSourceMercado- Allmgeret, al, 1996240TUCO - Yoakum345-kV ProjectFigure 2-3Location of Study AreaIn Relation to theCultural Resource PlanningRegions of Texas ;" FYt7WE ENG7NEERSXcel460
POWER ENGINEERS, INC.TUCO to Yoakum 345-kV Transmission Line2.4.1.1PrehistoryPaleoindian (ca. 11,500 to ca. 8,600 years ago). Evidence of human occupation in the Southern HighPlains of northwestern Texas and eastern New Mexico spans the last 11,500 years (Johnson andHolliday 2004). The archaeological complexes of the Paleoindian period are represented by theClovis and Folsom complexes, and Late Paleoindian period, each recognizably based on distinctivelithic technology.The Clovis subperiod extended from approximately 11,500 years ago to 11,000 years ago during theterminal Late Pleistocene. Clovis occupation sites have been identified on the Llano Estacado,however, only three have in situ Clovis deposits; the Blackwater Draw #1 (Clovis type-site) in NewMexico, the Miami site northeast of Amarillo, and the Lubbock Lake occupation west of Lubbock(Johnson and Holliday 2004). Each of these sites contained Clovis-type spear points found in'association with mammoth remains indicating that the Clovis population was relying on the animalsas an important food base. At the Lubbock Lake site, at least six species of extinct megafauna werefound exhibiting evidence that the sites were used as butchering or primary kill sites (Johnson andHolliday 2004). Despite the popular misconception that these early populations were primarilyhunters, evidence from the Gault Site in central Texas suggests that their diet was more generalized(Collins 2002). Clovis cultures hunted big game out of base camps for short periods of time, but werehighly mobile and rarely stayed for long periods at any one location.The transition from the Clovis to Folsom Period was marked by a significant climatic andenvironmental change which continued into Late Paleoindian times (Johnson and Holliday 2004).Average summer temperatures warmed from the earlier period while the average winter temperaturesdipped below those during the Clovis Period with sustained freezing periods. Perennial streamspersisted in the lower reaches of most draws. Ponds and marshes surrounded by lush vegetation beganto form in the upper end of the draws. Many of the large animals hunted by Clovis populations diedoff as a result of the temperature fluctuation; however, large bison thrived and congregated around theponds where food was plentiful. Folsom people took advantage of the localized food base and largebison became the mainstay of the Folsom diet (Johnson and Holliday 2004).A consistent and plentiful food base led to an increased Folsom population as suggested by the sharprise in the number of archeological sites dating to this period (ca. 10,800 to 10,300 years ago). It alsoappears from archeological assemblages at sites such as Lipscomb, Lake Theo, Lubbock Lake, andthe Midland/Scharbauer that Folsom people were occupying established camp sites for longer periodsof time. Many of these campsites were in close proximity to the water sources frequented by bison(Johnson and Holliday 2004).The Midland/Scharbauer site is an archeological site dating to the Folsom era located southwest of thestudy area along Monahans Draw south of Midland. In 1953, human bone and teeth were founderoding out of the dry channel of Monahans Draw. Subsequent archeological investigations in thedraw and adjacent deflation basins from 1953 to 1955 uncovered numerous artifacts that dated to theFolsom period. Many projectile points recovered from the excavations closely resembled thetraditional Folsom point, but without the characteristic fluting. This projectile point was named"Midland" after the site. Early dating methods determined that the artifacts date to around 10,000years ago. Skeletal remains of a woman unearthed at the site were initially thought to date up to20,000 years before present. More recent investigations at the site have determined that the age ofskeletal remains is most likely closer to that of the artifacts - somewhere between 11,000 and 1
Seal coat approximately 3.2 miles of roadway on SH 114 from the Hockley County Line to Research Boulevard. Convert approximately 2.4 miles of non-freeway to freeway on US 62 from 1750 feet south of 82 d Street to Milwaukee Avenue. Add a new interchange for approx