Transcription
Introduction to Data MiningInstructor’s Solution ManualPang-Ning TanMichael SteinbachVipin KumarcCopyright 2006Pearson Addison-Wesley. All rights reserved.
Contents1 Introduction12 Data53 Exploring Data194 Classification: Basic Concepts, Decision Trees, and ModelEvaluation255 Classification: Alternative Techniques456 Association Analysis: Basic Concepts and Algorithms717 Association Analysis: Advanced Concepts958 Cluster Analysis: Basic Concepts and Algorithms1259 Cluster Analysis: Additional Issues and Algorithms14710 Anomaly Detection157iii
1Introduction1. Discuss whether or not each of the following activities is a data miningtask.(a) Dividing the customers of a company according to their gender.No. This is a simple database query.(b) Dividing the customers of a company according to their profitability.No. This is an accounting calculation, followed by the application of a threshold. However, predicting the profitability of a newcustomer would be data mining.(c) Computing the total sales of a company.No. Again, this is simple accounting.(d) Sorting a student database based on student identification numbers.No. Again, this is a simple database query.(e) Predicting the outcomes of tossing a (fair) pair of dice.No. Since the die is fair, this is a probability calculation. If thedie were not fair, and we needed to estimate the probabilities ofeach outcome from the data, then this is more like the problemsconsidered by data mining. However, in this specific case, solutions to this problem were developed by mathematicians a longtime ago, and thus, we wouldn’t consider it to be data mining.(f) Predicting the future stock price of a company using historicalrecords.Yes. We would attempt to create a model that can predict thecontinuous value of the stock price. This is an example of the
2 Chapter 1Introductionarea of data mining known as predictive modelling. We could useregression for this modelling, although researchers in many fieldshave developed a wide variety of techniques for predicting timeseries.(g) Monitoring the heart rate of a patient for abnormalities.Yes. We would build a model of the normal behavior of heartrate and raise an alarm when an unusual heart behavior occurred.This would involve the area of data mining known as anomaly detection. This could also be considered as a classification problemif we had examples of both normal and abnormal heart behavior.(h) Monitoring seismic waves for earthquake activities.Yes. In this case, we would build a model of different types ofseismic wave behavior associated with earthquake activities andraise an alarm when one of these different types of seismic activitywas observed. This is an example of the area of data miningknown as classification.(i) Extracting the frequencies of a sound wave.No. This is signal processing.2. Suppose that you are employed as a data mining consultant for an Internet search engine company. Describe how data mining can help thecompany by giving specific examples of how techniques, such as clustering, classification, association rule mining, and anomaly detectioncan be applied.The following are examples of possible answers. Clustering can group results with a similar theme and presentthem to the user in a more concise form, e.g., by reporting the10 most frequent words in the cluster. Classification can assign results to pre-defined categories such as“Sports,” “Politics,” etc. Sequential association analysis can detect that that certain queriesfollow certain other queries with a high probability, allowing formore efficient caching. Anomaly detection techniques can discover unusual patterns ofuser traffic, e.g., that one subject has suddenly become muchmore popular. Advertising strategies could be adjusted to takeadvantage of such developments.
33. For each of the following data sets, explain whether or not data privacyis an important issue.(a) Census data collected from 1900–1950. No(b) IP addresses and visit times of Web users who visit your Website.Yes(c) Images from Earth-orbiting satellites. No(d) Names and addresses of people from the telephone book. No(e) Names and email addresses collected from the Web. No
2Data1. In the initial example of Chapter 2, the statistician says, “Yes, fields 2 and3 are basically the same.” Can you tell from the three lines of sample datathat are shown why she says that? 7 for the values displayed. While it can be dangerous to draw conclusions from such a small sample, the two fields seem to contain essentiallythe same information.Field 2Field 32. Classify the following attributes as binary, discrete, or continuous. Alsoclassify them as qualitative (nominal or ordinal) or quantitative (interval orratio). Some cases may have more than one interpretation, so briefly indicateyour reasoning if you think there may be some ambiguity.Example: Age in years. Answer: Discrete, quantitative, ratio(a) Time in terms of AM or PM. Binary, qualitative, ordinal(b) Brightness as measured by a light meter. Continuous, quantitative,ratio(c) Brightness as measured by people’s judgments. Discrete, qualitative,ordinal(d) Angles as measured in degrees between 0 and 360 . Continuous, quantitative, ratio(e) Bronze, Silver, and Gold medals as awarded at the Olympics. Discrete,qualitative, ordinal(f) Height above sea level. Continuous, quantitative, interval/ratio (depends on whether sea level is regarded as an arbitrary origin)(g) Number of patients in a hospital. Discrete, quantitative, ratio(h) ISBN numbers for books. (Look up the format on the Web.) Discrete,qualitative, nominal (ISBN numbers do have order information, though)
6 Chapter 2Data(i) Ability to pass light in terms of the following values: opaque, translucent, transparent. Discrete, qualitative, ordinal(j) Military rank. Discrete, qualitative, ordinal(k) Distance from the center of campus. Continuous, quantitative, interval/ratio (depends)(l) Density of a substance in grams per cubic centimeter. Discrete, quantitative, ratio(m) Coat check number. (When you attend an event, you can often giveyour coat to someone who, in turn, gives you a number that you canuse to claim your coat when you leave.) Discrete, qualitative, nominal3. You are approached by the marketing director of a local company, who believes that he has devised a foolproof way to measure customer satisfaction.He explains his scheme as follows: “It’s so simple that I can’t believe thatno one has thought of it before. I just keep track of the number of customercomplaints for each product. I read in a data mining book that counts areratio attributes, and so, my measure of product satisfaction must be a ratioattribute. But when I rated the products based on my new customer satisfaction measure and showed them to my boss, he told me that I had overlookedthe obvious, and that my measure was worthless. I think that he was justmad because our best-selling product had the worst satisfaction since it hadthe most complaints. Could you help me set him straight?”(a) Who is right, the marketing director or his boss? If you answered, hisboss, what would you do to fix the measure of satisfaction?The boss is right. A better measure is given bySatisfaction(product) number of complaints for the product.total number of sales for the product(b) What can you say about the attribute type of the original productsatisfaction attribute?Nothing can be said about the attribute type of the original measure.For example, two products that have the same level of customer satisfaction may have different numbers of complaints and vice-versa.4. A few months later, you are again approached by the same marketing directoras in Exercise 3. This time, he has devised a better approach to measure theextent to which a customer prefers one product over other, similar products.He explains, “When we develop new products, we typically create severalvariations and evaluate which one customers prefer. Our standard procedureis to give our test subjects all of the product variations at one time and then
7ask them to rank the product variations in order of preference. However, ourtest subjects are very indecisive, especially when there are more than twoproducts. As a result, testing takes forever. I suggested that we performthe comparisons in pairs and then use these comparisons to get the rankings.Thus, if we have three product variations, we have the customers comparevariations 1 and 2, then 2 and 3, and finally 3 and 1. Our testing time withmy new procedure is a third of what it was for the old procedure, but theemployees conducting the tests complain that they cannot come up with aconsistent ranking from the results. And my boss wants the latest productevaluations, yesterday. I should also mention that he was the person whocame up with the old product evaluation approach. Can you help me?”(a) Is the marketing director in trouble? Will his approach work for generating an ordinal ranking of the product variations in terms of customerpreference? Explain.Yes, the marketing director is in trouble. A customer may give inconsistent rankings. For example, a customer may prefer 1 to 2, 2 to 3,but 3 to 1.(b) Is there a way to fix the marketing director’s approach? More generally,what can you say about trying to create an ordinal measurement scalebased on pairwise comparisons?One solution: For three items, do only the first two comparisons. Amore general solution: Put the choice to the customer as one of ordering the product, but still only allow pairwise comparisons. In general,creating an ordinal measurement scale based on pairwise comparison isdifficult because of possible inconsistencies.(c) For the original product evaluation scheme, the overall rankings of eachproduct variation are found by computing its average over all test subjects. Comment on whether you think that this is a reasonable approach. What other approaches might you take?First, there is the issue that the scale is likely not an interval or ratioscale. Nonetheless, for practical purposes, an average may be goodenough. A more important concern is that a few extreme ratings mightresult in an overall rating that is misleading. Thus, the median or atrimmed mean (see Chapter 3) might be a better choice.5. Can you think of a situation in which identification numbers would be usefulfor prediction?One example: Student IDs are a good predictor of graduation date.6. An educational psychologist wants to use association analysis to analyze testresults. The test consists of 100 questions with four possible answers each.
8 Chapter 2Data(a) How would you convert this data into a form suitable for associationanalysis?Association rule analysis works with binary attributes, so you have toconvert original data into binary form as follows:Q1 A10Q1 B00Q1 C01Q1 D00.Q100 A10Q100 B01Q100 C00Q100 D00(b) In particular, what type of attributes would you have and howmany of them are there?400 asymmetric binary attributes.7. Which of the following quantities is likely to show more temporal autocorrelation: daily rainfall or daily temperature? Why?A feature shows spatial auto-correlation if locations that are closer to eachother are more similar with respect to the values of that feature than locations that are farther away. It is more common for physically close locationsto have similar temperatures than similar amounts of rainfall since rainfallcan be very localized;, i.e., the amount of rainfall can change abruptly fromone location to another. Therefore, daily temperature shows more spatialautocorrelation then daily rainfall.8. Discuss why a document-term matrix is an example of a data set that hasasymmetric discrete or asymmetric continuous features.The ij th entry of a document-term matrix is the number of times that termj occurs in document i. Most documents contain only a small fraction ofall the possible terms, and thus, zero entries are not very meaningful, eitherin describing or comparing documents. Thus, a document-term matrix hasasymmetric discrete features. If we apply a TFIDF normalization to termsand normalize the documents to have an L2 norm of 1, then this creates aterm-document matrix with continuous features. However, the features arestill asymmetric because these transformations do not create non-zero entriesfor any entries that were previously 0, and thus, zero entries are still not verymeaningful.9. Many sciences rely on observation instead of (or in addition to) designed experiments. Compare the data quality issues involved in observational sciencewith those of experimental science and data mining.Observational sciences have the issue of not being able to completely controlthe quality of the data that they obtain. For example, until Earth orbit-
9ing satellites became available, measurements of sea surface temperature relied on measurements from ships. Likewise, weather measurements are oftentaken from stations located in towns or cities. Thus, it is necessary to workwith the data available, rather than data from a carefully designed experiment. In that sense, data analysis for observational science resembles datamining.10. Discuss the difference between the precision of a measurement and the termssingle and double precision, as they are used in computer science, typicallyto represent floating-point numbers that require 32 and 64 bits, respectively.The precision of floating point numbers is a maximum precision. More explicity, precision is often expressed in terms of the number of significant digitsused to represent a value. Thus, a single precision number can only representvalues with up to 32 bits, 9 decimal digits of precision. However, often theprecision of a value represented using 32 bits (64 bits) is far less than 32 bits(64 bits).11. Give at least two advantages to working with data stored in text files insteadof in a binary format.(1) Text files can be easily inspected by typing the file or viewing it with atext editor.(2) Text files are more portable than binary files, both across systems andprograms.(3) Text files can be more easily modified, for example, using a text editoror perl.12. Distinguish between noise and outliers. Be sure to consider the followingquestions.(a) Is noise ever interesting or desirable? Outliers?No, by definition. Yes. (See Chapter 10.)(b) Can noise objects be outliers?Yes. Random distortion of the data is often responsible for outliers.(c) Are noise objects always outliers?No. Random distortion can result in an object or value much like anormal one.(d) Are outliers always noise objects?No. Often outliers merely represent a class of objects that are differentfrom normal objects.(e) Can noise make a typical value into an unusual one, or vice versa?Yes.
10 Chapter 2Data13. Consider the problem of finding the K nearest neighbors of a data object. Aprogrammer designs Algorithm 2.1 for this task.Algorithm 2.1 Algorithm for finding K nearest neighbors.1: for i 1 to number of data objects do2:Find the distances of the ith object to all other objects.3:Sort these distances in decreasing order.(Keep track of which object is associated with each distance.)4:return the objects associated with the first K distances of the sorted list5: end for(a) Describe the potential problems with this algorithm if there are duplicate objects in the data set. Assume the distance function will onlyreturn a distance of 0 for objects that are the same.There are several problems. First, the order of duplicate objects on anearest neighbor list will depend on details of the algorithm and theorder of objects in the data set. Second, if there are enough duplicates,the nearest neighbor list may consist only of duplicates. Third, anobject may not be its own nearest neighbor.(b) How would you fix this problem?There are various approaches depending on the situation. One approachis to to keep only one object for each group of duplicate objects. Inthis case, each neighbor can represent either a single object or a groupof duplicate objects.14. The following attributes are measured for members of a herd of Asian elephants: weight, height, tusk length, trunk length, and ear area. Based onthese measurements, what sort of similarity measure from Section 2.4 wouldyou use to compare or group these elephants? Justify your answer and explain any special circumstances.These attributes are all numerical, but can have widely varying ranges ofvalues, depending on the scale used to measure them. Furthermore, theattributes are not asymmetric and the magnitude of an attribute matters.These latter two facts eliminate the cosine and correlation measure. Euclidean distance, applied after standardizing the attributes to have a meanof 0 and a standard deviation of 1, would be appropriate.15. You are given a set of m objects that is divided into K groups, where the ithgroup is of size mi . If the goal is to obtain a sample of size n m, what is thedifference between the following two sampling schemes? (Assume samplingwith replacement.)
11(a) We randomly select n mi /m elements from each group.(b) We randomly select n elements from the data set, without regard forthe group to which an object belongs.The first scheme is guaranteed to get the same number of objects from eachgroup, while for the second scheme, the number of objects from each groupwill vary. More specifically, the second scheme only guarantes that, on average, the number of objects from each group will be n mi /m.16. Consider a document-term matrix, where tfij is the frequency of the ith word(term) in the j th document and m is the number of documents. Considerthe variable transformation that is defined by tfij logtfijm,dfi(2.1)where dfi is the number of documents in which the ith term appears and isknown as the document frequency of the term. This transformation isknown as the inverse document frequency transformation.(a) What is the effect of this transformation if a term occurs in one document? In every document?Terms that occur in every document have 0 weight, while those thatoccur in one document have maximum weight, i.e., log m.(b) What might be the purpose of this transformation?This normalization reflects the observation that terms that occur inevery document do not have any power to distinguish one documentfrom another, while those that are relatively rare do.17. Assume that we apply a square root transformation to a ratio attribute xto obtain the new attribute x . As part of your analysis, you identify aninterval (a, b) in which x has a linear relationship to another attribute y.(a) What is the corresponding interval (a, b) in terms of x? (a2 , b2 )(b) Give an equation that relates y to x. In this interval, y x2 .18. This exercise compares and contrasts some similarity and distance measures.(a) For binary data, the L1 distance corresponds to the Hamming distance;that is, the number of bits that are different between two binary vectors. The Jaccard similarity is a measure of the similarity between twobinary vectors. Compute the Hamming distance and the Jaccard similarity between the following two binary vectors.
12 Chapter 2Datax 0101010001y 0100011000Hamming distance number of different bits 3Jaccard Similarity number of 1-1 matches /( number of bits - number0-0 matches) 2 / 5 0.4(b) Which approach, Jaccard or Hamming distance, is more similar to theSimple Matching Coefficient, and which approach is more similar to thecosine measure? Explain. (Note: The Hamming measure is a distance,while the other three measures are similarities, but don’t let this confuseyou.)The Hamming distance is similar to the SMC. In fact, SMC Hammingdistance / number of bits.The Jaccard measure is similar to the cosine measure because bothignore 0-0 matches.(c) Suppose that you are comparing how similar two organisms of differentspecies are in terms of the number of genes they share. Describe whichmeasure, Hamming or Jaccard, you think would be more appropriatefor comparing the genetic makeup of two organisms. Explain. (Assumethat each animal is represented as a binary vector, where each attributeis 1 if a particular gene is present in the organism and 0 otherwise.)Jaccard is more appropriate for comparing the genetic makeup of twoorganisms; since we want to see how many genes these two organismsshare.(d) If you wanted to compare the genetic makeup of two organisms of thesame species, e.g., two human beings, would you use the Hammingdistance, the Jaccard coefficient, or a different measure of similarity ordistance? Explain. (Note that two human beings share 99.9% of thesame genes.)Two human beings share 99.9% of the same genes. If we want tocompare the genetic makeup of two human beings, we should focus ontheir differences. Thus, the Hamming distance is more appropriate inthis situation.19. For the following vectors, x and y, calculate the indicated similarity or distance measures.(a) x (1, 1, 1, 1), y (2, 2, 2, 2) cosine, correlation, Euclideancos(x, y) 1, corr(x, y) 0/0 (undefined), Euclidean(x, y) 2(b) x (0, 1, 0, 1), y (1, 0, 1, 0) cosine, correlation, Euclidean, Jaccardcos(x, y) 0, corr(x, y) 1, Euclidean(x, y) 2, Jaccard(x, y) 0
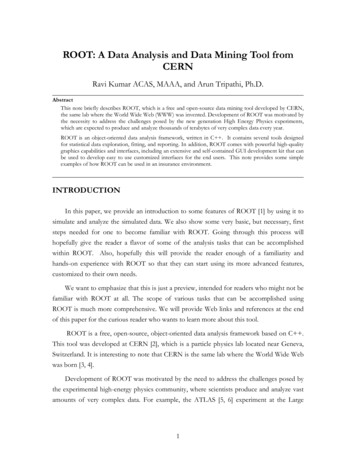
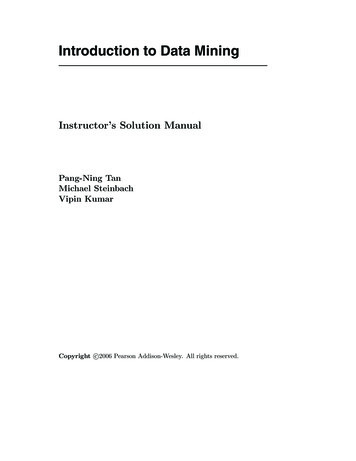
13(c) x (0, 1, 0, 1), y (1, 0, 1, 0) cosine, correlation, Euclideancos(x, y) 0, corr(x, y) 0, Euclidean(x, y) 2(d) x (1, 1, 0, 1, 0, 1), y (1, 1, 1, 0, 0, 1) cosine, correlation, Jaccardcos(x, y) 0.75, corr(x, y) 0.25, Jaccard(x, y) 0.6(e) x (2, 1, 0, 2, 0, 3), y ( 1, 1, 1, 0, 0, 1) cosine, correlationcos(x, y) 0, corr(x, y) 020. Here, we further explore the cosine and correlation measures.(a) What is the range of values that are possible for the cosine measure?[ 1, 1]. Many times the data has only positive entries and in that casethe range is [0, 1].(b) If two objects have a cosine measure of 1, are they identical? Explain.Not necessarily. All we know is that the values of their attributes differby a constant factor.(c) What is the relationship of the cosine measure to correlation, if any?(Hint: Look at statistical measures such as mean and standard deviation in cases where cosine and correlation are the same and different.)For two vectors, x and y that have a mean of 0, corr(x, y) cos(x, y).(d) Figure 2.1(a) shows the relationship of the cosine measure to Euclideandistance for 100,000 randomly generated points that have been normalized to have an L2 length of 1. What general observation can you makeabout the relationship between Euclidean distance and cosine similaritywhen vectors have an L2 norm of 1?Since all the 100,000 points fall on the curve, there is a functional relationship between Euclidean distance and cosine similarity for normalized data. More specifically, there is an inverse relationship betweencosine similarity and Euclidean distance. For example, if two datapoints are identical, their cosine similarity is one and their Euclideandistance is zero, but if two data points have a high Euclidean distance,their cosine value is close to zero. Note that all the sample data pointswere from the positive quadrant, i.e., had only positive values. Thismeans that all cosine (and correlation) values will be positive.(e) Figure 2.1(b) shows the relationship of correlation to Euclidean distancefor 100,000 randomly generated points that have been standardizedto have a mean of 0 and a standard deviation of 1. What generalobservation can you make about the relationship between Euclideandistance and correlation when the vectors have been standardized tohave a mean of 0 and a standard deviation of 1?
14 Chapter 2DataSame as previous answer, but with correlation substituted for cosine.(f) Derive the mathematical relationship between cosine similarity and Euclidean distance when each data object has an L2 length of 1.Let x and y be two vectors where each vector has an L2 length of 1.For such vectors, the variance is just n times the sum of its squaredattribute values and the correlation between the two vectors is theirdot product divided by n. n d(x, y) (xk yk )2k 1 n x2k 2xk yk yk2 k 11 2cos(x, y) 12(1 cos(x, y))(g) Derive the mathematical relationship between correlation and Euclideandistance when each data point has been been standardized by subtracting its mean and dividing by its standard deviation.Let x and y be two vectors where each vector has an a mean of 0and a standard deviation of 1. For such vectors, the variance (standarddeviation squared) is just n times the sum of its squared attribute valuesand the correlation between the two vectors is their dot product dividedby n. n d(x, y) (xk yk )2k 1 n x2k 2xk yk yk2 k 1n 2ncorr(x, y) n2n(1 corr(x, y))21. Show that the set difference metric given byd(A, B) size(A B) size(B A)satisfies the metric axioms given on page 70. A and B are sets and A B isthe set difference.
1.41.41.21.2Euclidean DistanceEuclidean ine Similarity0.8(a) Relationship between Euclideandistance and the cosine measure.1000.20.40.6Correlation0.81(b) Relationship between Euclideandistance and correlation.Figure 2.1. Figures for exercise 20.1(a). Because the size of a set is greater than or equal to 0, d(x, y) 0.1(b). if A B, then A B B A empty set and thus d(x, y) 02. d(A, B) size(A B) size(B A) size(B A) size(A B) d(B, A)3. First, note that d(A, B) size(A) size(B) 2size(A B). d(A, B) d(B, C) size(A) size(C) 2size(B) 2size(A B) 2size(B C)Since size(A B) size(B) and size(B C) size(B),d(A, B) d(B, C) size(A) size(C) 2size(B) 2size(B) size(A) size(C) size(A) size(C) 2size(A C) d(A, C) d(A, C) d(A, B) d(B, C)22. Discuss how you might map correlation values from the interval [ 1,1] to theinterval [0,1]. Note that the type of transformation that you use might dependon the application that you have in mind. Thus, consider two applications:clustering time series and predicting the behavior of one time series givenanother.For time series clustering, time series with relatively high positive correlationshould be put together. For this purpose, the following transformation wouldbe appropriate: corr if corr 0sim 0if corr 0For predicting the behavior of one time series from another, it is necessary toconsider strong negative, as well as strong positive, correlation. In this case,the following transformation, sim corr might be appropriate. Note thatthis assumes that you only want to predict magnitude, not direction.
16 Chapter 2Data23. Given a similarity measure with values in the interval [0,1] describe two waysto transform this similarity value into a dissimilarity value in the interval[0, ].d 1 ssand d log s.24. Proximity is typically defined between a pair of objects.(a) Define two ways in which you might define the proximity among a groupof objects.Two examples are the following: (i) based on pairwise proximity, i.e.,minimum pairwise similarity or maximum pairwise dissimilarity, or (ii)for points in Euclidean space compute a centroid (the mean of all thepoints—see Section 8.2) and then compute the sum or average of thedistances of the points to the centroid.(b) How might you define the distance between two sets of points in Euclidean space?One approach is to compute the distance between the centroids of thetwo sets of points.(c) How might you define the proximity between two sets of data objects?(Make no assumption about the data objects, except that a proximitymeasure is defined between any pair of objects.)One approach is to compute the average pairwise proximity of objectsin one group of objects with those objects in the other group. Otherapproaches are to take the minimum or maximum proximity.Note that the cohesion of a cluster is related to the notion of the proximityof a group of objects among themselves and that the separation of clustersis related to concept of the proximity of two groups of objects. (See Section8.4.) Furthermore, the proximity of two clusters is an important concept inagglomerative hierarchical clustering. (See Section 8.2.)25. You are given a set of points S in Euclidean space, as well as the distance ofeach point in S to a point x. (It does not matter if x S.)(a) If the goal is to find all points within a specified distance ε of point y,y x, explain how you could use the triangle inequality and the already calculated distances to x to potentially reduce the number of distance calculations necessary? Hint: The triangle inequality, d(x, z) d(x, y) d(y, x), can be rewritten as d(x, y) d(x, z) d(y, z).Unfortunately, there is a typo and a lack of clarity in the hint. Thehint should be phrased as follows:
17Hint: If z is an arbitrary point of S, then the triangle inequality,d(x, y) d(x, z) d(y, z), can be rewritten as d(y, z) d(x, y) d(x, z).Another application of the triangle inequality starting with d(x, z) d(x, y) d(y, z), shows that d(y, z) d(x, z) d(x, y). If the lowerbound of d(y, z) obtained from either of these inequalities is greaterthan , then d(y, z) does not need to be calculated. Also, if the upperbound of d(y, z) obtained from the inequality d(y, z) d(y, x) d(x, z)is less than or equal to , then d(x, z) does not need to be calculated.(b) In general, how would the distance between x and y affect the numberof distance calculations?If x y then no calculations are necessary. As x becomes farther away,typically more distance calculations are needed.(c) Suppose that you can find a small subset of points S , from the originaldata set, such that every point in the data set is within a specifieddistance ε of at least one of the points in S , and that you also havethe pairwise distance matrix for S . Describe a technique that uses thisinformation to compute, with a minimum of distance calculations, theset of all points within a distance of β of a specified point from the dataset.Let x and y be the two points and let x and y be the points in S that are closest to the two po
(m) Coat check number. (When you attend an event, you can often give your coat to someone who, in turn, gives you a number that you can use to claim your coat when you leave.) Discrete, qualitative, nominal 3. You are approac