Transcription
Journal of Mechanical EngineeringVol SI 5(6), 226-238, 2018Mathematical Modelling of PlasticInjection Molding Process UsingCentral Composite Design (CCD)Sampling and PRSM11,2Kausalyah V., 2Norfiza Athyrah B.M.F.,Universiti Teknologi MARA, Shah Alam, Malaysia33Shasthri S.,Heriott Watt University Malaysia, ction Molding is the most widely used plastic manufacturing process forproducing outputs from a mold, particularly in polymer processing. Thisprocess is highly recommended to deliver high-quality product with low-costproduction in a brief time. A Design of Experiment (DoE) approach isadapted to generate the experimental samples and the sampling methodproposed to be studied in this research is the Central Composite Design(CCD). The study presents the application on Central Composite Design(CCD) and Response Surface Methodology (RSM) for the generation of themathematical model. Four experimental parameters were chosen as the inputvariables which are pigmentation percentage, barrel temperature, barrelpressure and cooling time, while shrinkage is the output response parameterstudied. The quadratic polynomial model is selected to significantly predictthe interactions of the parameters and the response factor. The evaluation ofthe model is done through the analysis of variance (ANOVA) and 3Dresponse surface plots are generated to illustrate the cross factors’relationships. From the ANOVA results obtained, the reduced model offers abetter fit with a PRESS RMSE of 6.89 and PRESS R 2 of 71.2% in comparisonto the full model. It can be concluded that CCD sampling is able to soundlypredict the response of the parameters studied in the injection mouldingprocess based on the statistical diagnostics obtained. It is also noted in bothISSN 1823- 5514, eISSN 2550-164X 2016 Faculty of Mechanical Engineering,Universiti Teknologi MARA (UiTM), Malaysia.Received for review: 2017-07-12Accepted for publication: 2017-08-02Published: 2018-05-15
Kausalyah V. et al.models that the pigmentation percentage (x1) is most influential factor inminimizing shrinkage in the plastic injection moulding process.Keywords: plastic injection moulding, pigmentation percentage, centralcomposite design, polynomial response surface methodology(PRSM).IntroductionCommon problems that are usually faced by manufacturers in plasticinjection molding (PIM) process are the parameters that affect the process inmaking the final product. There are so many parameters in this process thatmust be controlled to ensure that a product is properly manufactured. Thereare studies showing that there are more than 200 different parameters that hasdirect or indirect effect on the end product of this process [1]. Injectionmolding process will produce a different quality of product for everyparameter that changes. In this study, the product analyzed is a bookmarkwith UiTM logo on it. Three most commonly contributing parameters whichhave been known to contribute in the injection molding process efficacy arethe cooling time, barrel temperature and barrel pressure. One newerparameter added which is the percentage of pigmentation used in producing acolored product. Though pigmentation percentage is not a process parameter,nevertheless it interestingly has been highlighted to contribute to the outcomeof an injection molded product [13]. Color pigments are of very importantuse in plastic injection molding as they increase the aesthetic value of theproduct. Commonly a rule of thumb is used in adding the color pigments togenerate colored product [13]. The response factor studied in this research isthe shrinkage defect.To facilitate this study, a Design of Experiment (DoE) method isadapted. In the injection molding process, several established researchershave achieved valuable inputs by adopting this method. Previous researchershave clearly defined the effect of parameters towards various types ofresponse and material.[2]- [3]. A number of past researches which are relatedto this project also have been performed by the author [4]–[6], whereby thefindings was used as the guidance for selecting the factors and level in thisstudy.The objectives of this study is to generate a set of experimentaldesigns through DoE using the classical Central Composite Design samplingtechnique and to evaluate the efficacy of the CCD sampling techniquethrough a polynomial response surface mathematical modeling and statisticaldiagnostics such as the ANOVA. The advantage of the CCD sampling227
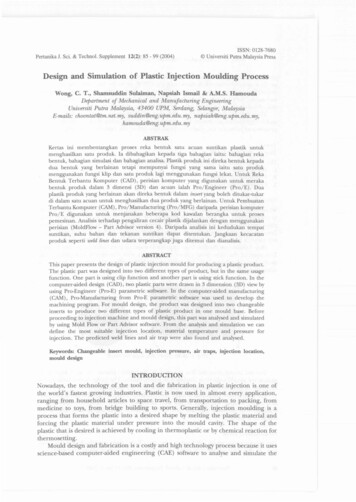
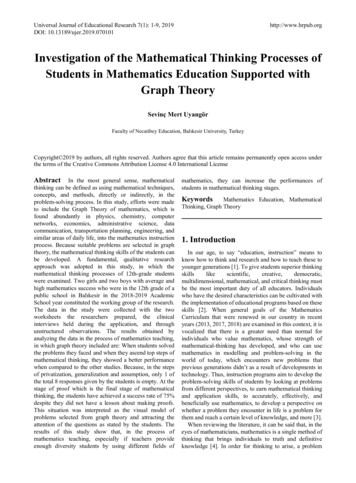
Mathematical Modelling PIM using CCD and RSMmethod is the ability to identify the direct and cross effects of each of theprocess parameters on shrinkage as a defect present.Optimal process parameters setting are considered as one of theimportant steps in injection molding for improving the quality of moldedproduct [7]. Previously, production engineers used trial and error method todetermine the molding optimal process parameters setting. This is timeconsuming and costly [5]. The response surface methodology (RSM) wasused to optimize the quality characteristics by determining the mostappropriate and accurate molding process parameters setting. An additionalmaterial setting which is the pigmentation percentage is also studied toidentify the extend of effect it has on the shrinkage of a plastic injectionmolded part.However, despite the many studies on the impact of different inputparameters on to the finished product, there were few similar studies found toinvestigate the mathematical modeling of the input parameter by using CCDsampling method and the use of polynomial Response Surface Methodology(RSM) as an optimizer to generate the mathematical model. Little has alsobeen done to research the effect of color pigments on the PIM products.Thus, this study will evaluate the relationship of the chosen input parametersto the response defect which is shrinkage by using both the CCD samplingmethod and RSM modeling. Optimal input parameters that yield an optimaloutput which is a very crucial factor in producing mass production where bydefects should be minimal for marketing advantages [2].(a)(b)Figure 1: (a) Plastic Injection molding machine;(b) Polypropylenes (PP) white and colors used as raw materialMethodologyThe experimental process starts with the identification of methods andrecommendation of input and output factors to use throughout theexperiment. The chosen sampling technique to be use in this study would bethe traditional sampling method, Central Composite Design (CCD) and the228
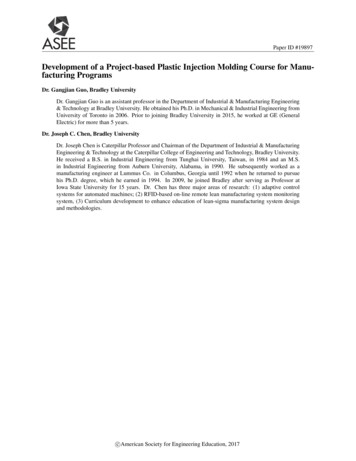
Kausalyah V. et al.mathematical model is obtained through the Polynomial Response SurfaceMethodology (RSM). The parameters selected were pigmentation (𝑥1 ), barreltemperature (𝑥2 ), barrel pressure (𝑥3 ) and cooling time (𝑥4 ) and the responsedata for (y) is shrinkage.Design of Experiment (DoE)In this study, the plastic injection molding process uses the Jinhwa GlotechVDCII -140 machine as the primary method for producing the bookmark.Polypropylene (PP) materials white and colored were used as the rawmaterial. Figure below shows the PIM machine and the PP materials used toproduce the bookmark.A set of 36 experimental runs was generated through the CCDsampling technique, where 16 of them are factorial runs (coded to the usual notation), 8 axial runs and 12 center runs in MATLAB 2016a. CentralComposite Designs are commonly preferred as it is very flexible and can berun sequentially, thus it facilitates the experimentation process [14].In RSM, the second-order models which take the form of quadraticpolynomial function used to develop an approximate model which offers andexplicit relationship between the response of interest and design variables[11]. Let f(x) be the response function and f’(x) its approximation functionobtained by second order polynomial form𝑚𝑚𝑚 1 𝑚𝑓(𝑥) 𝛽0 𝛽𝑖 𝑥𝑖 𝛽𝑖𝑖 𝑥𝑖 12𝑖 1𝑖 𝛽𝑖𝑗 𝑥𝑖 𝑥𝑗 𝜀(2)𝑖 1 𝑗 1where m is the total number of design variables, x is the ith designvariable, 𝜀 is the error and the 𝛽s are unknown coefficient.Coordinate Measuring Machine (CMM)Shrinkage was chosen as the response output from the experiment bycontrolling the 4 selected injection molding parameters. This qualitycharacteristic was measured on specimens after the injection molding processwas performed. The specimens that have been ejected from the mold werebrought to the Coordinate Measuring Machine (CMM) to measurespecimens’ thickness. Seven measuring points were identified on theproducts and the average value was calculated.Shrinkage is the difference between the size of a mold cavity and thesize of the finished part divided by the size of a mold. Usually it is expressedin percentage[5]. Shrinkage was measured using the equations stated inequation (3), where, S shrinkage value, Va actual value, and Ve experimental value[8].229
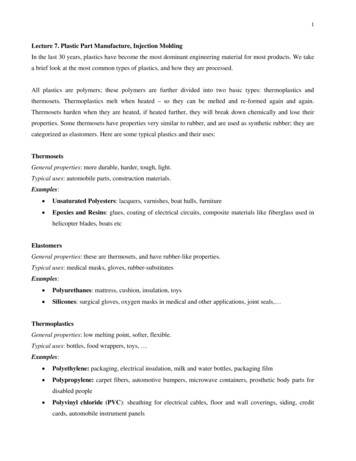
Mathematical Modelling PIM using CCD and RSM(b)(a)Figure 2: (a) Specimen being measured using CMM;(b) Red dots represent the seven measuring pointsto calculate the thickness of the bookmark𝑆 𝑉𝑎 𝑉𝑒𝑉𝑎 100%(3)MATLAB R2016a SetupThe mathematical model was generated using the Model-Based Calibration(MBC) Toolbox by MATLAB R2016a. The model class used was linearmodels and subclass linear model is polynomial. The order specified for thefour input parameters and the interaction order is 2, as only the second orderwas possible with the given data range. In this study, the mathematicalmodelling is generated for both the full and reduced model.Figure 3: Model setup window in MATLAB 2016aResult and DiscussionExperimental ResultThe experiment was conducted according to the selected input parameterswhich are pigmentation (𝑥1 ), barrel temperature (𝑥2 ), barrel pressure (𝑥3 ) andcooling time (𝑥4 ). While, shrinkage (y) acts as the defect achieved whenrunning the process. From the Design of Experiment (DoE), bookmarks were230
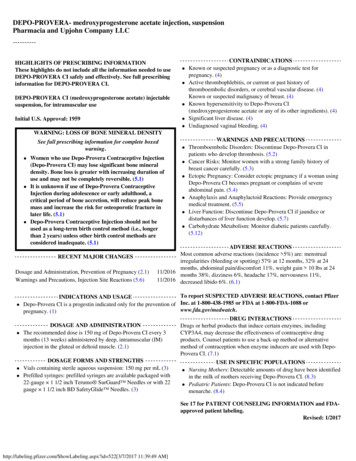
Kausalyah V. et al.produced as the product of the experiment. Below are sample of figuresproduct produced based on the different pigmentation values of 1%, 3%, and5% as well as the other parameters involved.Pigmentation value of 1%;Figure 5b: Bookmark producedof experiment no. 6Figure 5a: Bookmark produced ofexperiment no. 5Pigmentation value of 3%;Figure 6a: Bookmarkproduced of experiment no. 10Figure 6b: Bookmark produced ofexperiment no. 16Pigmentation value of 5%;Figure 7b: Bookmark producedFigure 7a: Bookmark producedof experiment no. 17of experiment no. 25231
Mathematical Modelling PIM using CCD and RSMTable 1: Table of the parameters values and shrinkage values afterexperimentOutput,DefectsInput, 22232425Pigmentation,% (𝒙𝟏 )BarrelTemperature, C (𝒙𝟐 0BarrelPressure,bar (𝒙𝟑 0100909090Coolingtime,sec (𝒙𝟒 e,% .62-5.77-2.90Shrinkage ResultShrinkage was the output parameter obtained by controlling the injectionmolding input parameters. The coordinates of the measuring points were all232
Kausalyah V. et al.recorded and the average value was calculated. The values obtained weresubjected to be subtracted with the radius of the stylus of the CMM machinewhich was 0.75 mm. As shown in Table 1, the shrinkage values are based onthe experimental procedure conducted. The first 25 observations aredisplayed here to show the variation in the response output as the other 12experimental runs are a repetition of experiment no 25 and the shrinkagevalues recorded were approximately similar.Bookmark produced of experiment 2, 17 and 18, the shrinkage valueexceeds up to 27.9%, 48.39%, and 47.92%, respectively, as the specimenswere not formed completely. When taking the measurement of the thicknessof the specimens, there were not enough data to be calculated. Thus, it givesthe result of high percentage of shrinkage occurred. Experiment number 21until 25 gives the shrinkage percentage of negative value. This is due to theoverflow of the material even before the mold is closed. This affected theshrinkage value of the product produced.Table 2: Sample of coded and true values of the experiment together withshrinkage percentageExp.No.12345678910Coded ValueParametersTrue ure ( BarrelTemperature ( 7.676.246.019.526.055.336.013.19Central Composite Design (CCD)Central Composite Design (CCD) was applied in this study with four factors(parameters) at three levels. The levels were selected based on thepreliminary experiments and were coded as -1 (low), 0 (central point), and 1(high). CCD is automatically generated by MATLAB, which resulting a total233
Mathematical Modelling PIM using CCD and RSMnumber of 36 observations for four factors. Sample of coded values wereachieved from CCD sampling method and has been translated into truevalues as recorded in Table 2. The true values were used to generate themathematical models.Mathematical modeling by Response Surface Methodology(RSM)A second-order quadratic function of shrinkage with interaction terms wasobtained, where 𝑋1 , 𝑋2 , 𝑋3 , and 𝑋4 , are the coded variable corresponding tothe pigmentation, barrel temperature, barrel pressure and cooling timerespectively. Two models were generated, the full and reduced model eachhaving 15 and 7 parameters respectively.Equation (4) represents the mathematical model for the full model andequation (5) is for the reduced model using the stepwise backward reductionmethod. The stepwise chosen for this study is the Minimizing Predicted ErrorSum of Squares (PRESS) because it is a good method for working toward aregression model that provides good predictive capability over theexperimental factor space [9].y -1409.35 – 74.4571 𝑋1 0.2230 𝑋2 31.7052 𝑋3 14.9729 𝑋4 10.4276 𝑋12 0.01991 𝑋1 𝑋2 0.0879 𝑋1 𝑋3 – 0.1497𝑋1 𝑋4 0.00076 𝑋22 0.0012 𝑋2 𝑋3 – 0.0027 𝑋2 𝑋4 - 0.1782 𝑋32 – 0.0340𝑋2 𝑋3 – 0.5255 𝑋42 𝜀y -1439.95 – 62.1949 𝑋1 32.9714 𝑋3 11.2396𝑋4 -10.2836 𝑋12 – 0.1840 𝑋32– 0.5486 𝑋42 𝜀(4)(5)where, the boundaries for equation generated above are within the range of𝑋1 [1, 5]; 𝑋2 [200, 300];𝑋3 [80, 100]; and 𝑋4 [5, 15].The stepwise regression technique which is generated by MATLABhas provided a number of methods of selecting the model terms that shouldbe included. This method will take off the unnecessary factors which are notcontributing to the model.[9] Figure 6 shows the parameters interactionstudy, 𝛽 is representing the value of regression coefficients. The value of the234
Kausalyah V. et al.regression coefficients shows to what extent the control parameters affect theresponse quantitatively. The coefficients that are less significant areeliminated along with the responses with which they are associated with inthe reduced model.Figure 8: The significance of pigmentation (𝒙𝟏 ); barrel temperature (𝒙𝟐 );barrel pressure (𝒙𝟑 ); cooling time (𝒙𝟒 ) against shrinkage (y)Figure 8 displays the relationship of each individual parameter studiedto the response which the shrinkage. The parameters which have significantcontribution towards the defect shrinkage is identified. The parameter whichseems to have the main effect is pigmentation (𝑥1 ) with a t value of -12.96,followed by barrel pressure (𝑥3 ) with t value of 5.775, cooling time (𝑥4 ) witht value of 4.4089, and barrel temperature (𝑥2 ) with t value of 0.592. Throughquadratic modeling, the interaction of parameters (𝑥1 𝑥4 ) against shrinkage(y) is also identified with t value of 0.1338.One of the purpose of this research was to study the effect ofpigmentation on the plastic injection molding process. From the resultsobtained, pigmentation does show an influence in the formation of the plasticmolded part.Figure 9: Interactions ofpigmentation (𝒙𝟏 ) and cooling time(𝒙𝟒 ) towards shrinkage (y) forreduced modelFigure 10: Interactions of barreltemperature (𝒙𝟐 ) and cooling time(𝒙𝟒 ) towards shrinkage (y) for fullmodel235
Mathematical Modelling PIM using CCD and RSMThe surface shown in Figure 9 presents a minimum point of theinteraction of pigmentation (𝑥1 ) and cooling time (𝑥4 ) directly towardsshrinkage (y). The graph shows that shrinkage values can be optimum atapproximately 3% of pigmentation and 10secs of cooling time. Figure 10shows the surface interaction plot for barrel temperature (𝑥2 ) and coolingtime (𝑥4 ) towards shrinkage (y) for full the model. Shrinkage is minimal atthe optimum points of approximately 250C temperature and 10secs ofcooling time. The nature of the polynomial curve fit varies for differentinteracting parameters but nevertheless the interest of this experiment is toachieve an optimum shrinkage value which in reality should translate to anideal fill of the mold , leading minimal or no shrinkage occurring.ANOVA of CCD sampling for full and stepwise reduced modelTable 3: Statistical diagnostic (ANOVA) of RSM using CCDStatistical DiagnosticsObservation RunsParametersPRESS RMSERMSER²R² adjPRESS R²Full ModelStepwise 3760.8590.830.712Table 3 is the Analysis of Variance (ANOVA) which presents the statisticaldiagnostics of the Response Surface Methodology (RSM) for this experimentusing CCD for both the full and reduced models. A total 36 observation runswere performed in the study. From the statistical diagnostic values achieved,the full model has a fit of 89.7% and the reduced model has 85.9%. Bothmodels generally indicate good fit, however statistically R2 does notsignificantly predict the goodness of the model for future data addition.Thus, in this case, the PRESS statistics is used to better represent thepredictability of the models generated. The full model has a PRESS R 2 valueof 53.8% and the reduced model has a value of 71.2%. It is shown here thatthe reduced model offers better predictive capability compared to the fullmodel. This is further backed up by the PRESS RMSE statistics where thefull model has a value of 8.732 and the reduced model 6.89. PRESS RMSE236
Kausalyah V. et al.indicates the measure of difference between the values predicted by a modeland the actual values observed. Therefore, the lower PRESS value in thereduced model signifies that the error of prediction is lesser thus increasingthe prediction capability of the model.Conclusion and RecommendationIn the present work, experimental analysis and mathematical modelling ofthe selected process parameters of plastic injection molding has beenreported. Response Surface Methodology (RSM) has been utilized toinvestigate the influence of four input parameters – percentage ofpigmentation, barrel temperature, barrel pressure and cooling time onbookmark as the product made by using materials, Polypropylene (PP).Shrinkage as a defect was studied as the response output. Central CompositeDesign (CCD) was employed to conduct the experiments and to develop acorrelation between the process parameters and output response.The important conclusions that can be drawn from the research workare that the CCD sampling offers itself as a suitable method for predicting theresponse when coupled with RSM. The model’s fitness shown are 89%above for both models analyzed. The reduced model however offers a betterfit in comparison to the full model. It also noted that pigmentation percentageas a notable influence in the outcome of the studied samples of the plasticinjection molded part for the shrinkage defect, though this is not a standardprocess parameter. Nevertheless, its effect on the PIM process must beexhaustively studied. A mild correlation between the x1 and x4 parameters isalso noticed though it’s not of significant impact to the PIM process.For further studies, other process parameters can be included anddifferent defects commonly occurring in PIM process can be experimented tovalidate the effect of pigmentation.References[1][2][3]Sharifah Rafidah Binti Syed Hamid, “A Study On The Effect OfInjection Moulding Process Parameters To The Properties OfInjected Parts.,” No. December, 2010.M. H. Othman, S. Hasan, S. Z. Khamis, M. H. I. Ibrahim, and S. Y.M. Amin, “Optimisation of Injection Moulding Parameter towardsShrinkage and Warpage for Polypropylene-Nanoclay-GigantochloaScortechinii Nanocomposites,” Procedia Eng., vol. 184, pp. 673–680, 2017.S. Chakrabarti, “Effect of Process Parameters on Powdering,” no.237
Mathematical Modelling PIM using CCD and RSM[4][5][6][7][8][9][10][11][12][13][14]April 2014, pp. 179–184, 2012.A. Akbarzadeh and M. Sadeghi, “Parameter Study in PlasticInjection Molding Process using Statistical Methods and IWOAlgorithm,” Int. J. Model. Optim., vol. 1, no. 2, pp. 141–145, 2011.B. Farshi, S. Gheshmi, and E. Miandoabchi, “Optimization ofinjection molding process parameters using sequential simplexalgorithm,” Mater. Des., vol. 32, no. 1, pp. 414–423, 2011.M. Packianather, C. Griffiths, and W. Kadir, “Micro injectionmoulding process parameter tuning,” Procedia CIRP, vol. 33, pp.400–405, 2015.A. Kumar, M. Gaur, D. K. Kasdekar, and S. Agrawal, “Time-BasedOptimization of Injection Moulding Process Using Response SurfaceMethodology,” vol. 2, no. 5, pp. 97–102, 2015.S. K. Lal and H. Vasudevan, “Optimization of Injection MouldingProcess Parameters in the Moulding of Low Density Polyethylene (LDPE ),” Int. J. Eng. Res. Dev., vol. 7, no. 5, pp. 35–39, 2013.M. B. User, “Model-Based Calibration Toolbox For Use withMATLAB and Simulink Model Browser User ’ s Guide,” Response.B. S. Heidari et al., “Simulation of mechanical behavior andoptimization of simulated injection molding process for PLA basedantibacterial composite and nanocomposite bone screws using centralcomposite design,” J. Mech. Behav. Biomed. Mater., vol. 65, pp.160–176, 2017.V. Kausalyah, S. Shasthri, K. A. Abdullah, M. M. Idres, Q. H. Shah,and S. V. Wong, “Optimisation of vehicle front-end geometry foradult and pediatric pedestrian protection,” Int. J. Crashworthiness,vol. 19, no. 2, pp. 153–160, 2014.S. S. B. J. J. Salunke, “Experimental Analysis and Optimization ofProcess Parameters of Plastic Injection Moulding for the MaterialPolypropylene,” vol. 4, no. 5, pp. 1056–1060, 2016.Pala, T.B., Rao, I.J., “Effects Of Small Range Color (Pigment)Concentration Levels On Plastic Injection Molded Parts,” SPEANTEC Conference, Indianapolis, pp. 1583-1586, 2016.V. Kausalyah, S. Shasthri, K. A. Abdullah, M. M. Idres, Q. H. Shah,and S. V Wong, “Vehicle Profile Optimization using CentralComposite Design for Pedestrian Injury Mitigation,” AppliedMathematics and Information Sciences, vol. 204, no. 1, pp. 197–204,2015.238
injection molding (PIM) process are the parameters that affect the process in making the final product. There are so many parameters in this process that must be controlled to ensure that a product is properly manufactured. There are studies showing t