Transcription
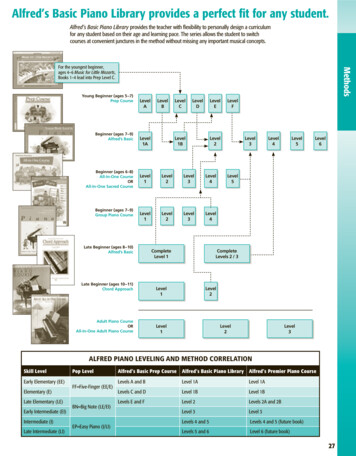
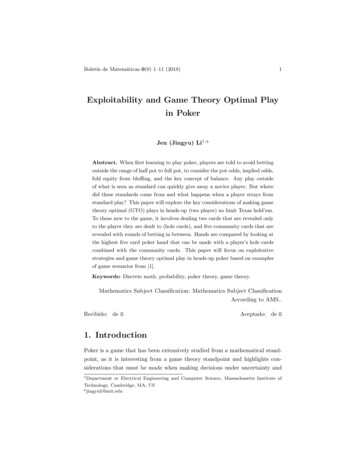
Engineering Letters, 16:1, EL 16 1 21Optimal Level of Automation in the AutomotiveIndustryIgor Gorlach, Oliver Wessel, School of EngineeringNelson Mandela Metropolitan University, Port Elizabeth, South AfricaAbstract. Strong competition on the global automotivemarket is forcing car manufacturers rethink their strategicapproach to manufacturing. In order to be competitive,companies need to manufacture variety of new car models atthe lowest cost. This requires manufacturing systems to beflexible to accommodate product variations and economicallyviable. Automotive industry has been traditionally highlyautomated and not particularly flexible in terms of finalproducts. Despite many developments in the area of flexiblemanufacturing systems, they could not reach their potential,especially in the final car assembly, mainly due to high systemcomplexity, which also results in high costs of automation. Abalanced combination of manual and automated processesincreases flexibility, reduces manufacturing costs, provideshigh quality and throughput. In the view of the above, anoptimal level of automation of manufacturing systems can onlybe obtained if all relevant aspects of the manufacturing processare taken into account and optimum levels in terms of cost,productivity, quality and flexibility are reached as proposed inthe methodology of the Fraunhofer Institute. This approachwas applied for analysis of the final car assembly lines atVolkswagen ines the level of automation of assembly lines.DesignVehicle PlanningPart IVehicleConstructionChoice of locationPart ionMotivationMarketFluctuationChosen locationPart IIIProcessDesigning an Assembly Line(Level of Automation)Figure 1: General procedure for introducing a newvehicleManufacturingINTRODUCTIONToday, the automotive industry is the epitome of massproduction, mass marketing and mass consumption.Production technology becomes more significant due to theever-growing number of suppliers and competitors in themarket. Increasing globalisation causes stronger competitionamong the producing companies. Markets convert fromsales to consumer markets. Hence, an urge for progressiveautomation arose in the past, since it seemed to be the onlystrategy to be competitive. However, a high level ofautomation can lead to less flexible automation systems andthe products are difficult to customise or to extremelycomplex automation systems, which are expensive.According to the studies done by Fraunhofer Institute, 36%of the companies, which have had experiences withautomated solutions, are of the opinion that theyexaggerated automation in the past [1]. Therefore, thechoice of level of automation of a production system is animportant management decision.The Volkswagen AG (VW) procedure for introducing anew vehicle is represented in Fig. 1 showing that plantlocation plays an important role in process planning andpreparation. The choice of plant location depends, amongothers, on the personnel and energy costs, the level ofeducation, skills and motivation of personnel, and themarket conditions. On the other hand, the plant locationThe analysis of the assembly lines of VW at the threeproduction sites was done in order to determine theautomation/de-automation strategies by combining aspectsof manufacturing systems such as costs, productivity,quality and flexibility. The sites studied in this research arethe Golf A5 assembly line at the mother plant in Wolfsburg,the Touran assembly line at the Auto5000 GmbH inWolfsburg and the Golf A5 assembly line in Uitenhage,South Africa. The aim of the analysis is to determineoptimal levels of automation at the three production sites inorder to make recommendations to automate or de-automateparticular sections of the assembly processes.II.THEORETICAL RATIONALA. Strategies and AutomationThe study of Advanced Manufacturing Technologies(AMTs) and its relationship with business strategy receivesmuch scholarly attention. It is widely recognized that AMTsare a major determinant of strategy and vice versa. Anincreasing number of researchers frequently posit thatmaximum benefit will accrue if there is a fit between AMTsemployed by the firm [2]. In pursuing such a strategy, theemphasis is on efficiency and on the rigorous pursuit of costreduction from all possible sources, which is regarded as acost-leadership approach [2]. A low-cost strategy representsattempts by firms to generate a competitive advantage bybecoming the lowest cost producer in an industry [3]. On theother hand, firms can pursue differentiation strategies that(Advance online publication: 19 February 2008)
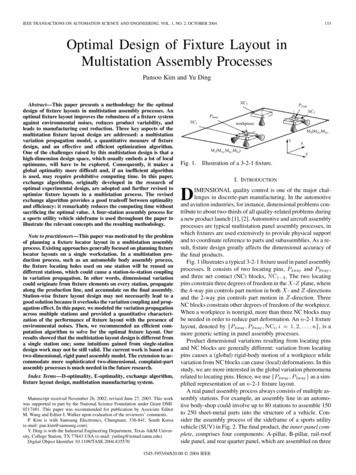
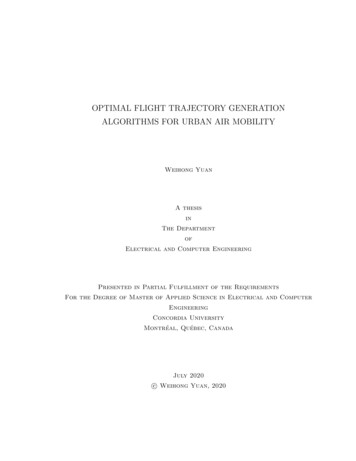
emphasise a chosen form of uniqueness that stems eitherfrom the product, process or service [4]. Differentiationstrategies, in an automotive context, can relate to productdesign, manufacturing, logistics, marketing, IT etc.Typically manufacturing units serving a differentiationstrategy tend to have more complex product lines andseveral discontinuities in the process side to facilitategreater product variety [5]. Hence, flexible manufacturingand assembly is an appropriate differentiation strategy in theautomotive industry.Many authors have argued that under certain industryconditions it is possible for firms to simultaneously pursueboth cost-leadership and differentiation strategiesorientations [6]. The implication is that pursuing a low-coststrategy requires the process side of manufacturing to betightly integrated for effective cost minimisation [2].Therefore, a combination of both strategies is appropriate inthis case as the goals are to design cost efficient carassembly systems and to achieve high productivity,consistent quality and flexibility.In order to compare different manufacturing technologies,based on the methodology proposed by Fraunhofer Institute,the final car assembly processes are classified according tothe level of automation. The level of automation representsthe portion of automated functions of a system in relation tothe complete function of the system [7]. Each level ofautomation is associated with certain costs, which areexplained below.B. Manufacturing CostsIn manufacturing, the total cost per unit versus the levelof automation can be represented graphically as shown inFig. 2 [8]. As can be seen, the personnel costs decreaseproportionally to the growing level of automation. At abeginning, economically justifiable operations areautomated in the first place, therefore the automation costincrease almost linearly. Further on, the expenditureincreases over-proportionally because of the risingcomplexity of the system. Hence, reaching completeautomation causes the automation cost to increaseexponentially while the personnel costs decrease onlylinearly, indicating a higher total cost. For the costscalculations, the relevant cost approach is used, where onlythe costs that make the largest contribution are taken intoaccount [9].The following cost types are necessary for the realisationof the assembly process: Personnel (all carrying out and planning activities in theassembly process; personnel costs consist of wages orrather salary and social costs; they essentially dependon personnel qualification) Operating material (installations for assembly andtransport; operating material costs include all costsfor running the operating material) Material (only consumables are relevant) InformationCost per unitEngineering Letters, 16:1, EL 16 1 21sostal cTotPersn costsAutomatio0%onnel c ostsOptimumLevel of automation100 %Figure 2: Graph of cost versus level of automationC. Quality IndicesQuality is a top priority competition factor that should beintegrated into all the processes of a company. Quality ischaracterised by the index system, which is defined as acompilation of quantitative variables, in which individualindices belong to each other, are supplementary to eachother or explain each other in an objective and practicalway. Thus, all these collected factors are focused on onecommon paramount target. An index is formed by thefollowing elements: character of information, ability toquantify facts, and specific form of information [10]. All theinformation in the index should be adequately defined toavoid ambiguity.For manufacturing and assembly processes, thequality standards are specified by the output qualityindices, which are as follows: The quota of quality defects that does not meet thequality requirements in production immediately, i.e.the ratio of the defects to the whole productionvolume. The indices concerning the number of rejects and therectification of rejects as well as their prevailingshare of the whole production volume that shows thedeveloping trend. The indices with regard to the individual/different typesof defects in their relation to the total number ofdefects in the production. The indices referred to as customer complaints that are anindication of quality defects which have remainedundiscovered in the production process. Audit-Notes, which are determined and assessedseparately as indices by a company.D. Productivity Indices The number of units that are planned to be built, the socalled scheduled number of units. The number of units that have actually been built. Times like the cycle times, manufacturing times,downtimes and total working times. Number of employees involved in the production process.These are set in relation to: The availability of a production system with respect to(Advance online publication: 19 February 2008)
Engineering Letters, 16:1, EL 16 1 21the amount of standstill losses. The decreasing degree of performance with respect toloss of speed. The degree of quality depending on the number of partswhich are produced with defects. The effectiveness of equipment as a whole with respect tothe availability of production, the degree ofperformance and quality. Productivity which refers to the average number ofvehicles built by one employee during a specifiedperiod of time and the number of vehicles built by allemployees per hour.‘Soft’ facts include: Flexibility to manufacture different units. The degree of complexity and its dependence on thedifferent range of vehicle models compared to thebasic model. Flexibility with regard to the possibility of producingmany variations of a product on one line. The different range of vehicle models compared to thebasic model. Flexibility with regard to the possibility of producingmany variations of a product on one line.All the cost, quality and productivity aspects are used fordetermining the best level of automation of the assemblyprocesses at the three production sites as shown in thefollowing section.III.ANALYSES OF THE ASSEMBLY PROCESSES AT VW INGERMANY AND SOUTH AFRICAA. Levels of AutomationThe analysis was done for the final assembly of the GolfA5 and Touran models in Germany and the Golf A5 modelin South Africa. The assembly processes are done at thedifferent level of automation giving a possibility ofcomparing and choosing the best automation strategy for theparticular plant location.The final assembly consists of the three main processescalled Assembly Parts. Each Assembly Part in turn can bedivided into Assembly Operations or Stations. AssemblyPart 1 consists of five Assembly Stations and includes thefollowing: roll forming of a tailgate and doors and a fittingof the cockpit. Assembly Part 2 also consists of fiveAssembly Stations and includes mainly a fitting of thepower train and glasses. Assembly Part 3 includes sevenAssembly Stations, which are typically fitting of trimpanels, a cross member, a bumper, a complete front end,wheels and a battery.To determine the level of automation, the Assembly Partis put in a matrix with Assembly Stations shown in columnsand different manufacturing methods in rows according tothe level of automation from the highest to the lowest (Table1). The starting point of creating the levels of automationbegins at the assembly of the Golf A5 model at Wolfsburgbecause this process is the most automated and therefore itis assigned the first level of automationBy de-automating one station at a time, the level ofautomation decreases. For example, Assembly Part 1 hasfive levels of automation because is consists of fiveAssembly Stations. The same is for Assembly Part 2,whereas Assembly Part 3 has seven levels of automationdue to seven Assembly Stations. The last level ofautomation is the manual assembly, which is the way theGolf A5 model is assembled in Uitenhage. In between, thereis one level of automation that represents how the Touranmodel is assembled in Germany, which is a combination ofthe automated and manual stations.Table 1: Example of the Assembly Part 1 MatrixManufacturingoperationLevel ofautomationLevel of automation 1Golf A5, Germany .Level of automation 5Golf A5, South AfricaRoll formingtailgateAutomatic(1 Robot) .Manual(handrollformingdevice)tM: 1,07 minFitting cockpitlocationbracketsAutomatic(2 facilities) .ManualtM: 2,55 minFor all the stations of the Assembly Parts, the cycle timesand the number of personnel are determined based on theavailable information from the three production methodsand their combinations. The results are matrices withdifferent levels of automation and the number of necessarypersonnel for each station.After establishing the matrices, the basis for the furtheranalysis of each production site is created. Then the separateanalyses of each production site can start.Roll formingdoorsAutomatic(4 Robots) .Cleaning windowflange, tomatic (3Robots) Automatic(3 Robots) ManualtM: 2,81 minManualtM: 2,81 minManual(hand rollformingdevice)tM: 2,4 minB. Manufacturing CostsIf every created level of automation (in the matrices) isprovided with costs, the result will be the representation ofall relevant costs that are differentiated to resourcesdepending on the different levels of automation. By addingup the different costs of all stations, the most economicalsolution and with it, the most economical level ofautomation of each matrix can be examined. The total unit(Advance online publication: 19 February 2008)
Engineering Letters, 16:1, EL 16 1 21cost for each level of automation in each Assembly Part iscalculated for all the plant locations. of one of these tablesis shown in Table 2.Table 2: Example of the data for Assembly Part 1Stations with parameters that are taken from Golf A5 Wolfsburg:StationFitting cockpit locationbracketsCleaning windowflange, closing tailgatePriming window flange,opening bonnetApplying Cockpit glueCockpit fitting 1Cockpit fitting 2Removing Cable box,remaining screwconnectionsRemaining screwconnectionsWorkers in the line(direct)tDW,cDW,min 00QC workerstQC,min0cQC, 0tRW,min1,127cRW, 0,10AuxiliaryworkerstOW,cOWmin ,100,7480,57The calculation for the roll forming tailgate station iscarried out as an example. The total cost consists of thelabour, investment, energy costs and overheads. Thematerial costs are not included because they are consideredthe same for all production sites. All the costs are in /unit.The roll forming tailgate station is an automated station.Hence, no direct labour cost is calculated. For thesupporting staff, the unit cost for the re-workers, CRWj, iscalculated as follows:C RWj t RWj c RW(1)t SH dWwhere: tRWj manufacturing time of re-worker, minCRW annual personnel cost for the prevailing worker, tSH shift duration in min,dW number of working days.The unit cost of auxiliary workers, COWj, is calculatedwith the same formula using auxiliary worker time, tOW andannual cost, cOW:C POWj tOWj cOW(2)t SH dWTo calculate the unit costs for the supervisors, first thenumber of supervisors, nMj, for the chosen station has to becalculated (1 supervisor for 15 workers) as follows:n Mj t DWj t QCj t RWj t OWj15 t CRe-worker(3)where: tDWj, tQCj, tRWj, and tOW are manufacturing times ofdirect, quality control, re-worker and auxiliary workersaccordingly in min,tC cycle time, min.After that the personnel costs per unit for the supervisor,CPMj , can be calculated with the following formula:C PMj n Mj nS c PMn(4)where: nS number of shifts per day,cPM annual personnel cost for master, ,n number of units per day.Before calculating the other personnel costs per unit, it isnecessary to determine the investment (capital) costs perunit, CINVj:C INVj TINVj(5)a nanwhere: TINVj total investment costs, ,a period of depreciation, years.nan annual number of units.Then, the personnel costs for maintenance per unit CPMAi ,can be calculated, which is taken as 50% of the investmentcosts per unit. The planning personnel cost per unit, CPPj , is7% of the investment costs per unit.The personnel cost for industrial engineering per unit,CPIEj, is calculated with the following formula:C PIEj tMj2 d WW c PIE 1 dWa n(6)where: tMj manufacturing time for the prevailingworker, min/unit,dWW number of working days per week,cPIE annual personnel cost for Industrial Engineeringemployee, .The total personnel cost per unit is multiplied by a factor1.11 to include the labour overhead costs.The energy cost per unit, CEj, is calculated asfollows:C Ej PEj C POWn PEj CW tC60(Advance online publication: 19 February 2008)(7)
Engineering Letters, 16:1, EL 16 1 21where: PEj power for station j, kWCPOW energy cost rate for power, /kWCW energy cost rate for work, /kWhThe equipment cost per unit, cEQj, is determined as follows:1 TINVjCEQj TEQWOBn TINVWOB(8)where: TINVWOB total investment costs for all AssemblyParts for Golf A5 Wolfsburg, ,TEQWOB total equipment costs for all Assembly Parts forGolf A5 Wolfsburg, .The additional operating expenses, CEj, are calculated asfollows:C Ej POSj C POWn POSj CW . tC(9)60where: POSj power to produce compressed air, kW,CPOW energy cost rate for power, /kW,CW . energy cost rate for work, /kWhBy adding up all the total unit costs of each AssemblyStation and the total unit cost of the whole Assembly Partfor a specified level of automation are determined for eachproduction site. Due to differences in labour and runningcosts, each production site will have different total costs forthe same Assembly Part. The total costs for the Golf A5model produced in Germany are shown in Table 3 with thepresent level outlined in bold, while the optimal level isshown in bold and shaded.Table 3: Unit costs of the assembly of the Golf A5 modelproduced in GermanyLevel ofAutomation1234567AssemblyPart 1, 1,001,101,201,301,40AssemblyPart 2, 1,201,301,101,001,40AssemblyPart 3, 1,201,101,101,001,301,401,50As can be seen for Assembly Part 1, the first level ofautomation is the optimal level of automation because thislevel has the lowest costs. This level also predominates inpractice. Therefore Assembly Part 1 is designed optimally.The workers and the investment costs cause the highestshare of the total costs per unit. The cockpit fitment is themost expensive station in this Assembly Part. With adecreasing level of automation, the other workers andinvestment costs take a smaller and smaller part but costsfor direct workers in the line increase accordingly. This isthe main reason why even the second level of automation isalready more expensive than the first one. The other types ofcost only take a small part of the total costs per unit.In Assembly Part 2, the fourth level of automation isoptimal. The costs of workers in the line increase, whereas,on the other hand, the costs for all the other workers as wellas investment in equipment do not increase in the same way.Thus, in order to reach the optimal level of automation, thestations stamping vehicle identity numbers, fitting thegearshift, closing the bonnet and fitting all the windowshave to work in the same way as in the assembly line of theAuto5000 GmbH.In Assembly Part 3, the fourth level of automation is alsooptimal. On the first level, the investment costs cause thehighest part of the total costs per unit, followed by thepersonnel costs for maintenance, re-workers and otherworkers. As in Assembly Part 2, the costs for workers in theline increase with decreasing automation, while costs for reworkers, other workers and maintenance decrease until thecost optimum is reached in level 4. After that the costs forworkers in the line increase accordingly, which makes everyfurther de-automation uneconomical. In order to put level 4as an optimal level of automation into practice, the stationsopening the bonnet, putting in and fitting the CW trimpanel, putting in and fitting the battery, fitting the crossmember as well as the rear bumper have to be designed as inthe Auto5000 GmbH. The total costs per unit of theproduction site of the Auto5000 GmbH are shown in Table4.Table 4: Unit costs of the assembly the Touran modelproduced in GermanyLevel ofAutomation1234567AssemblyPart 1, 1,301,201,001,101,40AssemblyPart 2, 1,201,301,101,001,40AssemblyPart 3, 1,301,201,101,001,401,501,60As can be seen, for Assembly Part 1, the third level ofautomation is optimal (marked red). At this level, thehighest costs per unit are the workers on the line, followedby the investment costs. But in practice, the actualautomation level is level 4 (dotted fields). To reach theoptimal level, the stations fitting cockpit location bracketsand cockpit fitting 1 and 2 have to be designed fullyautomatically as it is done on the Golf A5 model assemblyline.In Assembly Part 2, the fourth level of automation is theoptimal level. This level also predominates in practice.Therefore, Assembly Part 2 is designed optimally. The mostexpensive station of this Assembly Part is fitting thecomplete power train combined with all under bodywork.In Assembly Part 3, the fourth level of automation alsorepresents the optimum but in practice level 6 predominates,which again requires a higher level of automation in theassembly line of the Touran model at the Auto5000 GmbH.On level 6, the fitting of the front end is the most expensivestation because of the high personnel costs for workers inthe line. The second most expensive station is the premounting and fitting of wheels. Both of the stations havehigh investment costs as well. Therefore, both of thesestations and the station placing the spare wheel in the boothave to work fully automatically as it is done in the Golf A5model assembly line at the same location.For the Golf A5 model produced in South Africa (Table5), most of the manual levels of automation reach the(Advance online publication: 19 February 2008)
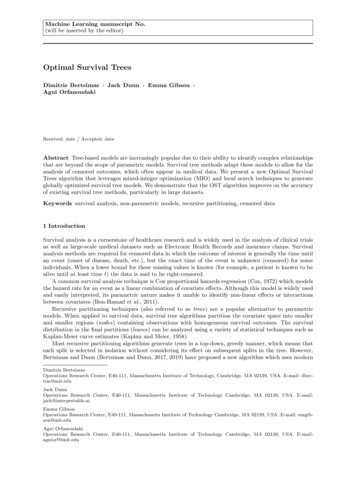
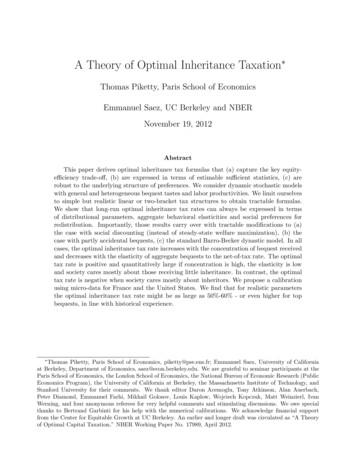
Engineering Letters, 16:1, EL 16 1 21optimal level, and this is also done in practice at themoment. Therefore, in this step of the analysis, no changesof stations or other operations are necessary.Table 5: Unit costs of the assembly of the Golf A5 modelproduced in South AfricaLevel ofAutomation1234567AssemblyPart 1, 1,401,301,201,101,00AssemblyPart 2, 1,401,301,201,101,00AssemblyPart 3, 1,601,501,301,201,101,401,00In Assembly Part 1, the most expensive station is fittingthe cockpit. It takes nearly half of the total costs per unit. InAssembly Part 2, fitting the power train combined with thewhole under bodywork takes the highest costs per unit,which is even more than the half of all total costs per unit.In Assembly Part 3, pre-mounting and fitting wheels showthe highest part of the total cost. It is possible that the costscan be reduced further by reducing the level of automationat the production site in South Africa. However, there are nodata available about manufacturing times and costs forfacilities with even less automation. Also, further deautomation could lead to lower quality.C. QualityThe quality indices for the three production sites are putin one table as shown in Table 6. These include Field data,Audit data of vehicle and process, Vehicle PreparationCentre (VPC) data and Direct Runner Rates (DRR). Fielddata show the quality of vehicles from a customer’s point ofview with the recordings of trouble cases per vehicle.Vehicle auditing is an element of the Quality AssuranceSystem, which judges the effectiveness of the QualityManagement System on the basis of quality delivered in asnapshot. The Vehicle Preparation Centre, located in Japan,records defects in vehicles delivered from Wolfsburg andUitenhage in a 100% control. DRR is an index by whicheach plant is measured and it indicates the percentage ofvehicles, which pass the quality check after the assemblyprocess (CP7) and at the final checkpoint (CP8) after thewater and road tests. The effectiveness of the QualityManagement Systems is judged by the Process Auditsexpressed as a percentage.Table 6: Quality indicesAssemblyPart 10,01345AssemblyPart 20,02796AssemblyPart 30,00465FieldData(Troublecases /8992Trouble cases per unitPlantMain Plant inWolfsburgAuto5000 inWolfsburgPlant in SouthAfricaThe next step is the investigation into finding the optimallevel of automation regarding quality. All other qualityfactors can only be concluded from these results, becausethe data are assigned to the whole examined assembly area.All the above quality indices values are assessed as follows: The ranking of all values in comparison to each other(best, second best and worst) is done. Allocation of points to each status:The best gets 3 points, the second best gets 2 pointsand the worst gets 1 point. Attach importance to each value:The most convincing values are the assembly TroubleCases (TC); they get the highest weight and aremultiplied by the factor 3.All the other values go down in assessment in singleweight. Total sum of all points: The best existing level ofautomation has the most points.The results of the analysis showed that the Auto5000Wolfsburg manufactures best according to all the qualityindices. The second part of the task is to find the theoreticaloptimal automation. Therefore each Assembly Part, whichdelivers the fewest trouble cases per vehicle, is sAudit,%80(90)VPCData(Troublecases perunit)2,4458/6294These collected data are summarized in one theoreticaloptimal level of automation.Number of vehicles per employee80007148600040294000120020000VW MainPlantAuto5000VW SouthAfricaFigure 3: Annual vehicle quantities per employeeD. Productivity and FlexibilityOn the basis of the above described matrices, theproductivity figures are examined in relation to the numberof workers. These workers are later seen in relation to thevehicles built and the time needed for that. These relationsare the indices of productivity taken into consideration inthis analysis. The result of this analysis confirms that a(Advance online publication: 19 February 2008)
Engineering Letters, 16:1, EL 16 1 21highly automated way of manufacturing is also highlyproductive when taking into account that the smallestnumber of employees produces the highest number ofvehicles as can be seen from the comparison shown inFigure 3. On the other hand, the calculation of effectivenessshows that the availability of the high-automated productionis susceptible to faults and trouble cases because of itscomplexity. On account of this, a high number of faultlessunits can be reached, besides other methods, when producedat a lower automated level, which includes the integration ofhighly skilled employees.Flexibility of production equipment is too difficult toquantify in financial terms. Also product variations can notbe considered in this case since the automotive productionequipment is specifically designed for a range of vehiclemodels. Nevertheless, the production equipment shouldhave a sufficient capacity to accommodate a limitedincrease in production quantities. Therefore, in determiningthe levels of flexibility of Assembly Parts, the focus is ontwo aspects: variations of production quantities and; a number of workers required.From this point of view, the most flexible is theproduction system that has to change the least to cope withthe increase/decrease of production quantities, i.e. aminimum variation in the number of workers. The results ofthe analysis for a 20% variation of production quantitiesare shown in Table 7. The bold and shaded fields show themost flexible production system with little or no variation inthe number of workers, while the underlined fields representthe least flexible production systems with a large variationin the number of workers needed to accommodate differentproduction quantities. From these data, the optimal levels ofautomation are chosen with regard to flexibility. As can beseen in Table 7, more than one optimal level of automationexists for all the assembly processes except for AssemblyPart 1 at the VW main plant.Table 7: Optimal Levels of automation with regard to productivity and flexibilityLevelUnits-20%Actual 20%LevelUnits-20%Actual 20%LevelUnits-20%Actual 20%IV.Golf A5 WolfsburgNumber of workersAssembly Part 1Assembly Part 22345 1 2345 118910101113141418191925123891010111214552Assembly Part 33 4 5676666888810888131314151718182023419 7 10 10 9 3422 8 10 11 12 4228 9 12 14 14 48Auto 5000 Wolfsburg5 1 945666688888888121314151718182023510 10 910 10 1011 11 11Golf A5 SA1 SULTS AND DISCUSSIONThe levels of automation of the assembly processes withregard to the three main aspects such as costs, quality andquantity are compared to obtain the optimal levels for eachproduction site. If the different optima correspond with eachother, the total optimum for the individual Assembly Part isalready found. Otherwise, if the optima show differences ina certain Assembly Part, a further examination ha
To determine the level of automation, the Assembly Part is put in a matrix with Assembly Stations shown in columns and different manufacturing methods in rows according to the level of automation from the highest to the lowest (Table 1). The starting point of creating the levels of automation begins at the