Transcription
This publication was supported by the National Sea Grant College Program of the U.S. Departmentof Commerce’s National Oceanic and Atmospheric Administration (NOAA) under NOAA Grant No. 16RG-2195; and by the U.S. Department of Agriculture’s Risk Management Agency through its Targeted Commodity Partnerships for Risk Management Education Program, USDA Agreement Number02-1E0831-0105, with assistance from the Institute of Food and Agricultural Sciences at the University of Florida. The views expressed are those of the authors and do not necessarily reflect theviews of these organizations.Additional copies are available by contacting:Florida Sea GrantUniversity of FloridaPO Box 110409Gainesville, FL, 32611-0409(352) 392-2801www.flseagrant.orgCover photo: Eric Zamora, UF/IFASTP 141January 2005
Organizational Structures and StrategiesFor the Hard Clam Aquaculture Industry in FloridaAmanda M. RuthAgricultural Education and Communication DepartmentUniversity of FloridaGainesvilleLeslie N. SturmerShellfish Aquaculture Extension ProgramCooperative Extension ServiceUniversity of FloridaCedar KeyCharles M. AdamsFlorida Sea Grant ProgramFood and Resource Economics DepartmentUniversity of FloridaGainesvilleSubmitted to U.S. Department of AgricultureRisk Management AgencyTargeted Commodity Partnerships for Risk Management Education ProgramReport on Project 02-1E0831-0105
ContentsExecutive Summary .1Introduction.2Purpose.3Methodology .4Results.4Suggestions .16References.22Appendices.23Appendix A: Survey Instrument .24Appendix B: Survey Responses.27Appendix C: Phone Interviews .43Appendix D: Additional Information.46Nonprofit organization.46Business cooperative.49Marketing order .51Checkoff program .54ii
Executive SummaryThe commercial hard clam culture industry in Florida is an unqualified success story.There are currently more than 400 shellfish growers who farm high-density, submergedleases totaling over 1,700 acres. More than 140 million clams were produced in Floridaduring 2001. This production had a farm-gate value in excess of 15 million, whichrepresents a 34-fold increase in farm-gate sales in 14 years. There are also 14 hatcheries and90 land-based nurseries and other businesses that provide input to the growout sector of theindustry. As a result, the industry represents an important source of economic activity, jobs,and tax revenue to several coastal communities in Florida. To continue this growth, theindustry may have a need for better organization on a statewide basis. Such statewideorganization can be beneficial in regards to regional and national marketing and promotion,research and education on industry-wide problems, and more comprehensive politicalvisibility and lobbying efforts.This study provides guidance on statewide organization for the commercial hard clamculture industry in Florida. The study characterizes the structure of and identifies strategiesfor successful agricultural and aquacultural organizations designed to provide the resourcesneeded to solve current and projected industry problems. Objectives were to 1) characterizethe structure of successful and relevant organizations, 2) identify successful revenuegenerating strategies, 3) provide the hard clam culture industry with options to help facilitatetheir organizational decisions, and 4) assist clam growers in Florida in developing anumbrella organizational strategy that will meet their future industry needs.A mail survey of 23 questions was sent to directors and presidents of 85 agriculturaland aquacultural organizations in Florida and across the US. The Dillman tailored designmethod was used. Follow-up phone interviews were conducted to gather more detailedinformation from selected survey respondents. The response rate was 35.2 percent.Of the respondents, 89.3 percent were nonprofit trade, 7.1 percent were a cooperative,and 4.6 percent were a state agency. Most respondents used a voluntary method of generatingrevenue. Approximately half used a fixed dues rate, while 39.3 percent used a productionassessment. About 11 percent used a mandatory program, with 7.1 and 3.5 percent using acheckoff and marketing order, respectively. With regard to internal organizational structure,the majority (66.7 percent) used an elected board of directors, 10 percent used an appointedboard, and 10 percent used elected/appointed boards. The average board size was 14members, with the size ranging from 5 to 38 members. Eighty percent of the respondentsused paid administrative staff. Most respondents used open membership, 57 percent havingmembership from other states and other commodities. Membership sizes ranged from 17 to9,000 members, with membership rosters representing from 10 to 93 percent of the industryvolume/value. The study also identified numerous other successful organizational strategiesfor services offered, recruitment techniques, considerations for initial organization, successmeasurement, organizational roadblocks, and recommendations.1
IntroductionThe culture of the hard clams, Mercenaria mercenaria, represents a relatively newagricultural commodity in Florida and the fastest growing segment of the aquacultureindustry in the state. The hard clam culture industry has a short history extending back just20 years in Florida. Attempts to culture hard clams originated in the Indian River along theeast central coast during the late 1970s as a means to create an alternative supply source tofluctuating wild stocks. The development of the industry on the Gulf coast of Florida beganin the early 1990s, primarily through job retraining program efforts designed for displacedworkers in the commercial fishing industry. Over 300 underemployed oyster harvesters andnet fishermen were trained and placed into small-scale business enterprises. Thesetechnology transfer programs were comprehensive enough in scope to have launched a newindustry for Florida’s Gulf coast.Currently in the state, about 400 shellfish growers farm over 1,700 acres of stateowned submerged lands in near-shore coastal waters. There are three regions in the statewhere clam farming prevails – Indian River and Mosquito Lagoons (Indian River, Brevardand Volusia Counties), southwest Florida (Charlotte and Lee Counties), and the Cedar Keyarea (Levy and Dixie Counties). Production of hard clams has fast become established inareas where neither aquaculture nor a traditional fishery existed. This is reflected in theaquaculture surveys conducted biannually by the Florida Agricultural Statistics Service. Thefirst survey report in 1987 identified 13 growers and sales of 2.3 million clams valued at 431,000 (USDA, 1988). Over 140 million clams were produced statewide in 2001 (USDA,2002). Farm gate sales rose to 15 million that year, representing a 34-fold increase overprior survey results 14 years ago. This phenomenal production of clams is attributed not onlyto the success of retraining programs but also to the high natural productivity of subtropicalwaters allowing for almost year-round growth.In addition to the number of growout businesses supported by this industry, there arenow over 14 hatcheries and 90 land-based nurseries located throughout the state. Theseoperations provide “seed” clams for growers. In 2001, 30 producers sold 478 million clamseed with total sales of 3.3 million (USDA, 2002). Other spin-off businesses includeseamstresses making clam bags, boat builders specializing in clam work skiffs, andmanufacturers producing harvesting and processing equipment. About 55 certified shellfishwholesalers in the state purchase clams from growers, add value, and distribute product tomarkets throughout the nation. The industry also provides local employment. For example,seafood retail and restaurant establishments are supported through sales of clams tocustomers. Thus, this industry represents a sizable contribution to the economy of Florida. Arecent analysis assessed the economic impact to be 34 million (Philippakos et al., 2001).Not only has clam farming provided an important source of income to former Floridafisherman, it has also provided a major economic boost to rural coastal communities in thestate.The emergent hard clam aquaculture industry in Florida is a dramatic success story.However, to continue its growth, the industry must increase yield and profitability whileproducing a safe, consistent, and high quality crop. Like land-based agriculture, the clam2
industry faces challenges and threats that limit yield, efficiency, and profitability. Thesecannot be met successfully on an individual basis, but must be faced through a unifiedindustry approach.PurposeCurrently, the hard clam aquaculture industry in Florida is not a unified industry interms of having an organization to represent the entire industry at the state and federal levels.Many commodity groups in the state, for example the strawberry growers and the tropicalfish farmers, have effective organizations that provide support to their industry throughmarketing and promotion, research and education, and lobbying. In Florida, where clamfarming has become a multi-million dollar industry, an infrastructure is being sought tosupport the number of growout and ancillary businesses. An appropriate organizationalstructure would allow growers to become supportive of each other and help to ensure agreater chance of success in the sustainability of the Florida hard clam aquaculture industry.Within the agricultural community, safety in numbers has become truth. Manyagricultural industries have established trade or marketing associations to promote theirinterests and provide a unified voice to consumers, legislators, and the general public. Asmentioned, there are various types of organizational structures that represent the individualcommodities in Florida. Nonprofit versus for-profit, trade versus marketing, associationversus cooperative, and marketing order versus a checkoff program are just a few of thealternatives an organization must choose from when establishing a unified voice to representthe hard clam aquaculture industry in Florida.The purpose of this study was to characterize the structure and identify strategies ofsuccessful agricultural and aquaculture organizations that provide the resources needed tosolve industry problems. The information gathered from this study provides suggestions andoptions for organizational development within the hard clam aquaculture industry.The study objectives were:1. To characterize the structures of successful and relevant agricultural andaquaculture organizations in both Florida and the United States.2. To identify the revenue generating strategies that provide the resources necessaryfor the organization to succeed in meeting industry needs.3. To provide the clam farming community with options to facilitate their decisionmaking process for establishing an organization that would represent theirindustry.4. To provide insight for clam growers in Florida in developing an umbrellaorganization and adopting an effective organizational strategy that will meet theirindustry needs.3
MethodologyMail survey research techniques were utilized in this study. The researchers chose apurposive sample of agricultural and aquaculture commodity organizations from lists ofexisting organizations, both in Florida and across the nation. These lists were published bythe Florida Department of Agriculture and Consumer Services Website (www.flag.com/AgGroups/index/htm) and the Aquaculture Magazine Buyer’s Guide and IndustryDirectory (2002). The sample consisted of 85 organizations on both state and national levels.The response rate was 35.2 percent (N 30).A 23-item descriptive survey (Appendix A) was utilized to gather essentialinformation from organizational representatives ranging from executive directors topresidents. The survey instrument was reviewed by a panel of experts, which consisted ofuniversity faculty, agricultural practitioners, and Florida clam farmers, to establish face andcontent validity. The mailed survey was conducted using components from Dillman’stailored design method (Dillman, 2000). The survey primarily consisted of open-endedquestions to gather qualitative information, which were analyzed for common themes. Therewere also seven quantitative questions included in the survey, which were analyzed forpercentages and means. The responses (Appendix B) to the open-ended questions wereanalyzed using Glaser’s constant comparative technique and the quantitative questions usingSPSS (Glaser, 1978).After responses were analyzed, a follow-up phone interview was conducted to gatherin-depth information from those organizations that provided extremely valuable information.Upon completion of the data collection phase, the researchers chose to focus upon severalorganizations that provided data most relevant to the current situation of the Florida hardclam farmers. The information provided by these organizations is highlighted throughout thisreport.ResultsRespondentsThe responses presented in this section were gathered from 30 commodityorganizations, located primarily in the state of Florida. However, some of the respondingorganizations were from other states, with two of the respondents representing theaquaculture industry in Canada. Over 53 percent (n 16) of the responding organizationsrepresent the aquaculture industry. The remaining 46.6 percent (n 14) of the respondingorganizations represent other agricultural commodities like tropical fruits, dairy, vegetables,citrus, fruits, and poultry. The respondents were either members from the board of directorsor executive directors of the organizations.StructuresVarious organizational structures were represented by the responding organizations.Nonprofit trade organizations were the common organizational structures that represented a4
majority, 89.3 percent (n 25), of the organizations within the sample. However, thosenonprofit organizations fell under several different Internal Revenue Services (IRS) taxclassifications, which included 501c(3) classification, 501c(5) classification, and 501c(6)classification. Two of the responding organizations were structured under a cooperative, andone was a state agency. Organizational structures represented in the sample are displayed inTable 1 below. Descriptions of these alternative structures follow, along with explanations ofthe situations in which they are best suited.Table 1. Percentage of organizations representing each organizational structure (N 28*)StructureNonprofit tradeCooperativeState AgencyPercentage89.3%7.1%4.6%Number (n)2521* Only 28 respondents to this question.Nonprofit Trade AssociationAn agricultural organization is most commonly a nonprofit association, which existsto provide a particular service to both its members and the community. Nonprofit refers to atype of organization, which is organized under rules that forbid the distribution of profits toowners or members. Nonprofits provide essential services that government and businesscannot provide. This type of organization is mission-focused and receives funding fromfoundation grants, individual donations, government grants, and fees for services or products.Nonprofits abide by different structures and employ professionals and volunteers whoseskills are specific to the nature of nonprofits. Most nonprofits are defined by their type of taxexemption status under section 501c of the Internal Revenue Service (IRS). There are over25 classifications for nonprofits. However, three of the most common types representedwithin the sample are described below. 501c(3) classification - This classification includes both charities and privatefoundations that are exempt under the tax code. Charities are the most numerousand best known type of nonprofit. Under this classification, exemption status isgiven to those organizations that 1) serve charitable, religious, scientific oreducational purposes, and 2) ensure that no part of the income generated by theorganization goes to the benefit of any one person.o Advantages include: contributions are deductible by the donor, favorable postal rates, exemption from Federal Unemployment Tax, state sales tax and other local tax exemptions are possible andallowable under state law, foundations often require 501c(3) status before issuing grants, and exemption from FICA tax election is available to clergy.o Disadvantages include: insubstantial amounts can be spent on lobbying to influencelegislation,5
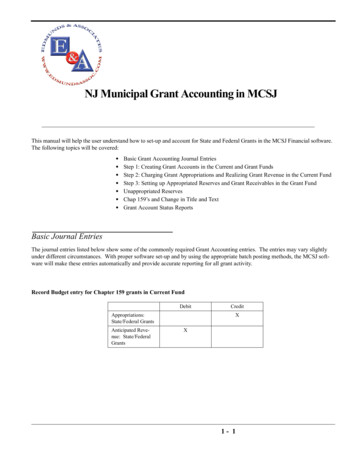
prohibition from lobbying in election campaigns, and earnings cannot accrue to individuals.For private foundations under this classification, a single source of funding isused and commonly comes from individuals, families or businesses that want tomake investments or award grants to nonprofits. Foundations must pay a one totwo percent exercise tax on interest and dividends on investments. Otherdisadvantages of the private foundation include: more reporting requirements onForm 990PF, limits on deductions for charitable contributor, and IRS-imposedoperating restrictions. 501c(5) classification - Usually labor, agricultural, horticultural, and unionorganizations fall under this classification.o Advantages include: no restrictions on lobbying activities, and participation in political activities, which is not available to501c(3) organizations.o Disadvantages include: charitable contributions are not deductible by donors, no exemptions are available for FUTA, FICA, or state and localtaxes, earnings cannot accrue to individuals, and postal rates are less favorable. 501c(6) classification - Organizations that fall under this classification are tradeassociations, professional associations, chambers of commerce, boards of trade,and real estate boards.o Advantages include: no restrictions in lobbying or political activities, and contributions may be tax deductible as business expense.o Disadvantages include: charitable contributions are not deductible by the donors, no exemptions for FUTA, FICA, or state/local taxes, and less favorable postal rates.Respondents indicated choosing these organizational alternatives for reasons such asbeing best suited to handle the organization’s objectives and the IRS tax code regulations.There are several other classifications that include organizations like social clubs, veteransclubs, social welfare organizations, and associations of employees for charitable purposes.However, organizations under these classifications were not included in the sample and arenot likely to be an option for clam farmers.CooperativeThis type of organizational structure is an enterprise or organization that is owned andoperated for the benefit of those using the services. Most commonly in agriculture, acooperative is owned and used by farmers mainly to handle the off-farm part of their6
businesses buying farm supplies, marketing their products, furnishing utilities, andproviding business services at cost. This type of organization is utilized when producers aretrying to create their own value-added business enterprises. Characterizing features of acooperative include: democratic control, limited return on capital, and operation at cost, with distribution of financial benefits to individuals inproportion to their use of the services made available by the cooperative.State AgencyA state agency is an executive agency of state government. This type of organizationis most commonly established under an act of legislation as a result of an industry or publicrequest. The agency in each state or territory designated under state law is responsible for thefair and equitable distribution within the state of all donations of surplus property to publicagencies to be used for one or more public purposes, such as conservation, economicdevelopment, education, parks and recreation, public health, public safety, and programs forolder individuals. State agencies also carryout nonprofit tax-exempt activities for educationand public health purposes, including research for any such purposes.Revenue Generating StrategiesOne of the motivations behind this research was a need to identify different strategiesthat organizations may use to generate revenues. Commonly, successful revenue strategiesdetermine the difference between success and failure in nonprofit organizations. Thus,responding organizations were asked to identify any revenue generating activities used tofinancially support their organizations. The majority of the organizations implement avoluntary dues structure. However, there were also organizations that used a mandatorystructure. The following information on membership dues is presented within these twocategories.7
Membership DuesMembership dues were the primary source of revenue for the majority of respondingorganizations, and the only source of revenue for two of the 30 organizations. However, theuse of a single source for funding was cited as a problem for those two organizations. Therewere various types of membership dues, which ranged from flat fees to production-basedassessments to acreage-based assessments1 and even checkoff programs and marketingorders. Table 2 displays the different structures of membership dues represented by thesample.Table 2. Percentage of responding organizations under each dues structure (N 28*)Dues StructurePercentageNumber (n)Voluntary:Fixed Rate50%14Assessment Based517.9%¾ Fixed categories621.4%¾ Pure assessmentMandatory:Checkoff Program7.1%2Marketing Order3.5%1* Only 28 respondents to this question.VoluntaryOne half (n 14), of the responding organizations has a fixed rate dues structure.Fixed rate dues ranged from 10 to 250 a year, with the average falling at approximately 100. Most of the organizations that utilized a fixed rate dues structure categorized the feeaccording to the membership category in which the individual belonged. For example, therewere several organizations which had active membership dues and associate membershipdues. Active members usually included individuals that were directly involved in theindustry, like growers, handlers, and processors. Associate members were typically anyoneinterested in the industry, which sometimes included university faculty, industrypractitioners, and students. In most, but not all cases, the associate member dues were at alower fixed rate than the active member dues. There were also a few organizations that useda one-time initiation fee along with an annual fixed fee.Several, 17.8 percent (n 5), of the organizations implemented a dues structure that isassessment based but has fixed rate categories that members fit into based on their businesscharacteristics. For example, a few organizations have levels of membership that are basedon acreage. The amount of the membership dues depends on the amount of acreage that themember farms. In most cases, this type of structure had a cap on the amount of dues paid. Anexample of this type of structure would be a 2.00/acre fee with a minimum of 100 paymentand a maximum of 2000 payment for the active member on a yearly basis. In most caseslike this, the associate member pays a fixed rate of approximately 100.1Assessment is defined as a tax that is imposed at a specified (pre-determined) rate.8
There were also organizations that based their membership dues purely on anassessment. These mostly included assessments on production, assessments on total sales,and tax assessments on production. Over 21 percent (n 6) of the responding organizations,utilized this type of dues structure. This type of dues structure depends primarily on theamount of product produced or sold by the active members. For example, one organizationcharges growers two cents per flat of product moved into the market and handlers match thattwo cents on every flat they receive. Dues based assessment structures are more elaboratethan the two previous listed structures. However, most of the responding organizations thatutilized this structure implement this system on an honor basis. Honor basis meaning thatmembers are relied upon to accurately report their production rates or sales to theorganization, which is most commonly on a monthly basis for production based assessmentsand annually for sales based assessments.MandatoryThere are two other types of membership dues utilized by the respondingorganizations. Rather than a dues structure, both of these are federally mandated programsthat act as a method to charge individuals for their membership to the organization. The firstof these mandatory dues arrangements is a checkoff program. Two of the respondingorganizations implement a checkoff program, which is a commodity program for farmproducts that are financed by assessments applied to sales of those products by producers,importers, or others in the industry (US House Committee on Agriculture Glossary). Thedifference between a checkoff and some of the assessments previously mentioned is that it isa federally implemented program made mandatory for the industry. Funds generated from acheckoff program most likely go to promotion, research, and advocacy for the entireindustry.The other program is a marketing order. Only one of the responding organizationsimplements a marketing order, which entails allowing producers to promote orderlymarketing through collectively influencing the supply, demand, or price of a particularcommodity. Once established, a marketing order is binding on all handlers/processors of thecommodity within a certain geographic area of regulation. Marketing orders have been mostcommonly implemented in the dairy, fruit and vegetable industries.The organizations that utilized either of these two mandatory structures mentioned,represented very large industries and strong membership bases. For example, one of theorganizations that implemented a checkoff program is part of a producer cooperative thatfalls under a national umbrella organization. Industry members are required to pay 15 centsper hundred weight of product produced as a source for revenue generation. So while this isan assessment, it is also a mandatory program.Additional Revenue Generating ActivitiesAs previously mentioned, membership dues were the most common source ofrevenue for the responding organizations. However, many of the organizations implement9
unique strategies for generating additional funds to support their organizations. Theseadditional activities make up a substantial amount of revenue for the participatingorganizations. For example, one organization places a production unit tax on their productthat goes directly to accomplishing the organization’s objectives. Another organizationimplements a commission on box sales, and another implements a voluntary levy on productsold for processing. Several other organizations sell insurance to their members; while othersuse newsletter advertising as a major source of income. Additional methods of generatingrevenue are included in Table 3.Table 3. List of Revenue Generating ActivitiesActivity¾ Production tax¾ Sales tax¾ Levy on processed products¾ Insurance¾ Newsletter¾ Grants¾ Conferences/Conventions¾ Meetings¾ Sponsorships¾ Educational programs¾ Promotional paraphernaliaOne general finding from this study was that even though the majority of theserevenue generating strategies were not mandatory, member compliance was high, usuallyabove 75 percent compliance. This finding proves that member participation does not have tobe mandatory in order to have compliance rates that produce results.Inter-Organizational StructureBoard of DirectorsIt is essential for any organization, especially nonprofit organizations, to have a boardof directors. This is in essence the core of the organization, the “decision makers”. Thisgroup of leaders varies in size from organization to organization depending on theresponsibilities that need to be filled in order for the group to survive. The respondingorganizations in this study indicated a board of directors that ranged in size from 5 to 38board members, with the average size being 14 board members. The majority, 66.7 percent(n 20), of the boards represented in this study were elected, 10 percent (n 3), wereappointed, and 10 percent (n 3) were mixed boards. One respondent indicated its board wasformed on a volunteer basis.The three organizations that had both elected and appointed positions on the boarddid so for various reasons, one major reason being that appointe
commodities in Florida. Nonprofit versus for-profit, trade versus marketing, association versus cooperative, and marketing order versus a checkoff program are just a few of the alternatives an organization must choose from when establishing a unified voice to