Transcription
Lumen Managed Firewalls Security Solutions portal (powered by Lumen)User guide February 2022For Adaptive Network Security, Managed Premises Fortinet Firewalls, MSSCloud, Secure Access
Table of contentsLumen Security Solutions Reporting . 3Support contacts . 3Accessing the Lumen customer portal . 3Viewing and downloading firewall policies . 3Adaptive Network Security and Managed Premises firewall policies . 4Lumen Security Solutions Reporting portal . 5Common filters and customization . 6Rapid Threat Defense (Security Posture) . 6Adding global block or allow rules . 7Dashboards . 8Dashboard displays . 9Firewall Overview Dashboard . 10Firewall Application Control dashboard . 13Firewall DLP dashboard . 15Firewall IDS/IPS dashboard . 17Firewall Mobility dashboard. 19Firewall Site dashboard . 22Firewall Traffic dashboard . 24Firewall Webfilter dashboard. 26Firewall Virus and malware (sandboxing) dashboard . 28Incidents . 31Events . 34Reporting . 35Creating a report . 35Mobility and Site Report Data field definitions . 39Application Control Report Data field definitions . 40DLP Report Data field definitions . 41IDS/IPS Report Data field definitions . 42Traffic Report Data field definitions . 43Virus Report Data field definitions . 44Webfilter Report Data field definitions . 45Appendix A: Event Severity definitions . 46page 2Services not available everywhere. Business customers only. Lumen may change, cancel, or substitute products and services,or vary them by service area at its sole discretion without notice. 2022 Lumen Technologies. All Rights Reserved.
Lumen Security Solutions ReportingThe Lumen Security Solutions Reporting (powered by Lumen) portal provides near real-timedashboard, reports of log events, analysis, threat-visualization, and rapid threat defense (AdaptiveNetwork Security only) for the following Lumen managed firewall security services: Adaptive Network SecurityManaged Premises Firewalls (Fortinet)MSS CloudSecure AccessDetailed firewall policies files are available on the Security Solutions Analytics landing page.Note: To access the Security Solutions Reporting (powered by Lumen) portal andfirewall policies, sign in to Control Center using two-factor authentication.Support contactsPlease see s.html for more information.Accessing the Lumen customer portalLearn how to sign in to Control Center—the Lumen customer portal.Select the second Lumen Security Solutions Reporting (powered by Lumen) link.Viewing and downloading firewall policies1. Sign in to Control Center.2. Click Monitoring, then click Security Solutions Analytics.page 3Services not available everywhere. Business customers only. Lumen may change, cancel, or substitute products and services,or vary them by service area at its sole discretion without notice. 2022 Lumen Technologies. All Rights Reserved.
3. To view and download Adaptive Network Security firewall policies files, scroll down to FirewallPolicies and Configurations Firewall Policies.Adaptive Network Security and Managed Premises firewallpolicies1. The Adaptive Network Security and Managed Premises firewall policies are formatted in a .txtfile in JSON format.2. Download, right-click, and select Open with WordPad to better read the file.3. If you have additional questions regarding Adaptive Network Security firewall policies, pleasesubmit a Security Ticket (Under Other Tools) to review with SOC personnel.page 4Services not available everywhere. Business customers only. Lumen may change, cancel, or substitute products and services,or vary them by service area at its sole discretion without notice. 2022 Lumen Technologies. All Rights Reserved.
Lumen Security Solutions Reporting portalThe Lumen Security Solutions Reporting portal for Managed Firewall set of services includes: Adaptive Network SecurityManaged Premises Firewall (Fortinet)MSS CloudSecure AccessThe Lumen Security Solutions Reporting portal has a common layout and user interface for log eventsand capabilities represented in the Dashboard, Events, Security Posture (to set a security threat scorewith Rapid Threat Defense) on the left menu item tabs: Dashboard—Displays summary view of the set of critical indicators for service features. Usercan download reports based on dashboard.Events—Query capability to search logs based on a user defined set of filtersIncidents—Displays set of interactions with malicious IP sites and domains based on near realtime threat intelligence indicators from Black Lotus Labs. User can view incident details andobtain automated analyst guidance. View enabled with Basic and Premium service levels.view incident details and to and obtain guidance on incidents identified on the Firewall service.Reporting—Enables user to create a report from a dashboard.Security Posture—Enables admin user to identify a security posture to set up automateddeployment of countermeasures whenever new malicious entities are discovered by Black LotusLabs —the Lumen cyber threat intelligence team.Key capabilities with top-right icons areRelease NotesIncidents Assigned to youKnowledge Base and SupportYou will see a blank display and need to select a menu item on the left side.page 5Services not available everywhere. Business customers only. Lumen may change, cancel, or substitute products and services,or vary them by service area at its sole discretion without notice. 2022 Lumen Technologies. All Rights Reserved.
Common filters and customizationCommon controls across the Firewall dashboards are:Date Range—interval for viewing search results. Click the Apply button after selection.Query—field to enable user to filer the data shown in the dashboard based a query they enter.Device—the firewall physical device host name that inspects traffic and enforces securitycompliance policies. Firewall Instance—customer virtual network firewall instance with customer configured policieson a device. Firewall Type—type of firewall, network firewall or premises firewall. Company—name of the customer Wildcard—most filter controls are preset with the * wild card character that match any value, oryou can select a value. See Appendix A that describes the estimated event severity that caused a log event.Rapid Threat Defense (Security Posture)Rapid Threat Defense allows you to automatically detect and respond to threats for Adaptive NetworkSecurity Premium service only.You specify a security posture which has an associated risk score. When malicious entities arediscovered that have a risk score that meets or exceeds the risk score indicated in the security posture,countermeasures will be automatically deployed to block access to that malicious entity.To set security posture with Rapid Threat Defense, Security Posture menu item (left side).Note: You must have an admin role on the Lumen Security Solutions portal to setsecurity posture or set Allow/Block IP v4 Address. If you need admin roleprivilege, submit a security trouble ticket to elevate your privileges to admin role.The selected security posture risk score selections are:page 6Services not available everywhere. Business customers only. Lumen may change, cancel, or substitute products and services,or vary them by service area at its sole discretion without notice. 2022 Lumen Technologies. All Rights Reserved.
Selecting a security posture sets up automated deployment of countermeasures whenever newmalicious entities are discovered by Black Lotus Labs —the Lumen cyber threat intelligence team TheBlack Lotus Labs team has automated the discovery, classification and validation of new maliciousentities to deploy countermeasures typically in under 30 minutes from discovery of the new maliciousentity.Adding global block or allow rulesIn addition to selecting a security posture, customers can also select specific IPv4 address ranges toblock or allow that are independent of security posture.Block or allow list rules on specific IPv4 address ranges remain active, even if the security posture isset to “No Blocking”. These lists always take precedence to override or augment any countermeasuresdeployed by the security posture selection or any other Adaptive Network Security firewall policy if anIPv4 address match occurs. Allow IPv4 CIDR Address Range: Always allow access to this IPv4 CIDR address range, even ifit is identified as malicious and has a risk score that meets or exceeds the risk score associatedwith the selected security posture.Block IPv4 CIDR Address Range: Always block access to the IPv4 CIDR address range in thisentity, unless defined in the Allow list.All IPv4 address countermeasures specified on this page are deployed globally. They apply to allAdaptive Network Security Firewall Instances, all users, all ports, all protocols and all services.If a more specific policy is required, please submit a SOC security ticket (Support Security RepairTickets) where you can specify the following parameters per Adaptive Network Security FirewallInstance:oooooSource Interface (IPVPN is the default)Source address (All is the default)Schedule (e.g., limits hours, Always is the default)Service (e.g., protocol, UDP, FTP, All is the default)UTM Profile Sensors (e.g., WCF, IPS/IDS, Various is the default)page 7Services not available everywhere. Business customers only. Lumen may change, cancel, or substitute products and services,or vary them by service area at its sole discretion without notice. 2022 Lumen Technologies. All Rights Reserved.
DashboardsThe Firewall dashboards are a summary view of critical indicators with Adaptive Network Security,Managed Premises Firewall (Fortinet), MSS Cloud, Secure Access services. You can filter on FirewallType and Firewall Device to determine the product offer: Adaptive Network Security “esg” devices & “network firewall” type.MSS Cloud, Secure Access “nsd” and “esg” devices & “network firewall” type.Managed Premises Firewall (Fortinet) to “GM” devices & “premises firewall” type.Default set of Adaptive Network Security service dashboards are: Firewall Overview Dashboard—displays the summary of important metrics from all features indistinct panels.Firewall Application Control Dashboard—displays actions (pass or block) based onapplication usage. These setting are defined for a specific user, group, or IP address based onsettings identified during service setup. Application Control identifies and enforces applicationuse on the network.Firewall DLP (data loss protection) Dashboard—displays potential data loss attempts to sendsensitive data including credit card and SSN information. DLP monitors, prevents, and reportson attempts to send sensitive data, including credit card and SSN information.Firewall IPS/IDS Dashboard (Intrusion Prevention and Detection Services)—displays intrusionprevention (dropped) and intrusion detection (detected) events over time with view of top sourceIPs and common alerts. IPS/IDS provides management and monitoring, detection andprevention capabilities at your network edge. Traffic matching signatures of known attacksgenerate incident reports and may also be blocked on a per-signature basis.Firewall Mobility Dashboard—displays information of successful and unsuccessful mobilityendpoint client authentication status and top client duration in hours. Mobility access is to aprivate network and/or the public Internet via Lumen internet access or third-party internetaccess.Firewall Site Dashboard—displays traffic and events from remote site access IPSec tunnels toa private network and/or the public Internet via Lumen internet access or third-party internetaccess.Firewall Traffic Dashboard—displays summary of traffic allowed and denied by firewall policy.Reports show how traffic was managed in response to such policies.Firewall Virus and Malware (Sandboxing) Dashboard—displays potential infections based onsignatures and actions taken, analytics (sent to the sandbox for analysis), monitored,passthrough, blocked. Summaries of top IP address, agents, URLs, files, targeted hosts, andmalware are displayed.Firewall Webfilter Dashboard—displays the status of how internet content resources are usedbased on a category, domain, or IP address. These settings are defined for a specific user or IPaddress based on settings identified during service setup. Web filtering classifies and blocksURLs and emails to help protect computers from infection. It controls the use of internetresources based on URL, content, and IP addresses, blocking and inspecting downloadedcontent for malicious code before it reaches a user’s device.page 8Services not available everywhere. Business customers only. Lumen may change, cancel, or substitute products and services,or vary them by service area at its sole discretion without notice. 2022 Lumen Technologies. All Rights Reserved.
Dashboard displays1. For initial set up, select Create New Dashboard.A list of Firewall Dashboard Templates appears.2. Create the appropriate dashboards based on the features you have eanbled on the Firewall service.The minimum common firewall dashboards to create are:o Firewall Overview dashboardo Firewall IDS/IPS dashboardo Firewall Traffic dashboard3. To adjust panel display, you can select the lock/unlock icon to adjust a widget display to fit yourscreen.page 9Services not available everywhere. Business customers only. Lumen may change, cancel, or substitute products and services,or vary them by service area at its sole discretion without notice. 2022 Lumen Technologies. All Rights Reserved.
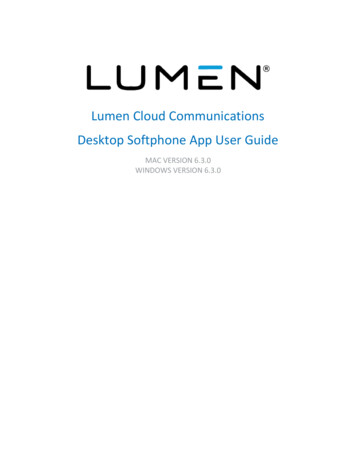
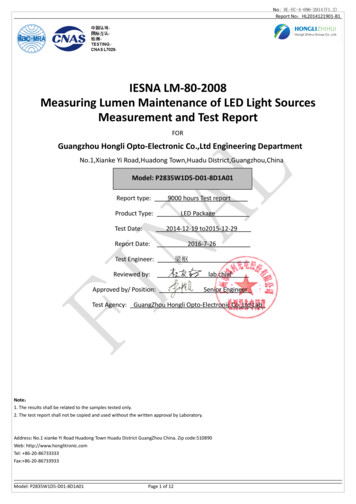
Firewall Overview DashboardThe Firewall Overview Dashboard dynamically combines important metrics from all service features indistinct panels.In full configuration, the following panels appear: DLP Incidents Blocked and DLP Incidents Logged: The number of blocked and logged DLPincidents for the selected date range IDS/IPS Intrusion Detected and IDS/IPS Intrusions Dropped: The number of detected anddropped IPS/IDS incidents for the selected date range. Virus – Warning or Above and Virus – Notice: The number of virus attacks of priority warningor higher for the selected date rand and the number of virus attacks with priority notice.If you have not configured Data Leak/Loss Protection (DLP) or AntiMalware (Virus), these will appearwith a “0” value. Allowed and Denied Traffic by Event Count: A bar chart of the allowed and denied firewalltraffic events for the selected date range. Allowed and Denied Traffic by MB: A bar chart of the allowed and denied firewall traffic byvolume (MB) for the selected date range.page 10Services not available everywhere. Business customers only. Lumen may change, cancel, or substitute products and services,or vary them by service area at its sole discretion without notice. 2022 Lumen Technologies. All Rights Reserved.
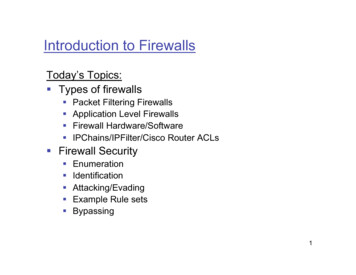
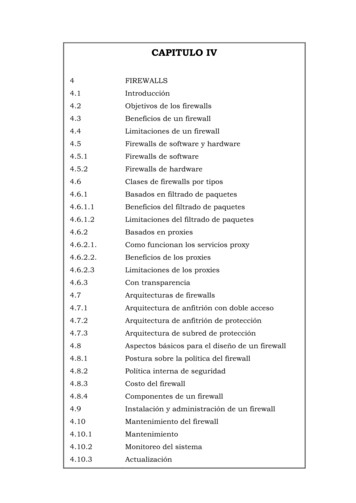
Blocked Web Filter Categories by Event Count: A bar chart of the top 10 blocked web filtercategories and count of the number of attempts to web sites that match the category for theselected date range. Top 10 DLP Incidents by Action: A pie chart showing the type of data detected or block forselected date range. Top Virus Files/Domains: A list of the most frequently detected virus files for the selected daterange.page 11Services not available everywhere. Business customers only. Lumen may change, cancel, or substitute products and services,or vary them by service area at its sole discretion without notice. 2022 Lumen Technologies. All Rights Reserved.
Blocked Applications by Event Count: A bar chart of the top blocked and host combinationsand count of attempts by application that match the category identified in the firewall policy forthe selected date range. Mobile Authentications: A bar charge of the number of failed and successful mobility accessauthentication attempts fort the selected date range.page 12Services not available everywhere. Business customers only. Lumen may change, cancel, or substitute products and services,or vary them by service area at its sole discretion without notice. 2022 Lumen Technologies. All Rights Reserved.
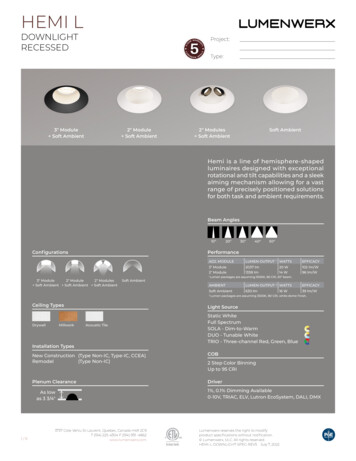
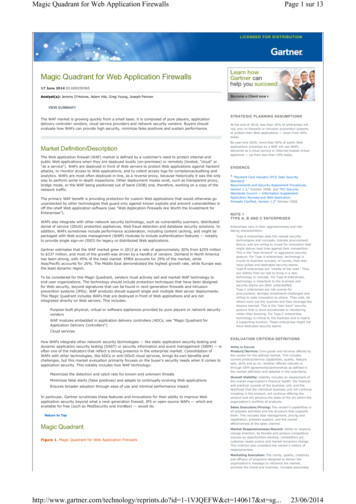
Firewall Application Control dashboardThe Application Control dashboard presents logged events for application-based activities.The following panels appear: Total Requests Blocked: The number of requests blocked for the selected date range.Total Requests Reset: The number of requests where the firewall terminated the connectionwith a reset signal for the selected date rangeActions by Event Count: A bar chart of requests by action (block/pass/reset) for the selecteddate range.Request Applications by Event Count: A bar chart of top 10 applications by the number ofrequests for the selected date range.page 13Services not available everywhere. Business customers only. Lumen may change, cancel, or substitute products and services,or vary them by service area at its sole discretion without notice. 2022 Lumen Technologies. All Rights Reserved.
Blocked Applications by IP and Host: Listing of the top blocked applications by IP and host(source and # requests). Applications by IP and Host: Listing of the top applications by IP and host (source and #requests). Log Summary Data: List of logs by action.page 14Services not available everywhere. Business customers only. Lumen may change, cancel, or substitute products and services,or vary them by service area at its sole discretion without notice. 2022 Lumen Technologies. All Rights Reserved.
Firewall DLP dashboardData Leak/Loss Protection (DLP) monitors, prevents, and reports on attempts to send sensitive dataoutside a customer’s organization.The DLP Dashboard presents a summary of the total number of incidents, requests by action, incidentsby type and action, incidents by service, top senders, and top recipients. The following panels appear: Total Blocked Incidents: The total numbers of blocked DLP incidents.Total Logged Incidents: The total numbers of logged DLP incidents.Top 10 Incidents by Type and Action: A pie chart of incidents by type and status (log-only orblocked) for the selected date range. Service Incidents by Event Count: A bar chart showing incidents by service (http or https) forthe selected date range.page 15Services not available everywhere. Business customers only. Lumen may change, cancel, or substitute products and services,or vary them by service area at its sole discretion without notice. 2022 Lumen Technologies. All Rights Reserved.
Actions by Event Count: A bar chart of incidents by action (blocked/logged) for the selecteddate range. Senders by Event Count: List of top senders of files by source address, source account (userwith active-directory integration), event application protocol (http or https), and count.Recipients by Event Count: List of top recipients by destination address, request domain,event application protocol (http or https), and count. Log Data Summary: List of log data by action.page 16Services not available everywhere. Business customers only. Lumen may change, cancel, or substitute products and services,or vary them by service area at its sole discretion without notice. 2022 Lumen Technologies. All Rights Reserved.
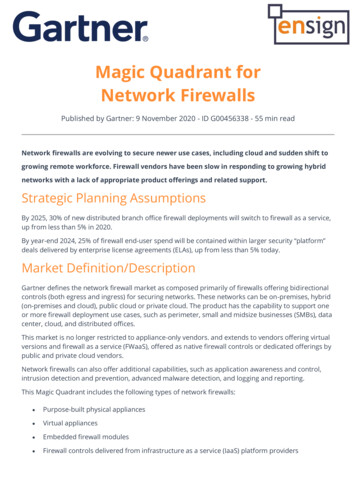
Firewall IDS/IPS dashboardIDS/IPS prevents vulnerability exploits by examining packet content as it passes through the firewallagainst known signatures to detect, report and block intrusive behavior directed by your firewall policy.The IDS/IPS dashboard displays logged alerts for intrusion detection and prevention incidents. Thefollowing panels appear: IDS/IPS Intrusion Detected and IDS/IPS Intrusions Dropped: The number of detected anddropped IPS/IDS incidents for the selected date range.Event Distribution: A bar chart of alerts by status (detected/dropped) for the selected daterange. Source IPs by Event Count: A bar chart of the top 20 IP pairs by number of incidents for theselected date range. Alerts by Event Count: A bar chart of the most common alerts for the selected date range.page 17Services not available everywhere. Business customers only. Lumen may change, cancel, or substitute products and services,or vary them by service area at its sole discretion without notice. 2022 Lumen Technologies. All Rights Reserved.
Log Data Summary: List of log data by action.page 18Services not available everywhere. Business customers only. Lumen may change, cancel, or substitute products and services,or vary them by service area at its sole discretion without notice. 2022 Lumen Technologies. All Rights Reserved.
Firewall Mobility dashboardThe mobility dashboard summarizes mobility client activity, focusing on logins as well as data volumeand session durations. Mobility clients are identified by usernames (with active-directory integration)and geo location (based on remote IP lookup).The following panels appear: Top 10 Clients by MB: A pie bar chart showing the top 10 clients by total number ofauthentication connections made by volume (MB) for the selected date range.Top 10 Clients by Duration: A pie bar chart showing the top 20 clients by total number ofauthentication connections made by duration for the selected date range.Authentications by Event Count: A bar chart with the top 10 clients by number ofauthentication connections made by success and failure for the selected date range.page 19Services not available everywhere. Business customers only. Lumen may change, cancel, or substitute products and services,or vary them by service area at its sole discretion without notice. 2022 Lumen Technologies. All Rights Reserved.
Clients by Successful Authentication Event Count: A bar chart of the top 10 clients bysuccessful authentications for the selected date range. Clients by Failed Authentication Count: A bar chart of the top 10 clients by failedauthentications for the selected date range. Clients by Peak Sustained Throughput in MB: A bar chart of the top clients by the sustainedbi-directional throughput (the sum of the number of bytes sent from active clients) for bothsuccess and failures for the selected date range. Note that throughput is an approximate valuebased on 10 minute volume updates.page 20Services not available everywhere. Business customers only. Lumen may change, cancel, or substitute products and services,or vary them by service area at its sole discretion without notice. 2022 Lumen Technologies. All Rights Reserved.
Summary of Firewall Instances by Event Duration: List event count with total duration byfirewall instance. Log Data Summary: List of log data by action.page 21Services not available everywhere. Business customers only. Lumen may change, cancel, or substitute products and services,or vary them by service area at its sole discretion without notice. 2022 Lumen Technologies. All Rights Reserved.
Firewall Site dashboardThe Firewall Site dashboard summarizes traffic from remote access site encrypted tunnels.The following panels appear: Top 10 Sites by Tunnel Events: A bar chart with the top 10 sites by number of tunnel events(distinct connections) for selected date range.Sites by Tunnel Event Count: A pie chart with the top sites (up to 20 sites) by number oftunnel events (distinct connections) seen for the given IP address.Top 10 Sites by Throughput in MB: A bar chart with the top 10 sites by volume (in MB) forselected date range.Sites by Throughput in MB: A pie chart with the top sites (up to 20 sites) by volume (in MB)seen for the given IP address.Active Sites by Event Count: A bar chart with top sites by the sustained bi-directionalthroughput (the sum of the number of bytes sent from active sites) for the selected date range.Note that throughput is an approximate value based on 10 minute volume updates.page 22Services not available everywhere. Business customers only. Lumen may change, cancel, or substitute products and services,or vary them by service area at its sole discretion without notice. 2022 Lumen Technologies. All Rights Reserved.
Active Sites by Sustained Throughput in MB: A bar chart with top sites by the sustained bidirectional throughput (the sum of the number of bytes sent from active sites) for the selecteddate range. Note that throughput is an approximate value based on 10 minute volumeupdates. Tunnel Up/Down Events: A bar chart with top sites showing tunnel up and down events for theselected date range. Log Data Summary: List of log data by action.page 23Services not available everywhere. Business customers only. Lumen may change, cancel, or substitute products and services,or vary them by service area at its sole discretion without notice. 2022 Lumen Technologies. All Rights Reserved.
Firewall Traffic dashboardThe Firewall traffic dashboard summarizes traffic traversing users firewall via multiple graphics. Trafficdata is shown by the number of logged events (traffic flows) and by volume (by MB).The following panels appear: TCP Events over Time: A bar chart of the total firewall traffic events by action type (accept,close, deny, timeout) for the selected date range. TCP Events over Time by MB: A bar chart of the total firewall traffic events by action type(accept, close, deny, timeout) for the selected date range. FW Policy Actions by Event Count: A bar chart of the allowed and denied firewall trafficevents for the selected date range.page 24Services not available everywhere. Business customers only. Lumen may change, cancel, or substitute products and services,or vary them by service area at its sole discretion without notice. 2022 Lumen Technologies. All Rights Reserved.
Top 10 Application Events: A pie chart of the number of connections by top 10 applicationcategories by IP address. Top 10 Users by Event Count (with active-directory integration): A pie charge of the top 10 IPsource users for traffic events Top 10 Source IPs by Event Count: A pie charge of the top 10 IP Source users for trafficevents.Top Destination IPs by Event Count: A pie charge of the top 10 Destination IPS for trafficevents. Log Data Summary: List of log data by action.page 25Services not available everywhere. Business customers only. Lumen may change, cancel, or substitute products and services,or vary them by service area at its sole discretion without notice. 2022 Lumen Technologies. All Rights Reserved.
Firewall Webfilter dashboardWeb filtering classifies and blocks URLs and emails to help protect computers from infection. It controlsthe use of internet resources based on URL, content, and IP addresses blocking and inspectingdownloaded content for malicious code before it reaches a user’s deviceThe Firewall Webfilter dashboard presents logged events for URL and content-based web-trafficcontrol.The following panels appear: Top 10 Blocked Sites: A pie chart showing the top blocked web sites for selected date range. Actions by Event Count: A bar chart of the number of attempts to websites by action(passthrough, blocked) for selected date range. Users with Blocked Re
The Lumen Security Solutions Reporting (powered by Lumen) portal provides near real-time dashboard, reports of log events, analysis, threat-visualization, and rapid threat defense (Adaptive Network Security only) for the following Lumen managed firewall security services: Adaptive Network Security Managed Premises Firewalls (Fortinet)