Transcription
coverstory2012 I 09Mike KockMike Kock has been a technical analyst and trader for more than 20years. He uses quantitive trading methods for commodity, interestrate and currency markets. He is a specialist in the evaluation andapplication of the Commitments of Traders (CoT)-Report. In 2008 hepublished ”25 Märkte – 100 Chancen“, an elementary book aboutcommodities and trading.Commitment of Traders ReportOn the Trail of InsidersThose who are seriously concerned with analysing all kinds ofmarkets and the trading done there, sooner or later will encounterthe terms “insiders”, “smart money”, or “speculators”. These termshave been around ever since stock markets opened in the USand there have been books galore since then reporting on thesuccessful investment strategies used by such traders. But who isbehind these terms? Is it possible to derive any real benefit fromthem as a private trader if you are familiar with them yourself? Is itreally such a smart move to go against the funds, the banks, and allthe pros and if so, when does this make sense? This article will giveyou a clear answer to that. It is based on a report which has beenpublished by a US government agency since the eighties: the CoT(Commitment of Traders) Report. Designed to protect investors,it really serves as a roadmap for being consistently profitablein the stock markets if you can implement and read it properly.How this works, how to evaluate the report properly, and how toimplement it successfully using a simple trading system, can belearnt on the following pages.www.tradersonline-mag.com5
coverstory2012 I 09äIntroductionThe traditional CoT Report has existed since 1983.The figures included in it are published by theCommodity Futures Trading Commission (CFTC) in theUS based, in Washington. Founded in 1975, the CFTCis an independent US government agency regulatingfutures and options markets in the United States. Itis primarily mandate is to protect trading partnersfrom market manipulation, fraud, and abusive tradingpractices. To achieve this objective, you first need toknow who is active in the markets and what goalsthey pursue, which is what the CoT Report does. CoTstands for Commitments of Traders. Originally thereport categorises investors into two main groups– the Commercials and the Non-Commercials –as well as a third classification, that of NonreportablePositions.The CommercialsCommercials are not active on the futures marketsprimarily to make a profit from their activity. Theirmain interest is in protecting their actual source ofprofit, which is the production or sale of goods andcommodities. About 90 per cent of all the activitiesengaged in by this group only serve hedging purposesand are not designed to achieve speculative profits.There are always exceptions, of course. For example,Glencore is often active on the stock markets as a purespeculator. Glencore is one of the largest commoditytraders in the world, based in Baar, Switzerland. Thiscompany has more than 2000 employees and owns170 transport ships worldwide. Approximately tenper cent of its staff work in what is called commoditytrading. The year 2010 showed that not only werecommodities for customers bought there but alsospeculative profits were sought in specific marketsituations.In the summer of that year, Glencore was busy onthe futures markets betting on rising prices of wheatand maize. There was a severe drought in Russiaand there were many forest fires. According to theFinancial Times, the company demanded at the sametime that the Russian government impose an exportban on grains. Once that ban was in place, pricesexploded enabling Glencore to benefit from all thatconsiderably.As a rule, though, the Commercials are moreinterested in protecting their production rather thanin speculating. However, to the extent that thesecompanies are getting ever bigger and are controllingmore and more of certain commodities, it is safe toassume that this kind of “manipulation” will occurmore often in the future.The Commercials have two advantages – a greatdeal of capital and their own research staff right thereon the plantations, in the fields, in cattle sheds, orin the mines. For example, not only does Glencorehave a stake in agriculture, mining and the petroleumindustry, but it also holds strong positions on theconsumer side, as in the transport sector, for instance.This network is tantamount to pure unadulteratedinsider knowledge!Finally, Glencore’s response to the article in theFinancial Times was as follows: “Glencore’s agriculturalteam early on received word from Russian farmsof dramatic planting conditions when the droughtbegan in Russia in the spring and summer of 2010.This enabled Glencore to conclude long contracts onwheat and maize in proprietary trading.”While the profit achieved may well be regarded asspeculative gains, it may also compensate for lossesT1) The Commercials Comprise Two GroupsProducersConsumersAgricultureLarge Food CompaniesMiningTransport SectorPetroleum IndustryConstruction IndustryBanksJewellery ManufacturersFinancial Sectorsuffered as a result of higher purchase prices. It justdepends on the eye of the beholder.The Commercials are the insiders of the markets –at an early stage they recognise situations that aredangerous to their own actual business and respondto that by immediately taking protective measures!Non-CommercialsThese are the true speculators. Their interest is clearlyin speculative profits. For example, this group includeshedge funds and foreign brokers. This group willonly make money if it can make profits on the stockmarkets. No matter which time window is consideredhere, it always boils down to a trend-followingstrategy. The more capital needs to be managed,the harder it becomes to operate “invisibly” on theT2) Old vs. New CoT ReportOld CoT ReportNew CoT ReportTraders in Financial Dealer IntermediarySwap DealerAsset ManagerManaged MoneyLeveraged FundsOther reportable PositionsOther ReportableNonreportable PositionsNonreportable PositionsNon-CommercialsNonreportable Positionswww.tradersonline-mag.com6
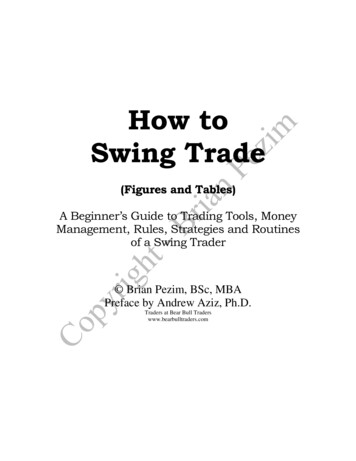
coverstory2012 I 09markets. Consequently, we meet these trend followerspredominantly in the most liquid markets such as, forexample crude oil, sugar or maize. For us, it is importantto know that without this group there cannot be anystable and long term trends in the markets. While onlyfundamental imbalances in the commodity marketscan be indicated by the Commercials at an early stage,the actual price reaction originates from the groupof Non-Commercials. There is also a third group, thegroup of Non-reportable Positions.Nonreportable PositionsThese are the private investors. Their position size is usuallytoo small to be reported, which explains the above term.Surprisingly, this group almost exclusively uses technicalanalysis for their decisions. While there is no hard and fastevidence of this being a major reason for the high 90 percent rate of losers, there is certainly a connection.Release of DataAt 3.30 pm EST every Friday, the previous Tuesday’sfigures are released by the CFTC. The data recordsthe positions of all those markets where 20 or moretraders hold positions. However, the positions needto be large enough to require being reported. Thiscauses the number of markets to vary a little, but theremay be up to 70 different markets. This concerns: T3) Summary of Positions from the Two CoT ReportsOld CoT ReportCommercialsNew CoT 8,84748,85426,095-17,563Swap Dealer150,44912,400138,049Managed Money105,72358,90246,821Other ,29148,854-17,563Unchanged!F1) Old CoT Report WheatStock IndicesInterest RatesCurrenciesCommoditiesYou have the option of downloading this datadirectly from the CFTC website (www.cftc.gov).Since 2006, the world of the CoT Report haschanged a great deal. There are three new reports thathave been added:Supplemental Index Commodity Trader (CIT) ReportThis report indicates the commodity index traderpositions and refers only to twelve markets.The figure shows the CoT Report in itsoriginal form with the example of wheat.Source: www.cftc.govwww.tradersonline-mag.com7
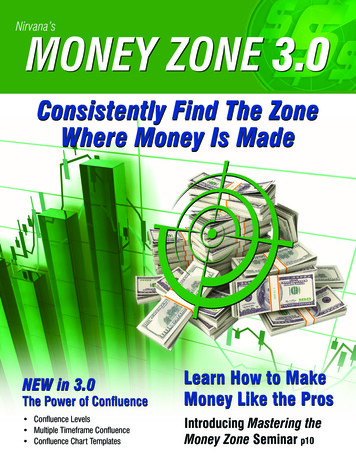
coverstory2012 I 09Traders in Financial Futures (TFF) ReportThe TFF report compiles data from Commercial andNon-Commercial categories from the original CoTReport and puts them in several defined categories.2004, these participants have been investing heavilyin the commodities markets, using various indicessuch as, the Goldman Sachs Commodity Index (GSCI).They do so in a passive way (without leverage) throughTrading volume has quintupled since 1998.It covers financials only (i.e. the markets that are notincluded in the disaggregated CoT Report).Disaggregated CoT ReportThis report, which only monitors the commoditymarkets, subdivides the two most importantcategories from the traditional CoT Report into fournew categories. These are as follows:1. Commercials, Producers/Merchants/Processors/Users2. Swap Dealers3. Managed Money4. Other Reportable PositionsThe swap dealers were removed from thegroup of Commercials and added to the group ofNon-Commercials.Who Are the Swap Dealers?In the past 15 years, the futures and commoditymarkets have experienced an explosion in openinterest and volume. Trading volume, for example,has quintupled since 1998. To some extent this is dueto the fact that pension funds and capital insurancecompanies have increased their activities. Historically,pension funds and insurance companies were notallowed full participation in the commodity marketsor were even banned from them altogether. They hadfocused primarily on managing stocks and bonds.Today, they are important players on the commoditymarkets with billions of dollars invested. Since aroundso-called swap dealers. The swap dealers are themiddlemen in these transactions with the investmentbanks managing these positions from the commodityindex. The only important thing to know is that theswap dealers and investment banks are one and thesame!Regardless of potential profits or losses, the swapdealer does not carry any major risk nor does theinvestment bank because they only manage thecapital. They may even derive some extra benefitfrom it. The investment banks primarily receive feesassociated with managing the positions and for thisthey can also benefit from the (insider) knowledge ofthe markets. They know exactly which billions wereinvested in which commodities and which orders arecurrently pending.There is no question that all these changes haveserious implications for the markets. Monitoringthese activities makes a lot of sense – not just forthe CFTC. Let us look at two current CoT Reports onwheat. Here we compare the old CoT Report (Figure1) to the new disaggregated CoT Report (Figure 2).Please pay attention to the individual numericalvalues of the various market participants. What weclearly see from Table 2 is that the swap dealerswere among the Commercials in the old report. This,of course, causes the meaning of the figures to bechanged in a big way. While the Commercials werenet short with 8532 contracts before, they are nowso with 146,581 contracts (Table 3). In the old report,they were almost bullish, while in the new report,they are far from bullish – at least if we look at onlythe numerical values.The only problem is that we cannot really learnanything from these values. It is clear, however, thatwhen the positions of the Commercials are net long,this group will be expecting a bottom to form andprices to rise.F2) New CoT Report WheatFigure 2 shows the CoT Report in its formas it has been published since 2006. TheCFTC continues to publish the originalversion of the report.Source: www.cftc.govwww.tradersonline-mag.com9
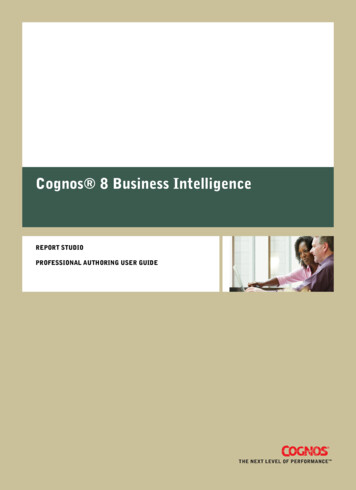
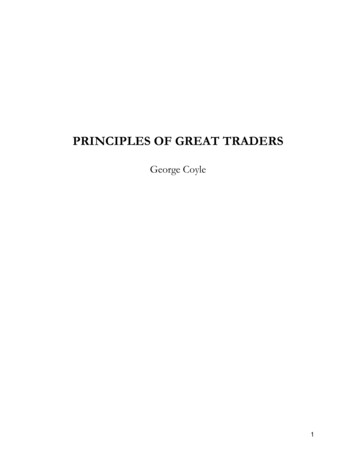
coverstory2012 I 09Let us try to illustrate this by way of charts (Figure 3and 4). You don’t really see an awful lot there. However,it is possible to create the first few rules, which looklike this:1. We only look at really extreme positions held byany market participants.2. Commercials can only indicate potential turningpoints.3. The Non-Commercials are always those that drive atrend.4. The positions held by the Nonreportables serve ascounter-indicators.5. For a bullish setup (for a bearish setup it’s the otherway round), we need the following extreme values:a. Commercials are extremely bullish.b. Non-Commercials are extremely bearish.c. (Desirable) Nonreportables are extremelybearish.Figure 5 shows an example of a bullish setup forgold. According to this chart, November 2008 saw avery good situation for a long entry in the gold market.Although the Commercials are mostly net short in thegold market, they are only net short here with -69,496positions.This is an extreme point for the insiders. Butspeculators, too, were able to reach a new record lowwith only 63,959 net (long) positions.Analysis and Strategy of CoT ReportsThere is always the question whether the pace ofchange on the markets is not constantly increasing.This is indeed the case and it is important to observethe short term changes of the positions in the CoTReport in addition to the long term time frames. Thisis best done with the CoT Index Indicator.Four time windows can be used here: Three months Six monthsF3) Old CoT Report Wheat – ChartFigure 3 shows the price pattern of wheat(black) as well as the development of netpositions of producers/distributors (green),of managed money (dark yellow), of smallspeculators (pink), and of open interest(yellow). Source: Kock CoT Analyzer Twelve months 36 monthsThis allows us to analyse the activities of all marketparticipants in relation to a defined time frame ofobservation.CoT Index Formula:COT Index 100 *Current Net – Minimum NetMaximum Net – Minimum NetRules The Commercials are bullish when the CoT Indexreaches a value higher than 75 and they areextremely bullish when we see values larger than90 here. The Commercials are bearish when the CoT Indexreaches a value of less than 25 and they areextremely bearish when we see values of less thanten here. The market is bullish when the Non-Commercialshave a CoT Index of less than 25 and it is extremelybullish when we see values of less than ten here.F4) New CoT Report Wheat – ChartFigure 4 shows the price pattern of wheat(black) as well as the development of netpositions of Commercials (green), of NonCommercials (red line) of small speculators(pink), and of open interest (yellow).Source: Kock CoT Analyzerwww.tradersonline-mag.com10
coverstory 2012 I 09The market is bearish when the Non-Commercialshave a CoT Index of more than 75 and it is extremelybearish when we see values of more than 90 here.Of the five metal markets shown in Figure 6,copper (HG) and silver (SI) are bullish in all fourtime frames. Gold (GC) and palladium (PA) are onlybullish in the later time frames. Platinum, however,is completely neutral. At the back of the table, eachgroup has its own column with the four time frames tobe observed. The old CoT Report is indicated in italics.Let us look at this in more detail by studying the goldchart (Figure 7). The blue vertical bars indicate themoments when the Commercials were extremelybullish and the Nonreportables were bearish. Theseare good opportunities for building long positions inthe market. Of course, it would be ideal if we had allfour time frames to be observed in the extreme range,but this is not absolutely necessary. In the case of gold,we can certainly use the first three earlier time frames.In conjunction with the bearish positions of privateinvestors, we will achieve good market timing. Youmay well ask yourself where the positions of the NonCommercials are. They are not necessary for the initialanalysis since we do not yet determine our entry herebut only dare to make a market assessment.We know, however, that the Non-Commercialshold the opposite positions of the Commercials andthat they want to continue driving the current trendforward. For a long entry, we need to see a minimumof Commercial short positions. This can be seenclearly in Figure 8. The red line represents the NonCommercials and the blue line the Commercials.The chart indicates the development of soybean oilprices. To find a good entry point, it is necessary for usto have a downward trend with falling positions held byspeculators and rising positions held by Commercials.This is what we have in the chart six times. But not untilthe Non-Commercials rebuild their long positions willprices turn upwards, which is what we see in the chart.For our purposes we will use this insight. Until nowwe were only able to use the CoT Reports in order totake a closer fundamental look at individual markets.This made it possible to detect trend changes earlierthan usual. For a quantitative analysis, this is obviouslynot ideal. However, to see the real benefit of theevaluation of the CoT Reports, it is necessary to createa system with fixed rules for entry and exit.CoT Report on Trading SystemThe data analysis is based on weekly prices. We useall the four different time frames from the CoT indicesof market participants. The entry rules are describedbelow.Long EntryAt least one of four time slots of the CoT Index is in theextreme range. First and foremost, there are the positionsof the Commercials and the Non-Commercials. TheNonreportables only offer support. Once this happens,we will be opening a new long position when the high ofthe previous week (bar with signal) is broken.F5) Bullish Setup in GoldHere you can see the price pattern ofgold (upper black line) as well as the netpositions of Commercials (red bars), ofNon-Commercials (lower black line) and ofNonreportables (green line).Source: TradenavigatorF6) CoT Report Analysis, Week 27/2012 – CoT IndexEvaluation of the author for the marketsgold (GC), silver (SL), platinum (PL),palladium (PA), and copper (HG).Abbreviations: Open Int Open Interest,Prod Dist Producer and Distributor,Swap Deal Swap Dealer, Old Com Commercials CoT Report old, Mgd. Mon Managed Money, Oth. Rep. other Reportable, Non Com Non-Commercials CoT Report old, Swap Mgd. Swap Dealer plus Managed Money, SmallSpec Nonreportable private investors. Source: Kock CoT Analyzerwww.tradersonline-mag.com11
coverstory2012 I 09Short EntryHere we use the low of the previous week with thesignal.ExitWe hold the position for exactly one week and thenclose it the following Monday at the open. A stop-losshas to be placed to fit each market.Using the example of silver (Figure 9), we arenow going to go through the individual trades. Thefirst short signal was no entry since the low was notbroken. But in the second signal the short entry wasmade. This is followed by two weeks of long signalsand it was only the second signal that managed tomake the entry. Silver moves up to the US 50 mark.But six weeks earlier, there were already signs of atrend reversal. The real short entry, though, was onlymade at the last bar to the low! After that, there wereanother seven entries, of which three ended up aslosers and four as winners.By now, you should have seen the logic of thissimple system and, of course, the opportunities forimprovement. What indices do we have in the silvermarket, having used this system since 1990? Thefigures are as follows: Hit rate: 78 per cent, profit factor:2.78, number of trades: 55, number of trades per year:about 2.5, longest losing streak: 2, longest winningstreak: 18, average winning trade: 3552 USD, averagelosing trade: 4041 USD. We will now be testing thissystem on a portfolio of 39 different futures markets,which – besides commodities – including interest-rateand currency markets. In those 39 markets, the hit ratewas highest at 84 per cent in the Swiss franc contract,and lowest at only 25 per cent in the RBOB Gasolinecontract. Looking at the entire portfolio, this roughtrading approach still achieves a positive value of 54.3per cent, at a profit factor of 1.7. The average numberof trades per year is 61.6. That’s not really a lot andmeans that each and every trade must be carried out.Since 1990, the system has only ended up in the redthree times, in 1994, 2001 and 2004. It is interesting tocompare the long and short signals. While the longF7) Gold ChartFigure 7 shows the CoT Commercials Index(blue line – three years, red line – one year,green line – six months, brown line – threemonths). The blue vertical bars indicate whenthe commercials were extremely bullish andthe Nonreportables were bearish. These aregood opportunities for long positions.Source: Tradenavigatorentries have a higher hit rate in all markets, they dohave a smaller profit factor. By contrast, the shortpositions consistently boast a much larger profit.How can this be explained? Downward movementsare generally much faster and stronger than upwardones. Since the system is based on weekly prices,more losses are encountered in the short signalsthan on the long side. There is also the time factorF8) Soybean OilThe chart indicates the development ofsoybean oil futures as well as the accordingpositions of the speculators (red line) andof the producers (blue line).Source: Trade Navigatorwww.tradersonline-mag.com12
coverstory2012 I 09to consider in an exit. The positions are closed againafter a bar – in other words, after exactly one week atthe opening on Monday. Upward movements needmore time though, causing the profit to have beenminimised here. It’s different with the short signalswhere the one-week time frame is clearly sufficient.The system needs to have its own stop-loss for eachmarket. Ideally, there is also a profit target there. Itmakes little sense to use the same risk and moneymanagement rules in precious metals, currencies, orinterest rates since the average daily and weekly pricespreads are far too different.F9) Silver ChartThe red points show extreme short positions,the green and blue points show extremelong positions of the insiders on the weeklychart. The green “G” stands for gold longentry. An entry is made only then when thebig speculators adjust their positions in thedirection of the extreme positions of theCommercials. Source: TradenavigatorConclusionThe analysis of the CoT Reports is an efficient wayto evaluate the fundamental and technical state ofthe markets with the Commercials standing for theThe system needs to have itsown stop-loss for each market.Here you can see the evaluation of tradingsignals from 1990 until 2012.Source: Tradenavigatoräfundamental side and the Non-Commercials for thetechnical side. The quantitative study of the past22 years indicates a steady positive expected valuewhen implementing the CoT data on a portfolio of 39different markets with buy signals having a higher hitrate than sell signals, but unfortunately a lower profitfactor.Since the CoT Reports are available from the CFTCfree of charge, this provides the opportunity to beeven more successful in your trading. Private tradersare recommended to implement these signals byusing ETFs and ETCs. Trading futures requires moreequity since the signals are generated on a weeklybasis. As far as institutional investors are concerned,this strategy can easily be implemented on the futuresmarkets.F10) Performance of CoT System in 39 Marketswww.tradersonline-mag.com13
focused primarily on managing stocks and bonds. Today, they are important players on the commodity markets with billions of dollars invested. Since around 2004, these participants have been investing heavily in the commodities markets, using various i