Transcription
International Journal of Marketing, Financial Services & Management Research ISSN 2277- 3622Vol.2, No. 5, May (2013)Online available at www.indianresearchjournals.comA STUDY ON FUNDAMENTAL AND TECHNICAL ANALYSISMR. SURESH A.SASSISTANT PROFESSOR,MBA DEPARTMENT,PES INSTITUTE OF TECHNOLOGY,BANGALORE SOUTH CAMPUS,1KM BEFORE ELECTRONIC CITY,HOSUR ROAD, BANGALOREABSTRACTThe unique nature of capital market instruments forces investors to depend strongly onfundamental factors in their investment decisions. These fundamental factors relate to the overalleconomy or a specific industry or a company. The performance of the securities that representthe company can be said to depend on the performance of the company itself. However, ascompanies are a part of industrial and business sector, which in turn are a part of overalleconomy, so even the economic and industry factors can affect the investment decision. Theselection of an investment will start with fundamental analysis. Fundamental analysis examinesthe economic environment, industry performance and company performance before making aninvestment decision.KEYWORDS: Capital market, fundamental factors, investment decisions.INTRODUCTIONFundamental analysis is the examination of the underlying forces that affect the well being of theeconomy, industry groups and companies. As with most analysis, the goal is to develop aforecast of future price movement and profit from it. At the company level, fundamental analysismay involve examination of financial data, management, business concept and competition. Atthe industry level, there might be an examination of supply and demand forces of the products.For the national economy, fundamental analysis might focus on economic data to assess thepresent and future growth of the economy.To forecast future stock prices, fundamental analysis combines economic, industry, and companyanalysis to derive a stock’s fair value called intrinsic value. If fair value is not equal to thecurrent stock price, fundamental analysts believe that the stock is either over or under valued. Asthe current market price will ultimately gravitate towards fair value, the fair value should beestimated to decide whether to buy the security or not. By believing that prices do not accuratelyreflect all available information, fundamental analysts look to capitalize on perceived pricediscrepancies.44
International Journal of Marketing, Financial Services & Management Research ISSN 2277- 3622Vol.2, No. 5, May (2013)Online available at www.indianresearchjournals.comFundamental Analysis is a method of evaluating a security by attempting to measure itsintrinsic value by examining related economic, financial and other qualitative andquantitative factors. Fundamental analysts attempt to study everything that can affect thesecurity’s value, including macroeconomic factors (like the overall economy and industryconditions) and individual specific factors (like the financial condition and management ofcompanies).OBJECTIVES OF FUNDAMENTAL ANALYSIS To predict the direction of national economy because economic activity affects thecorporate profit, investor attitudes and expectation and ultimately security prices. To estimate the stock price changes by studying the forces operating in the overalleconomy, as well as influences peculiar to industries and companies. To select the right time and right securities for the investmentTHREE PHASES OF FUNDAMENTAL ANALYSIS1) Understanding of the macro-economic environment and developments (EconomicAnalysis)2) Analyzing the prospects of the industry to which the firm belongs (Industry Analysis)3) Assessing the projected performance of the company (Company Analysis)The three phase examination of fundamental analysis is also called as an EIC (EconomyIndustry-Company analysis) framework or a top-down approachHere the financial analyst first makes forecasts for the economy, then for industries and finallyfor companies. The industry forecasts are based on the forecasts for the economy and in turn, thecompany forecasts are based on the forecasts for both the industry and the economy. Also in thisapproach, industry groups are compared against other industry groups and companies againstother companies. Usually, companies are compared with others in the same group.For example, a telecom operator (Spice) would be compared to another telecom operator not toan oil company.Thus, the fundamental analysis is a 3 phase analysis ofa) The economyb) The industry andc) The company45
International Journal of Marketing, Financial Services & Management Research ISSN 2277- 3622Vol.2, No. 5, May (2013)Online available at www.indianresearchjournals.comPhaseFIRSTNature ofAnalysisEconomicAnalysisSECONDIndustry AnalysisTHIRDPurposeTools and techniquesTo access the general Economic indicatorseconomic situation of thenation.To assess the prospects of Industry life cycle analysis,various industry groupings.Competitive analysis ofindustries etc.To analyse the Financial andCompany Analysis Non-financial aspects of acompanytodeterminewhether to buy, sell or holdthe shares of a lity, EPS etc.Analysis of Non-financialaspects:management,corporate image, productquality etc.STRENGTHS OF FUNDAMENTAL ANALYSIS Long-term TrendsFundamental analysis is good for long term investments based on long-term trends. Theability to identify and predict long-term economic, demographic, technological or consumertrends can benefit investors and helps in picking the right industry groups or companies. Value SpottingSound fundamental analysis will help identify companies that represent a good value. Someof the most legendary investors think for long-term and value. Fundamental analysis can helpuncover the companies with valuable assets, a strong balance sheet, stable earnings, and stayingpower. Business AcumenOne of the most obvious, but less tangible rewards of fundamental analysis is thedevelopment of a thorough understanding of the business. After such painstaking research andanalysis, an investor will be familiar with the key revenue and profit drivers behind a company.Earnings and earnings expectations can be potent drivers of equity prices. A good understandingcan help investors avoid companies that are prone to shortfalls and identify those that continue todeliver.46
International Journal of Marketing, Financial Services & Management Research ISSN 2277- 3622Vol.2, No. 5, May (2013)Online available at www.indianresearchjournals.com Value DriversIn addition to understanding the business, fundamental analysis allows investors todevelop an understanding of the key value drivers within the company. A stock’s price is heavilyinfluenced by the industry group. By studying these groups, investors can better positionthemselves to identify opportunities that are high-risk (tech), low-risk (utilities), growth oriented(computer), value driven (oil), non cyclical (consumer staples), cyclical (transportation) etc. Knowing Who is WhoStocks move as a group. Knowing a company’s business, investors can better categorizestocks within their relevant industry group that can make a huge difference in relative valuations.The primary motive of buying a share is to sell it subsequently at a higher price. In many cases,dividends are also to be expected. Thus, dividends and price changes constitute the return frominvesting in shares. Consequently, an investor would be interested to know the dividend to bepaid on the share in the future as also the future price of the share. These values can only beestimated and not predicted with certainty. These values are primarily determined by theperformance of the company which in turn is influenced by the performance of the industry towhich the company belongs and the general economic and socio-political scenario of thecountry.An investor who would like to be rational and scientific in his investment activity has to evaluatea lot of information about the past performance and the expected future performance ofcompanies, industries and the economy as a whole before taking investment decision. Each shareis assumed to have an economic worth based on its present and future earning capacity. This iscalled its intrinsic value or fundamental value. The purpose of fundamental analysis is toevaluate the present and future earning capacity of a share based on the economy, industry andcompany fundamentals and thereby assess the intrinsic value of the share. The investor can thencompare the intrinsic value of the share with the prevailing market price to arrive at aninvestment decision. If the market price of the share is lower than its intrinsic value, the investorwould decide to buy the share as it is underpriced. The price of such a share is expected to moveup in future to match with its intrinsic value.On the contrary, when the market price of a share is higher than its intrinsic value, it is perceivedto be overpriced. The market price of such a share is expected to come down in future and hence,the investor would decide to sell such a share. Fundamental analysis thus provides an analyticalframework for rational investment decision-making. Fundamental analysis insists that no oneshould purchase or sell a share on the basis of tips and rumours. The fundamental approach callsupon the investor to make his buy or sell decision on the basis of a detailed analysis of theinformation about the company, the industry to which the company belongs, and the economy.This results in informed investing.The fundamental analysis can be valuable, but it should be approached with caution. If you arereading research written by a sell-side analyst, it is important to be familiar with the analystbehind the report. We all have personal biases, and every analyst has some sort of bias. There isnothing wrong with this, and the research can still be of great value. Learn what the ratings meanand track the record of an analyst before jumping to a conclusion. Corporate statements and press47
International Journal of Marketing, Financial Services & Management Research ISSN 2277- 3622Vol.2, No. 5, May (2013)Online available at www.indianresearchjournals.comreleases of a company offer good information, but they should be read with a healthy degree ofscepticism to separate the facts from the spin. Press releases don’t happen by accident; they arean important PR tool for companies. Investors should become skilled readers to weed out theimportant information and ignore the hype.TECHNICAL ANALYSISFundamental analysis and Technical analysis are the two main approaches to security analysis.Technical analysis is frequently used as a supplement to fundamental analysis rather than as asubstitute to it. According to technical analysis, the price of stock depends on demand and supplyin the market place. It has little correlation with the intrinsic value. All financial data and marketinformation of a given stock is already reflected in its market price.Technical analysts have developed tools and techniques to study past patterns and predict futureprice. Technical analysis is basically the study of the markets only. Technical analysts study thetechnical characteristics which may be expected at market turning points and their objectiveassessment. The previous turning points are studied with a view to develop some characteristicsthat would help in identification of major market tops and bottoms. Human reactions are, by andlarge consistent in similar though not identical reaction; with his various tools, the technicianattempts to correctly catch changes in trend and take advantage of them.Technical analysis is directed towards predicting the price of a security. The price at which abuyer and seller settle a deal is considered to be the one precise figure which synthesis, weighsand finally expresses all factors, rational and irrational, quantifiable and non-quantifiableand is the only figure that counts.Thus, the technical analysis provides a simplified and comprehensive picture of what ishappening to the price of a security. Like a shadow or reflection it shows the broad outline of thewhole situation and it actually works in practice.ASSUMPTIONS OF TECHNICAL ANALYSIS The market value of a security is solely determined by the interaction of demand and supplyfactors operating in the market. The demand and supply factors of a security are surrounded by numerous factors; thesefactors are both rational as well as irrational. The security prices move in trends or waves which can be both upward or downwarddepending upon the sentiments, psychology and emotions of operators or traders. The present trends are influenced by the past trends and the projection of future trends ispossible by an analysis of past price trends. Except minor variations, stock prices tend to move in trends which continue to persist for anappreciable length of time. Changes in trends in stock prices are caused whenever there is a shift in the demand andsupply factors.48
International Journal of Marketing, Financial Services & Management Research ISSN 2277- 3622Vol.2, No. 5, May (2013)Online available at www.indianresearchjournals.com Shifts in demand and supply, no matter when and why they occur, can be detected throughcharts prepared specially to show market action. Some chart trends tend to repeat themselves. Patterns which are projected by charts recordprice movements and these patterns are used by technical analysis for making forecasts aboutthe future patterns.TOOLS AND TECHNIQUES OF TECHNICAL ANALYSISThere are numerous tools and techniques for doing technical analysis. Basically this analysis isdone from the following four important points of view:1) Prices: Whenever there is change in prices of securities, it is reflected in the changes ininvestor attitude and demand and supply of securities.2) Time: The degree of movement in price is a function of time. The longer it takes for areversal in trend, greater will be the price change that follows.3) Volume: The intensity of price changes is reflected in the volume of transactions thataccompany the change. If an increase in price is accompanied by a small change intransactions, it implies that the change is not strong enough.4) Width: The quality of price change is measured by determining whether a change intrend spreads across most sectors and industries or is concentrated in few securities only.Study of the width of the market indicates the extent to which price changes have takenplace in the market in accordance with a certain overall trends.DOW THEORYThe Dow Theory, originally proposed by Charles Dow in 1900 is one of the oldest technicalmethods still widely followed. The basic principles of technical analysis originate from thistheory.According to Charles Dow “The market is always considered as having three movements, allgoing at the same time. The first is the narrow movement from day to day. The second is theshort swing, running from two weeks to a month or more and the third is the main movement,covering at least four years in its duration”.The Theory advocates that stock behaviour is 90% psychological and 10% logical. It is the moodof the Crowd which determines the way in which prices move and the move can be gauged byanalysing the price and volume of transactions.The Dow Theory only describes the direction of market trends and does not attempt to forecastfuture movements or estimate either the duration or the size of such market trends. The theoryuses the behaviour of the stock market as a barometer of business conditions rather than as abasis for forecasting stock prices themselves. It is assumed that most of the stocks follow theunderlying market trend, most of the times.A trend should be assumed to continue in effect until such time as its reversal has beendefinitely signalled. The end of a bull market is signalled when a secondary reaction of declinecarries prices lower than the level recorded during the earlier reaction and the subsequentadvance fails to carry prices above the top level of the preceding recovery. The end of a bearmarket is signalled when an intermediate recovery carries prices to a level higher than the oneregistered in the previous advance and the subsequent decline halts above the level recorded inthe earlier reaction.49
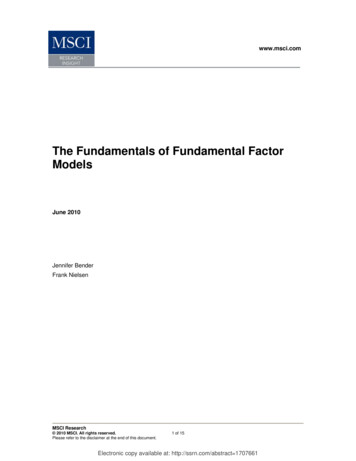
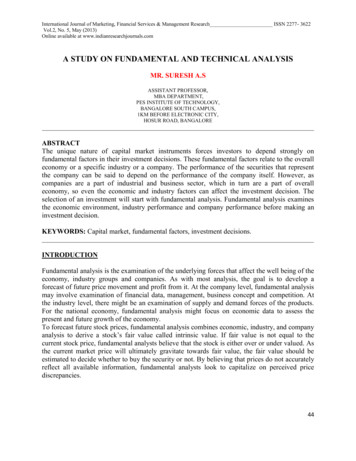
International Journal of Marketing, Financial Services & Management Research ISSN 2277- 3622Vol.2, No. 5, May (2013)Online available at www.indianresearchjournals.comTable 1: Example of bull market trend.The above figure shows that a bull market interrupted by reactions.Table 2: Bear market trend.The above figure shows that a bear market interrupted by recoveries.CHARTINGCharting is the basic tool in technical analysis, which provides visual assistance in defectingchanging pattern of price behaviour. The technical analyst is sometimes called the Chartistbecause of importance of this tool. The Chartists believe that stock prices move in fairlypersistent trends. There is an inbuilt inertia, the price movement continues along a certain path(up, down or sideways) until it meets an opposing force due to demand-supply changes. Chartistsalso believe that generally volume and trend go hand in hand. When a major ‘up’ trend begins,the volume of trading increases and also the price and vice-versa.The essence of Chartism is the belief that share prices trace out patterns over time. These are areflection of investor behaviour and it can be assumed that history tends to repeat itself in thestock market. A certain pattern of activity that in the past produced certain results is likely togive rise to the same outcome should it reappear in the future. The various types of commonlyused charts are:50
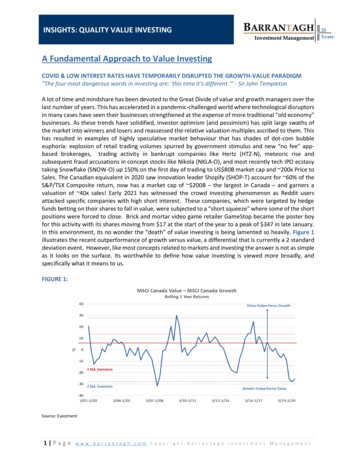
International Journal of Marketing, Financial Services & Management Research ISSN 2277- 3622Vol.2, No. 5, May (2013)Online available at www.indianresearchjournals.coma) Line Chartb) Bar Chartc) Point and figure ChartLine Charts: The simplest form of chart is a line chart. Line charts are simple graphs drawn byplotting the closing price of the stock on a given day and connecting the points thus plotted overa period of time. Line charts take no notice of the highs and lows of stock prices for each period.Table 3: The following figure presents a typical line chartBar Charts: It is a simple charting technique. In this chart, prices are indicated on the verticalaxis and the time on horizontal axis. The market or price movement for a given session (usually aday) is represented on one line. The vertical part of the line shows the high and low prices atwhich the stock traded or the market moved. A short horizontal tick on the vertical line indicatesthe price or level at which the stock or market closed:Table 4: The following figure shows a bar Chart.51
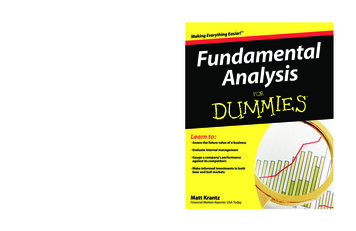
International Journal of Marketing, Financial Services & Management Research ISSN 2277- 3622Vol.2, No. 5, May (2013)Online available at www.indianresearchjournals.comPoint and Figure Chart (PFC): Though the point and figure chart is not as commonly used asthe other two charts, it differs from the others in concept and construction. In PFC there is notime scale and only price movements are plotted. As a share price rises, a vertical column ofcrosses is plotted. When it falls, a circle is plotted in the next column and this is continueddownward while the price continues to fall. When it rises again, a new vertical line of crosses isplotted in the next column and so on. A point and figure chart that changes column on everyprice reversal is cumbersome and many show a reversal only for price changes of three units ormore (a unit of plot may be a price change of say one rupee).Table 5: The following figure shows a point and figure chart:TRENDSA trend can be defined as the direction in which the market is moving. Up trend is the upwardmovement and downtrend is the downward movement of stock prices or of the market asmeasured by an average or index over a period of time, usually longer than six months. Trendlines are lines that are drawn to identify such trends and extend them into the future. These linestypically connect the peaks of advances and bottoms of declines. Sometimes, an intermediatetrend that extends horizontally is seen.52
International Journal of Marketing, Financial Services & Management Research ISSN 2277- 3622Vol.2, No. 5, May (2013)Online available at www.indianresearchjournals.comTable 6: Upward trend chartTable 7: Downward trend chartSIDEWAY TRENDA sideway trend is characterised by stock prices trading in a range where successive peaks occurat the same level and successive troughs occur at the same level. The two levels create paralleltrend lines. During this time the investor should be extra careful and wait for more definiteindicators of the future market movement.53
International Journal of Marketing, Financial Services & Management Research ISSN 2277- 3622Vol.2, No. 5, May (2013)Online available at www.indianresearchjournals.comTable 8: Sideway trend chartTrend lines encompass advances and declines by joining successive tops and bottoms.Sometimes, it is useful to trap trends by drawing trend lines on both the sides of an upward ordownward trend. These parallel lines drawn to encompass trends from both the sides are calledchannels.MOVING AVERAGE ANALYSISThe statistical method of moving averages is also used by technical analysts for forecasting theprices of shares. While trends in share prices can be studied for possible patterns, sometimes itmay so happen that the prices appear to move rather haphazardly and be very volatile. Movingaverage analysis can help under such circumstances. A moving average is a smoothedpresentation of underlying historical data. It is a summary measure of price movement whichreduces the distortions to a minimum by evening out the fluctuations in share prices. Theunderlying trend in prices is clearly disclosed when moving averages are used.To construct a moving average the time span of the average has to be determined. A 10 daymoving average measures the average over the previous 10 trading days, a 20 day movingaverage measures the average values over the previous 20 days and so on. Regardless of the timeperiod used, each day a new observation is included in the calculation and the oldest is dropped,so a constant number of points are always being averaged.The moving averages are worked out in respect of securities studied and depicted on the graph.Whenever the moving average price line cuts the actual price line of the security or of the marketindex from the bottom it is a signal for the investors to sell the shares. Conversely, when themoving average price line cuts the actual price line from above, it is the right time to buy shares.The moving average analysis is quite a useful method in finding out the trends in security priceswhen it is based on long-term approach. However, a point of caution is in order. Moving average54
International Journal of Marketing, Financial Services & Management Research ISSN 2277- 3622Vol.2, No. 5, May (2013)Online available at www.indianresearchjournals.comanalysis always invariably provide signal to buy or sell, after the trend reversal has begun. Theseare neither lead indicators nor juncture points for change in trends. The moving averagesshould therefore, be used only with other indicators, otherwise these may provide true, butmathematically inaccurate information. The technical analysts can use three types of movingaverages -simple, weighted or exponential.RELATIVE STRENGTHThe empirical evidence shows that certain securities perform better than other securities in agiven market environment and this behaviour remains constant over time. Relative strength isthe technical name given to such securities by the technical analysts because these securitieshave stability and are able to withstand both depression and peak periods. Investors shouldinvest in such securities, because these have constant strength in the market. The relative strengthanalysis may be applied to individual securities or to whole industries or portfolios consisting ofstock and bonds. The relative strength can be calculated by:i. Measuring the rate of return of securitiesii. Classifying securitiesiii. Finding out the high average return of securitiesiv.Using the technique of ratio analysis to find out the strength of an individual security.Technical analysts measure relative strength as an indication for finding out the return ofsecurities. They have observed that those securities displaying greatest relative strength in goodmarkets (bull) also show the greatest weakness in bad markets (bear). These securities will riseand fall faster than the market.Technical analysts explain relative strength as a relationship between risk and return of a securityfollowing the trends in the economy. After preparing charts from different securities over alength of time, the technician would select certain securities which showed relative strength to bethe most promising investment opportunities.RESISTANCE AND SUPPORT LEVELSThe peak price of the stock is called the resistance area. Resistance level is the price level towhich the stock or market rises and then falls repeatedly. This occurs during an uptrend or asideway trend. It is a price level to which the market advances repeatedly but cannot breakthrough. At this level, selling increases which causes the price fall.Support level shows the previous low price of the stock. It is a price level to which a stock ormarket price falls or bottom out repeatedly and then bounce up again. Demand for the stockincreases as the price approaches a support level. The buying pressure or the demand supportsthe price of stock preventing it from going lower.55
International Journal of Marketing, Financial Services & Management Research ISSN 2277- 3622Vol.2, No. 5, May (2013)Online available at www.indianresearchjournals.comTable 9: Resistance & Support level trend chartThe figure shows that if the share price persistently fails to rise above a certain level, this isknown as resistance level. This is perhaps because at this price people who purchased previously,but then saw the share prices fall, took the opportunity to sell at the price they previously paid.Likewise, a support level is a price at which buyers constantly seem to come forward to preventthe share prices dropping any further.The support and resistance levels are important tools in confirming a reversal, in forecasting thecourse of prices, and in making appropriate price moves.BREAK-OUT THEORYBreak out is also called as ‘confirmation’. This is indicated by drawing a line, which is a periodof consolidation, when the share prices move sideways within a range of about 5% of the shareprice. Eventually a break out will occur and it is often suggested that the longer the period ofconsolidation, the greater will be the extent of ultimate rise or fall.Breakout is a signal for the investors who wish to buy or sell their stocks.56
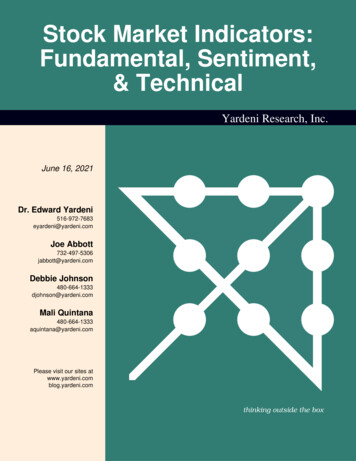
International Journal of Marketing, Financial Services & Management Research ISSN 2277- 3622Vol.2, No. 5, May (2013)Online available at www.indianresearchjournals.comHEAD AND SHOULDERS PATTERNThe Head and Shoulders pattern is by far the most reliable and widely used of all reversalpatterns. This pattern indicates a reversal of an uptrend. This pattern occurs at the end of a bullmarket and is characterised by two smaller advances flanking a higher advances just as the headlies in between two shoulders.Table 10: A typical head and shoulder formation chart:In reality, the shoulders are not always symmetrical. This does not in any way alter the signalsprovided by the pattern. The important requirement is that the shoulders should be at lower levelsthan the head. The left shoulder is seen during the time when there is a lull in the trading marketfollowed by heavy purchases. The quiet time in trading called lull is such to raise the price bypushing to a new peak. The head faces with the time when there are heavy purchases in themarket that it raises it and then it falls back to indicate that it is far below the top of the leftshoulder. The right shoulder indicates that the price rises moderately by the activity in the marketbut it does not rise in such a manner that it reaches higher than the top of the head while it isreaching top, it begins to fall again and such a decline is indicated. The formation is easilydiscernible once the right shoulder is formed. The line that joins the points from where the finaladvance begins and ends is called the neckline. A trend reversal almost always occurs when theneckline is penetrated by the price line.The head and shoulders pattern may be formed over short period of a few weeks or taken evenyears to emerge. This pattern is the most reliable indicator of the onset of a bear market. Themethod also provides scope for measuring the extent of fall in prices. The prices are expected todecline after the penetration of the neckline by the price line, at least as much as the distancebetween the head and the neckline.57
International Journal of Marketing, Financial Services & Management Research ISSN 2277- 3622Vol.2, No. 5, May (2013)Online available at www.indianresearchjournals.comDOUBLE TOP FORMATIONThe double top occurs as an uptrend is about to reverse itself. A double top is formed whenprices reach the previous high and react immediately, the two highs reached being almost at thesame level. Two peaks at comparable heights are seen, with a reaction forming a valley betweenthem. The prices breakout into a bearish phas
In addition to understanding the business, fundamental analysis allows investors to develop an understanding of the key value drivers within the company. A stock’s price is heavily influenced by the industry group. By studying these groups, investors can better position themselves to ident