Transcription
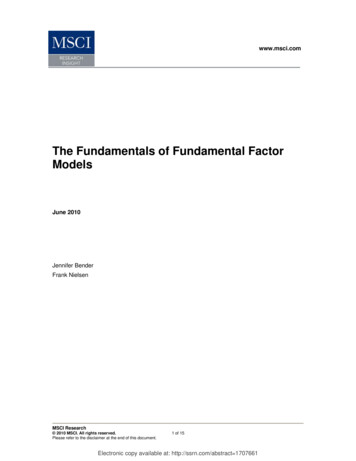
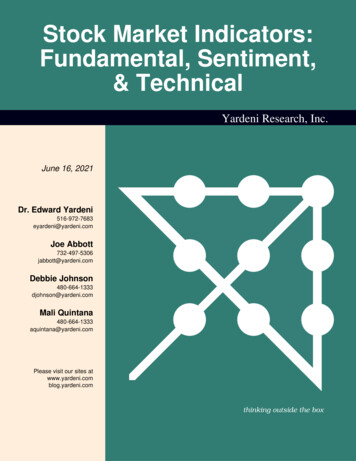
Stock Market Indicators:Fundamental, Sentiment,& TechnicalYardeni Research, Inc.June 16, 2021Dr. Edward Yardeni516-972-7683eyardeni@yardeni.comJoe Abbott732-497-5306jabbott@yardeni.comDebbie Johnson480-664-1333djohnson@yardeni.comMali Quintana480-664-1333aquintana@yardeni.comPlease visit our sites atwww.yardeni.comblog.yardeni.comthinking outside the box
Table Of ContentsTable Of ContentsFundamental Stock Market Indicator1Global Growth Barometer2Economic Surprise Index3Investors Intelligence Sentiment4Bull/Bear Ratio Over 3.05Bull/Bear Ratio Under 1.06Bull/Bear Ratio Under 1.0 & Over 3.07AAII Sentiment8Volatility9Volume10Dow Theory11S&P 500 Moving Averages12-13S&P 500 Sectors Stock Price Index & 200-dma14S&P 500 Sectors Stock Price Index Minus 200-dma15S&P 500 Sectors Stock Price Index Relative to S&P 50016June 16, 2021 / Fundamental, Sentiment, & TechnicalYardeni Research, Inc.www.yardeni.com
Fundamental Stock Market IndicatorFigure 1.8504500S&P 500 INDEX & INDUSTRIAL COMMODITY PRICES6/164000750S&P 500 Index3500CRB Raw IndustrialsSpot 152016201720182019202020212022Source: I/B/E/S data by Refinitiv and Commodity Research Bureau.Figure 2.-1004500S&P 500 INDEX & INITIAL UNEMPLOYMENT CLAIMS3006/166/57004000110015003500S&P 500 Index19002300300027003100350039002500Initial Unemployment Claims(thousands, sa, four-week moving average,inverted com5002000 2001 2002 2003 2004 2005 2006 2007 2008 2009 2010 2011 2012 2013 2014 2015 2016 2017 2018 2019 2020 2021 2022Source: US Department of Labor and Standard & Poor’s.Page 1 / June 16, 2021 / Stock Market Indicators: Fundamental, Sentiment, & TechnicalYardeni Research, Inc.www.yardeni.com
Global Growth BarometerFigure 3.45004500YRI GLOBAL GROWTH BAROMETER (on S&P 500 basis) & S&P 5006/1640004000YRI Global Growth Barometer* (1177.8)35003500S&P 500 Index 16201720182019202020215002022* Average of Brent crude oil and CRB raw industrials spot price index times 2 and divided by 10. Average then multiplied by 10 and 200 added.Source: Standard & Poor’s and Commodity Research Bureau.Figure 4.2004500US STOCK PRICES vs. BRENT CRUDE OIL PRICE6/161754000S&P 500 IndexBrent Crude Oil Price*(dollars per 6201720182019202020212022* Nearby futures price.Source: Financial Times and Standard & Poor’s Corporation.Page 2 / June 16, 2021 / Stock Market Indicators: Fundamental, Sentiment, & TechnicalYardeni Research, Inc.www.yardeni.com
Economic Surprise IndexFigure 5.1000800400S&P 500 INDEX vs. CITIGROUP ECONOMIC SURPRISE 600-50-200-100-150-400-200S&P 500 minus its200 day-moving average-600-300-800-1000-250Economic Surprise Source: Wall Street Journal and Citigroup.Figure 6.25300S&P 500 P/E vs. CITIGROUP ECONOMIC SURPRISE INDEX(percent)25023S&P 500 Forward P/E*2006/10211501910017506/16015-5013-100Economic Surprise 22013201420152016201720182019202020212022* Average weekly price divided by 52-week forward consensus expected operating earnings per share.Source: Standard & Poor’s, I/B/E/S data by Refinitiv, and Citigroup.Page 3 / June 16, 2021 / Stock Market Indicators: Fundamental, Sentiment, & TechnicalYardeni Research, Inc.www.yardeni.com
Investors Intelligence SentimentFigure 7.66INVESTORS INTELLIGENCE BULLS & BEARS54RatioBull/BearRatio*Jun 1Jun 8Jun 155Ratio3.253.363.3246/153322110087 88 89 90 91 92 93 94 95 96 97 98 99 00 01 02 03 04 05 06 07 08 09 10 11 12 13 14 15 16 17 18 19 20 21 22 238075706580PercentageBullsBearsMay 25Jun 1Jun 5550504545404035353030252520201515101087 88 89 90 91 92 93 94 95 96 97 98 99 00 01 02 03 04 05 06 07 08 09 10 11 12 13 14 15 16 17 18 19 20 21 22 23504550PercentageCorrection40Jun 1Jun 8Jun 151010yardeni.com5587 88 89 90 91 92 93 94 95 96 97 98 99 00 01 02 03 04 05 06 07 08 09 10 11 12 13 14 15 16 17 18 19 20 21 22 23Source: Investors Intelligence.Page 4 / June 16, 2021 / Stock Market Indicators: Fundamental, Sentiment, & TechnicalYardeni Research, Inc.www.yardeni.com
Bull/Bear Ratio Over 3.0Figure 8.460042003800340030002600S&P 500 INDEX vs. BULL/BEAR RATIO OF3.0 OR MORE*(ratio 14001400yardeni.com1000600100060020020087 88 89 90 91 92 93 94 95 96 97 98 99 00 01 02 03 04 05 06 07 08 09 10 11 12 13 14 15 16 17 18 19 20 21 22 23* Red shaded areas indicate Bull/Bear Ratio equal to or greater than 3.0.Source: Standard & Poor’s and Investors Intelligence.Figure 9.3660031600266002160036600316006/16DOW JONES INDEX vs. BULL/BEAR RATIO OF3.0 OR MORE*(ratio 016006600160087 88 89 90 91 92 93 94 95 96 97 98 99 00 01 02 03 04 05 06 07 08 09 10 11 12 13 14 15 16 17 18 19 20 21 22 23* Red shaded areas indicates Bull/Bear Ratio equal to or greater than 3.0.Source: Wall Street Journal and Investors Intelligence.Page 5 / June 16, 2021 / Stock Market Indicators: Fundamental, Sentiment, & TechnicalYardeni Research, Inc.www.yardeni.com
Bull/Bear Ratio Under 1.0Figure 10.460042003800340030002600S&P 500 INDEX vs BULL/BEAR RATIOOF 1.0 OR LESS*(ratio 14001400yardeni.com1000600100060020020087 88 89 90 91 92 93 94 95 96 97 98 99 00 01 02 03 04 05 06 07 08 09 10 11 12 13 14 15 16 17 18 19 20 21 22 23* Green shaded areas indicate Bull/Bear Ratio equal to or less than 1.0.Source: Standard & Poor’s and Investors Intelligence.Figure 11.3660031600266002160036600316006/16DOW JONES INDEX vs. BULL/BEAR RATIOOF 1.0 OR LESS*(ratio 016006600160087 88 89 90 91 92 93 94 95 96 97 98 99 00 01 02 03 04 05 06 07 08 09 10 11 12 13 14 15 16 17 18 19 20 21 22 23* Green shaded areas indicates Bull/Bear Ratio equal to or less than 1.0.Source: Wall Street Journal and Investors Intelligence.Page 6 / June 16, 2021 / Stock Market Indicators: Fundamental, Sentiment, & TechnicalYardeni Research, Inc.www.yardeni.com
Bull/Bear Ratio Under 1.0 & Over 3.0Figure 12.4040S&P 500 % FROM 200-DMAvs.BULL/BEAR RATIO OF 3.0 OR MORE*20206/16yardeni.com0-200-20-40-4087 88 89 90 91 92 93 94 95 96 97 98 99 00 01 02 03 04 05 06 07 08 09 10 11 12 13 14 15 16 17 18 19 20 21 22 23* Red shaded areas indicates Bull/Bear Ratio equal to or more than 3.0.Source: Standard & Poor’s Corporation.Figure 13.4040S&P 500 % FROM 200-DMAvs.BULL/BEAR RATIO OF 1.0 OR LESS*20206/16yardeni.com0-200-20-40-4087 88 89 90 91 92 93 94 95 96 97 98 99 00 01 02 03 04 05 06 07 08 09 10 11 12 13 14 15 16 17 18 19 20 21 22 23* Green shaded areas indicates Bull/Bear Ratio equal to or less than 1.0.Source: Standard & Poor’s Corporation.Page 7 / June 16, 2021 / Stock Market Indicators: Fundamental, Sentiment, & TechnicalYardeni Research, Inc.www.yardeni.com
AAII SentimentFigure 14.100100AAII SENTIMENT INDEX FOR STOCKSAAII Bull Ratio* I Bull/Bear Ratio 20132014201520162017201820192020202120228080Bulls (40.2)70Jun 2Jun 9Bears (20.7)Latest 011201220132014201520162017201820192020202102022* AAII Bull Ratio is the percent of bulls over the percent of bulls plus percent of bears.Source: American Association of Individual Investors (AAII).Page 8 / June 16, 2021 / Stock Market Indicators: Fundamental, Sentiment, & TechnicalYardeni Research, Inc.www.yardeni.com
VolatilityFigure 15.5.5140BULL/BEAR RATIO & CONSUMER CONFIDENCE5.0Bull/Bear Ratio(4-week average)4.54.0Consumer ConfidenceExpectations ni.com202000 2001 2002 2003 2004 2005 2006 2007 2008 2009 2010 2011 2012 2013 2014 2015 2016 2017 2018 2019 2020 2021 2022Source: New York Board of Trade, Commodity Futures Trading Commission, and the Conference Board.Figure 16.9090VIX: S&P m02001 2002 2003 2004 2005 2006 2007 2008 2009 2010 2011 2012 2013 2014 2015 2016 2017 2018 2019 2020 2021 2022Source: Chicago Board Options Exchange.Page 9 / June 16, 2021 / Stock Market Indicators: Fundamental, Sentiment, & TechnicalYardeni Research, Inc.www.yardeni.com
VolumeFigure 17.100100VIX: NASDAQ 2019202020212022Source: Chicago Board Options Exchange.Figure 18.1212NEW YORK STOCK EXCHANGE WEEKLY VOLUME(billion shares, 4-week moving average)52-week moving average1088yardeni.com10666/1144221999 2000 2001 2002 2003 2004 2005 2006 2007 2008 2009 2010 2011 2012 2013 2014 2015 2016 2017 2018 2019 2020 2021 2022Source: Wall Street Journal and Haver Analytics.Page 10 / June 16, 2021 / Stock Market Indicators: Fundamental, Sentiment, & TechnicalYardeni Research, Inc.www.yardeni.com
Dow TheoryFigure 19.3600033000300006/16DOW JONES STOCK AVERAGES(ratio ls (DJIA)11000Transportation ni.com600020002000 2001 2002 2003 2004 2005 2006 2007 2008 2009 2010 2011 2012 2013 2014 2015 2016 2017 2018 2019 2020 2021 2022Source: The Wall Street Journal.Figure 20.680058001300S&P 500 STOCK INDEXES11006/16(ratio scale)4800Industrials Composite*3800Transportation 212022* S&P 500 excluding Financials, Transports, and Utilities.Source: Standard & Poor’s.Page 11 / June 16, 2021 / Stock Market Indicators: Fundamental, Sentiment, & TechnicalYardeni Research, Inc.www.yardeni.com
S&P 500 Moving AveragesFigure 21.45004000S&P 500 INDEX: 2008-2020*45006/164000(log 5001500S&P 500 (4223.7)50-day moving average (4179.8)10001000200-day moving average (3806.5)-16.0%(70)-56.8%(517)-9.8% -7.7%-5.8%-12.4%(28)(62)(19)(96)-19.4% 201120122013201420152016201720182019202020212022* Dips are declines of less than 10%. Corrections are declines of 10% to 20%. Bear markets are declines of 20% or more. Number of days in parentheses.Source: Standard & Poor’s Corporation.Figure 22.302530Latest (11.0)S&P 500 INDEX(as a percent of 200-day moving 7)-9.8% -7.7%-5.8%-12.4%(28)(62)(19)(96)-19.4% 9202020212022Note: Corrections are declines of 10% or more, while minor ones are 5%-10% (all in blues shades). Bear markets are declines of 20% or more (in red shades).Number of calendar days in parentheses.Source: Standard & Poor’s.Page 12 / June 16, 2021 / Stock Market Indicators: Fundamental, Sentiment, & TechnicalYardeni Research, Inc.www.yardeni.com
S&P 500 Moving AveragesFigure 23.46004200S&P 500 INDEX*460042006/1638003800Latest price: 4223.7050-dma: 4179.85200-dma: 0140010001000( ) Latest price is 1.0% above the 50-dma.( ) Latest price is 9.9% above the 01420152016201720182019202020212022* Ratio ScaleSource: Standard & Poor’s.Figure 24.252025S&P 500 INDEX TECHNICALSTHE DEATH CROSS & THE GOLDEN CROSS20(50-dma relative to 200-dma, percent, 99010305070911131517192123Source: Haver Analytics and Standard & Poor’s Corporation.Page 13 / June 16, 2021 / Stock Market Indicators: Fundamental, Sentiment, & TechnicalYardeni Research, Inc.www.yardeni.com
S&P 500 Sectors Stock Price Index & 200-dmaFigure 25.48004100340027006/16S&P 500*(price indexes)6/16HEALTH CARE8252000525130060022506 07 08 09 10 11 12 13 14 15 16 17 18 19 20 21 22325275225172514251125COMMUNICATION SERVICES6/1606 07 08 09 10 11 12 13 14 15 16 17 18 19 20 21 2506 07 08 09 10 11 12 13 14 15 16 17 18 19 20 21 22CONSUMER DISCRETIONARY*6/1606 07 08 09 10 11 12 13 14 15 16 17 18 19 20 21 22INFORMATION 017506 07 08 09 10 11 12 13 14 15 16 17 18 19 20 21 22CONSUMER STAPLES6/1606 07 08 09 10 11 12 13 14 15 16 17 18 19 20 21 22MATERIALS6/16300425200300175115095075010006 07 08 09 10 11 12 13 14 15 16 17 18 19 20 21 2206 07 08 09 10 11 12 13 14 15 16 17 18 19 20 21 22REAL 8756754756005004004006 07 08 09 10 11 12 13 14 15 16 17 18 19 20 21 22FINANCIALS6/1606 07 08 09 10 11 12 13 14 15 16 17 18 19 20 21 22UTILITIES6/16400325250275175Includes Real Estatethrough September 2016yardeni.com7506 07 08 09 10 11 12 13 14 15 16 17 18 19 20 21 2210006 07 08 09 10 11 12 13 14 15 16 17 18 19 20 21 22200-day moving average* S&P 500 sector price indexes on ratio scales.Source: Haver Analytics and Standard & Poor’s Corporation.Page 14 / June 16, 2021 / Stock Market Indicators: Fundamental, Sentiment, & TechnicalYardeni Research, Inc.www.yardeni.com
S&P 500 Sectors Stock Price Index Minus 200-dmaFigure 26.45806040S&P 500(price index as percentage of 200-dma)HEALTH CARE3015206/166/1600-20-15-40% from 200-dma (11.0)-6040(8.4)-3006 07
DOW JONES INDEX vs. BULL/BEAR RATIO OF 3.0 OR MORE* (ratio scale) 6/9 yardeni.com * Red shaded areas indicates Bull/Bear Ratio equal to or greater than 3.0. Source: Wall Street Journal and Investors Intelligence. Figure 9. Bull/Bear Ratio Over 3.0 Page 5 / June 9, 2021 / Stock Market Indicators: Fundamental, Sentiment, & Technical www.yardeni.com
