Transcription
Available online at www.sciencedirect.comProcedia Engineering 41 (2012) 1727 – 1734International Symposium on Robotics and Intelligent Sensors 2012 (IRIS 2012)Production Flow Analysis through Value Stream Mapping: A LeanManufacturing Process Case StudyRahani AR*, Muhammad al-AshrafFaculty of Mechanical Engineering Universiti Teknologi MARA,40450 Shah Alam, Selangor, MalaysiaAbstractClick ‘Lean’’ approach has been applied more than frequent in many manufacturing management floors over these few decades. Startedin the automotive industry, sequential improvement initiatives were implemented to enhance the manufacturing practice changes. Theteam described a case where Lean Production (LP) principles were adapted for the process sector of an automotive part manufacturingplant. Value Stream Mapping (VSM) is one of the key lean tools used to identify the opportunities for various lean techniques. Thecontrast of the before and after the LP initiatives in determine managers potential benefits such as reduced production lead-time and lowerwork-in-process inventory. As VSM involves in all of the process steps, both value added and non-value added, are analyzed and usingVSM as a visual tool to help see the hidden waste and sources of waste. A Current State Map is drawn to document how things actuallyoperated on the production floor. Then, a Future State Map is developed to design a lean process flow through the elimination of the rootcauses of waste and through process improvements. An Implementation Plan then outline details of the steps needed to support the LPobjectives. This paper demonstrates the VSM techniques and discusses the application in an LP initiative on a product (Front disc, D45T)case study. 2012 The Authors. Published by Elsevier Ltd. Selection and/or peer-review under responsibility of the Centre ofHumanoid Robots and Bio-Sensor (HuRoBs), Faculty of Mechanical Engineering, Universiti Teknologi MARA.Keywords: Lean manufacturing; Lean Production; Value stream mapping; Kaizen, Gemba1. IntroductionLean manufacturing is one of the initiatives that many major manufacturing plants in Asia, especially in Malaysia havebeen trying to adopt in order to remain competitive in an increasingly competitive global market. The focus of the approachis on cost reduction through eliminating non value added activities via applying a management philosophy which focusedon identifying and eliminating waste from each step in the production chain respective of energy, time, motion andresources alike throughout a product’s value stream, known as lean. Since the birth of Toyota Production System, many ofthe tools and techniques of lean manufacturing (e.g., just-in-time (JIT), cellular manufacturing, total productivemaintenance, single-minute exchange of dies, production smoothing) have been extensively used. This activity is moretowards to Toyota Production System (TPS), a systematic approach to identify and eliminate waste activities throughcontinuous improvement. All these effort is objectively to keep cost down and stay ahead in the race.The paper begins by providing a brief synopsis on the principles applied in this study followed by the backgroundinformation on the work conducted in the project. In general view, Lean Manufacturing (LM) is an arrangement oftechniques and activities for running a production industries or service operation. Depending on the application, the* Rahani AR. Tel.: 06-03-55435224; fax: 06-016-2211726.E-mail address: rahani@salam.uitm.edu.my1877-7058 2012 Published by Elsevier Ltd.doi:10.1016/j.proeng.2012.07.375
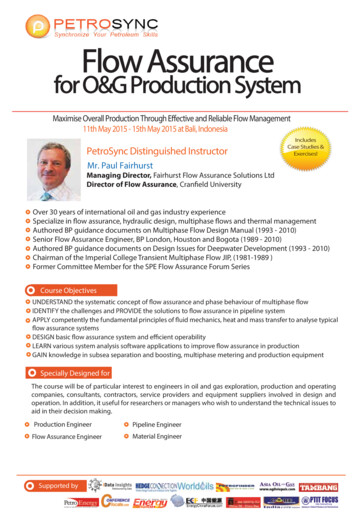
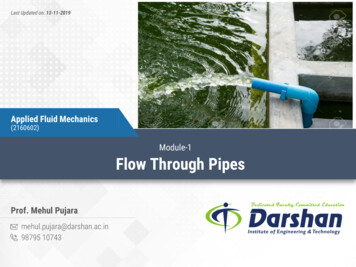
1728Rahani AR and Muhammad al-Ashraf / Procedia Engineering 41 (2012) 1727 – 1734techniques and activities would respectively differ accordingly. Nevertheless, they have the same core principle: theelimination of all non-value-adding activities and waste from the business. Types of waste that outlined in the projectinclude the following 7 Muda [1]. Lean was chosen as the key ingredients in the improvement program objectively to suitthe purpose of waste removal. Lean application is guided by 5 simple steps starting from identifying the value of process,identifying the process value stream, focusing on the process flow, configurations of the pull factor and work towardsprocess perfection [2]. The most regular quality gurus such as Toyoda, Shigeo Shingo, and Taiichi Ohno are thoseresponsible in formulating a new, disciplined, process-oriented system, which is known today as the ‘‘Toyota ProductionSystem,’’ or ‘‘Lean Manufacturing’’[1]. By applying tools that could identify major sources of waste, and then using toolssuch as production smoothing approach, setup time reduction and others to eliminate waste, the project team applied thefollowing related lean tools such as Kanban, Total Preventive Maintenance (TPM), Setup time reduction, Yamazumi chart,Total quality management (TQM), 5S and VSM: A collection of all actions (value added as well as non-value-added) thatare required to bring a product through the main flows.The objective of this project is to use a case-based approach to determine how lean manufacturing tools are utilized tohelp the process industry eliminate waste, maintain better inventory control, improve product quality, and capable of betteroperational control. A Small Medium Industries (SMI) is a local company referred to demonstrate the approach followed isreferred to as SMC throughout this paper. In SMC, the team adopted VSM to map the current operating state for SMC. Incase of before LP is implemented, VSM mapping is used to identify sources of waste and to discover the appropriate leantools for reducing the waste. A later map is then established to highlight the improvement in the area and the applied leantools.2. Methods2.1. Process Review and Data CollectionPrior to LP implementation, a process review on D45T was conducted to investigate the existing method of its actualassembly processes through direct observation. Hardcopy information on actual manufacturing activities are based on theirOperations Manuals and the Standard Operating Procedure (SOP). The Cycle Time or Processing Time measured is as perSMC manufacturing data collected from Production In-process Quality Control (QC) for the past 3months were compiled inorder to establish the baseline for data analysis. Further to that, line observation was conducted to monitor and to grasp fullunderstanding on the current practice at the assembly line as well as to identify types of wastes in the process. Changeovertime, transportation time, queuing, handling and machine time data were tabulated during the first month of the monitoringperiod. Method to establish VSM is presented though the following; Data of Cycle time or processing time Data of Changeover time. Initial data collection on overall cycles times, waste time, in-process queue time. Data gathering for % rejects and work-in-process Gemba Establishing VSM Kaizen initiatives Monitoring and improvised.2.2. VSM – The mapping ProcessValue stream mapping (VSM) is an effective tool for the practice of lean manufacturing. VSM approached the entireprocess flow in a three-step methods [4] in which first producing a diagram showing the actual material and informationflows or Current State on how the actual process operates. This is created while walking down the production line.Secondly, a Future State map is produced to identify the root causes of waste and through process improvements that couldgive great financial impact to the process, a lean process flow. These improvements are then carried out, the ImplementationPlan as part and partial details and action needed to gain the project objectives in process kaizen (continuous improvement)and poka-yoke [3]. Figure1[5] shows a map of a simple value stream. This example is a material-flow-only value streammap. A weekly truck shipment of material is kept as inventory for 5 days before being assembly and inspected. Assemblyprocess and inspection activities are being captured in the data box. Complete products are kept for another 30 days in theinventory before is scheduled for delivery.
Rahani AR and Muhammad al-Ashraf / Procedia Engineering 41 (2012) 1727 – 17341729Fig. 1. Example Value Stream Mapping Common Icon2.3. VSM Implementation and Kaizen activitySMC and the kaizen group studied the Current State map onto the D45T assembly line. A set of kaizen activities initiatedand implemented in effort to optimize the productivity of the assembly line. The assembly process is monitored and duringthe monitoring phase, continuous evaluation on any discrepancies or imperfections on product are being addressedimmediately. Necessary counter measures are made to ensure the effectiveness of the new Future state VSM and lineproductivity stability is achieved.2.4. Performance analysis.This analysis was conducted by comparing performance of the assembly line before and after the implementation of thekaizen in terms of output per man hour and backlog quantity on daily basis.3. Case Study3.1. Company and Process BackgroundCompany that the team referred to SMC is involved in Malaysia-Japan Automotive Industries Cooperation (MAJAICO)Project since 2006. Currently SMC has successfully commenced the mass production and delivery of 50% entity forPerusahaan Otomobil Kedua Sendirian Berhad (PERODUA) and 50% entity for Perusahaan Otomobil Nasional(PROTON). Some examples of the engine components produced include water pump pulley, intake manifold, cap camshaft,flywheel assembly, stopper body assembly, rocker arm assembly and oil filter bracket. Part of transmission componentshowever includes the shift rail assembly, reverse shift lug and the clutch release fork assembly. The brake component partlyincludes the front hub, brake caliper assembly, brake drum and the front disc.The management had selected a major product order, front disc assembly named D54T. After two years, product FrontDisc D54T, SMC failed to achieve their daily production forecast. The management proposed lean approach as mode totackle the issue of eliminating waste, to better maintain their inventory control, improve product quality, and capable ofbetter operational control. The data and information provided by the case study on D45T can enable the management tocompare the expected performance of the lean system relative to that of the existing system it is designed to replace.3.2. Product Process FlowProducing D45T consist eight operation machines in its assembly line. Every machine has different process. Twooperators are required to operate on the production floor. Raw material will be placed on the bar stock is called stocker onthe machine labeled as OP1, a Muratec MW200. This machine is an auto-machine where the operator handling is requiredonly during the time of loading and unloading of the bar stock. Raw material will go through rough facing and rough boringprocess on the front face of part. The stocker can accommodate up to 80 pieces bars at one loading. Next is machinedlabeled as OP2 and OP30. The loading and unloading to OP2 is made by an automatic loading arm, a programmable motionloader placed next to the OP2 machine. Same machine as OP1, but in a different work space, part will be reversed to makeroom for machining process at the back face of part. The process includes rough facing, turning, chamfering and finishturning. Once completed, the loader will unload part and load onto machine OP3, a different type of machine; MURATECMS100 completed the process of finish turning, finish boring and finish facing on both part surfaces. Parts are beingmachined continuously on OP1 to OP2 and to OP3 with each machine with its own cycle time.Once OP3 completed its task, part will be transferred manually for threading process on OP4. OP4/1 is a Fanuc Robodrillmachine while OP4/2 is using KIRA VTC 309. The requirement for two separate machines to carry out this process isbecause of the long machining time of this process. Whenever the processes accumulate too much work-in-progress (WIP),
1730Rahani AR and Muhammad al-Ashraf / Procedia Engineering 41 (2012) 1727 – 1734loader on existing OP3 which is equipped with a sensor shall automatically stop machine OP1, OP2 and OP3. The operatorshall need to wait to unload parts onto these machines.For grinding process, the part shall go through machine OP5, a DAISHI SEIKI Grinding machine. The second operatorshall be involved hereon. Part will be grind on the front face to get the smooth and good finish surface. Next, part shall betransported to an OP6, a KATAOKA washing machine, a machine used to wash the part that is contaminated with coolantfrom previous machining processes. It is important to remove the coolant as it can cause chemical contamination that maydamage the part during measuring processes. Next process, the measuring process through a measuring machine that is verysensitive to chemical reactant. Any presence of chemical trace will break the programming function of the machine.OP7 consist of a MARPOSS type machine which is a measuring machine that measures the diameter of part, the drilledholes diameter, height and length after finish process turning, boring, chamfering, drilling, taping, and grinding. OP8, is aHanbando type machine where the part will undergo balancing process to measure the stability and accuracy of part beforeassemble at car.3.3. Current D45T dataObservations and measurement of production achievement was measured for 30 days in the first month of monitoringperiod. The data are summarized as exampled in the following Table 1.Table 1. Manufacturing Data of D45T Assembly Line in January 2011No12DescriptionPlanningShiftDayJan 04504504504508403Total planningPcs4504504504Total producedPcs720900840008709009009005Attainment 0.36-082.8789.3388.2290.4446.90The total production output for January 2011 was at a volume of 18,210 units of D45T. The average productionattainment for January 2011 was at 87.4%. SMC looked into the production daily report and the 13.6% short of planincluding the 3% rejects.3.4. Gemba and Current State MapPart of practicing Lean is to walk and head out to the floor, to be able to assess how well SMC is doing. It is part of the“Check” in the Plan-Do-Check-Action continuous improvement cycle. Walking the gemba allows the team to see issues,clearing them, finding their causes, and next step is to work into solving them.To create a current state map, the team collected the data and information by walking the flow and interviewing theoperator who perform the individual task. The advantage in walking the flow is useful way to create the map rather thansumming up the information gathered in office meetings and discussion. Secondly, the team had the chance to view theentire process themselves and look out for waste. During interviews the operators, assemblers or technicians can provideanswer questions and further clarify any misconceptions or prejudiced views on how tasks are performed. The drawing ofthe VSM mapping is based on the simplified application by Sean M. Gahagan (2012) which accumulated all details in asimpler manner. The key elements available in the Value Stream that are documented on the map establish the sequence ofthe following details [6]:i.ii.iii.iv.v.vi.The Customer (and the customer’s requirements i.e delivery frequency)Main Process Steps (in order, including undocumented work)Process Metrics (Process Time, Wait Time, First Time Quality)Supplier with Material Flows (using a value stream walk-through)Information & Physical Flows (how each process prioritizes work)Overall Performance of the value stream (e.g. Total Lead Time)
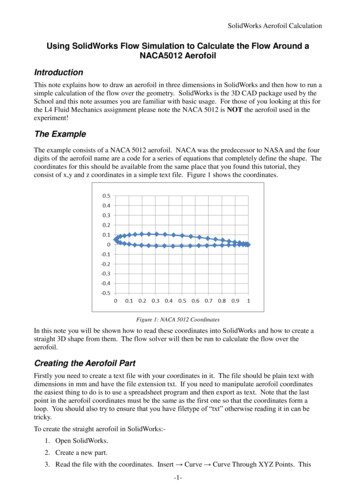
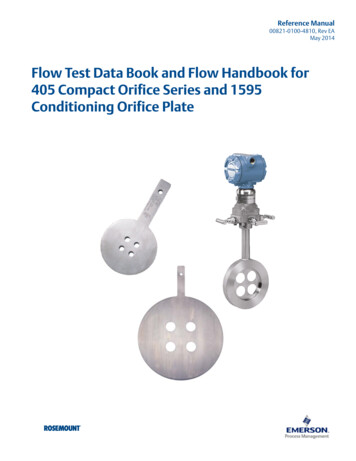
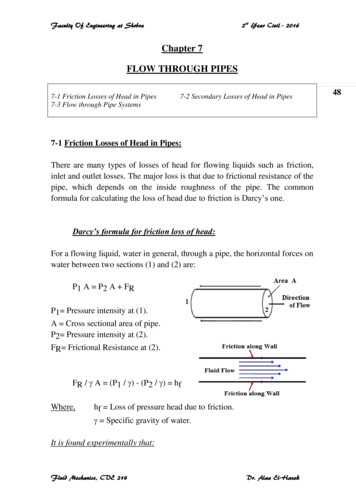
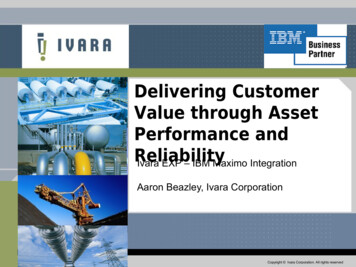
1731Rahani AR and Muhammad al-Ashraf / Procedia Engineering 41 (2012) 1727 – 1734The process object consists of small boxes in the map represent the process and the number inside the box displays thenumber of workers at each process. Also, each process has a data box below, which contains the process CT, and the COtime. Figure 2 represents the Current Map of D45T which was completed right after the plant floor visits and interviews.Fig.2. D45T current state mapAt the bottom of the current state map is the timeline summative indicator. It represent production waiting time (in days),which is obtained by summing the lead-time numbers from each inventory triangle before each process.a)b)Figure 3: Schematic Layout: a) Existing process layout, and b) Improvised process layoutThe CT for each process is the average CT, which was determined by using actual data from the company. To reduce theNon Value Added activities which was obvious in OP4/1, OP4/2, OP5 to OP6, the new improvised process flow wasintroduced and the before and after process flow changes made are as shown in Figure 3b.3.5. Work measure – Takt timeDrawing the Future State Map target for a lean flow through the production line and the elimination of the root causes ofthe wastes identified. Once the Key characteristics of the Future State are identified and in progress are reviewed with thetop management to obtain input and gain mutual agreement on the direction of the Future State. Looking at the current state
1732Rahani AR and Muhammad al-Ashraf / Procedia Engineering 41 (2012) 1727 – 1734map for SMC several things showed up: (a) intermediate inventories between machines, (b) the difference between the totalproduction lead-time (54 seconds) and the value added time (54 seconds), which is under 10% of the total, and (c) nonsystematic manual handling. Therefore, to create an ideal future state map the team try to identify lean manufacturing toolsto drive these down, apart from looking at the schedule across the D45T production line. The team followed a system ofseries of structured questions; to allow them to critic and produce an ideal future state map that will help in eliminating or atleast reducing different types of waste in the current manufacturing system. The questions involved during the walk-abouton the production flow were based on the following targets;Question 1: What is the Takt time?Question 2: What are the bottleneck and constraints found?Question 3: Where can inventory (or queue time) be reducedQuestion 4: Where can you improve flow?Question 5: Potential process improvement for future state designFrom the German word, takt is the word for the wand a conductor uses to control his orchestra’s speed, beat and timing.In manufacturing, it refers to the frequency of a part or component must be produced to meet customers’ demand. Theformula applied in the takt time calculation is the time available (per shift) divided by the demand (per shift). For example:22,000 seconds (time available) 200 pieces (demand) 110 seconds/piece.This takes into account average productive, working time of manufacturing process. The importance of measuring takt timeis due to the costs and inefficiencies factors in producing ahead of demand, which include: Storage and retrieval of finished goodsPremature purchasing of raw materialsPremature spending on wagesThe cost of missed opportunities to produce other goodsCapital costs for excess capacityFor D45T production line, volume demands changes slightly every month. It means the takt time is also changing. Thetable below showed the takt time production of Front Disc D54T September to December 2011. Calculation refers on 2shifts with total of 16.5 working hours per day.Table 2. Time study of previous compared to the new D45T process lineMachineInitialOP10OP 20OP 30OP40/1OP40/2OP 50OP 60OP 70OP 80TotaltimeMan time (s)00018.7520.4615.2822.128.019.7894.4Machine time story data referred includes the set-up times and the machine process time and the individual processing data. Withreference to D45T workflow, operators and machines referred are as according to the current layout. With reference toFigure 5 below, Operator 1 involved directly with OP6, OP7 and OP8 while Operator 2 involved mainly with OP3, OP4/1,OP4/2 and OP5.a)Bottlenecks or constraintsIn determining the presence of bottlenecks or constraints in the line, at any point where the CT is more than the takt time,the process is potential a candidate, this could cause work in progress (WIP) or extra processing time. CT in this productionline is the period required to complete one of an operation, or to complete a function, job, or task from start to finish. Cycletime is used in differentiating total duration of a process from its run time. In manufacturing, cycle time is the total it takesto produce an order.Cycle Time (CT) Machine Time Man TimeAll information is respectively connected and shows the scheduled planning independently. Total man and machine timeof previous process layout and machining method showed total of 443.75s time consumption to produce a unit of D45T.
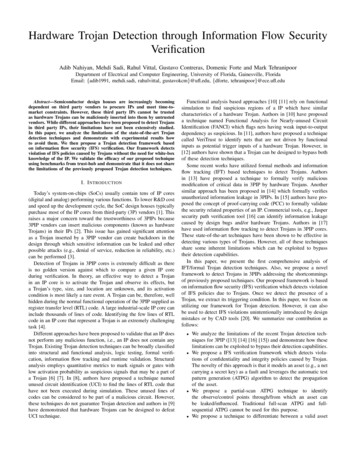
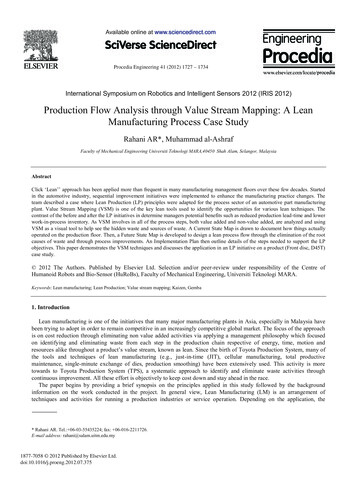
Rahani AR and Muhammad al-Ashraf / Procedia Engineering 41 (2012) 1727 – 173417334. Assessment and ResultsThe goal of the project was to identify the potential advantage from implementing of lean and to develop a pleasantfuture state map. The team focused on three lean manufacturing techniques of which productions leveling throughminimizing process WIP, improvement of takt time and minimizing handling to eliminate or at least reducechangeover/handling time.4.1. StackingObservations showed that stacking of parts on the conveyor after machining completed is one of the major problems thatcan see in the production line. Stacking effected the part quality as it caused dented and scratches. As a result, a quick fixsolution was implemented whereby a warning signage at the area production line was produced as reminder to operators sothey are warned not to repeat the action and briefing on the effect of stacking and non-conformance issue with respect todeterioration on quality of product was delivered by the respective supervisors.4.2. Work in Progress (WIP)One of factors to maintain the quality product is to reduce or eliminate WIP. For each machining processes, everymachines have their own standard or limit WIP at transfer conveyor. If the WIP are over the limit allowed, the line willautomatically brought to a stop hence at the end of the day; the production line cannot produce the product according to thecapacity planning. Secondly, the method applied in positioning the line WIP was also being observed. Poor positioningcould cause damage to the product thus be rejected for poor quality. Figure 4 described both conditions of stacking and WIPcontrol. As a result, the team came up with a stand to put finish good rack. The main function for this stand exactly is tomake work easier to operator. It was ergonomically designed with an adjustable height to eliminate the back pain ofoperator during loading of the finish good into the rack.a)b)Figure 4. (a) Resolving stacking issue on the conveyor (b) Proper and limited stacking for WIP4.3. Process Cycle Time (CT)The cycle time of one machine is according to man time and machine time. When both this time is added it will becomecycle time and from cycle time, it will affect the capacity output of one machine. From the study of time measurement ofboth operators, the process work flow for operator 1 and 2 and the capacity of the production line, the overall capacityoutput of current D45T can be shown in the following Table 2. Jig and fixtures is the most important part in machine. Itused to hold part in machine and in the same time, design of jig is according to the area that raw material wants to bemachining. During the assessment, it is monitored that the operator spent too long time at station OP4/2 machine to load andunload part. This resulted in having high value of man time. At the same station, it was also observed that the man time istoo long (idle time) due to the movement of operator when unloading part from machine and he had to turn back to OP3conveyor to pick up a fresh part. These motions are wasting the operator time and increase the handling time (waste) furtherthan required. To resolve the matter, the team separated the process on OP40/1 to drilling only and OP40/2 to do tapping.The result showed that the work flow became a one direct flow instead of a zigzag motion process. This eased the operatormovement and able to control the quality and productivity of worker and product.From the separation of OP4/1 and OP4/2 to become dedicated rather than sharing, controlling stacking and conveyorsystem, the new CT was measured and tabulated as in the following Table 3.
1734Rahani AR and Muhammad al-Ashraf / Procedia Engineering 41 (2012) 1727 – 1734Table 3. Time study of previous compared to the new D45T process lineMachineInitialMan time (s)Machine time (s)OP40/1OP10OP 20OP 300007.0933.1146.5534.9933.69OP40/2TotaltimeOP 50OP 60OP 70OP 99.83The total reduction of man time was at 15.99s or 16.9% while the machine time was reduced to 299.832s or 14.17%compared to original processing method.4.4. Work InstructionWork Instruction, Standard Work or Standard Operating Procedure (SOP) is the method that effective iteration of thecombination of manpower, materials and machinery, and methods. The stations in D45T production line do have SOPshowever, the operator have limited access to read them due to machine blocking their views. Secondly, the standard of theSOP available on the floor is questioned in terms of their effectiveness towards the operators’ quality of work. The fadedcondition, small lettering and lack of pictorial guide made the SOP less important to the operators. New updated SOP wereestablished and located on a stand within the operator view range. Pictures were added into the SOP to ease operatorsunderstanding and comprehension.ConclusionsThe use of the VSM improved the approach in LP initiatives as it reveals obvious and hidden waste that affected theproductivity of D45T production. There is a significant amount of the time products spent on the production system usuallywas waiting and non-value added. Quantitative evidence showed that many of the Lean tools have an expected impactrelated to the reduction of this waiting time. The evaluation of these improvements through the use of the CT evaluationhighlights the economic impact of time improvements. The VSM applied to assess the expected impact of a change in theproduction process resulted in savings (lower rejection rates) and to a certain extent, a positive view was due to the fact thatthere were substantial gaps between standardized work and real work – this gap meant that workers did not follow strictlyassembly standards and improvising the SOP could be a key driver in continuous improvement sustainability on theproduction floor as operators are fully aware on the long-term commitment to practice Lean.AcknowledgementsProject was conducted in SMC and the team would like to complement the effort of SMC management in practicingLean and value their support towards employee empowerment and continuous improvement.References[1] Juran, J.M.; Godfrey, A.B., 1999, Juran’s Quality Handbook (5th Edition)[2] Dave Nave, 2002, How To Compare Six Sigma, Lean and the Theory of Constraints - A framework for choosing what’s best for your organization,Quality Progress[3] Fawaz A. Abdulmalek and Jayant Rajgopal, 2007, Analyzing the benefits of lean manufacturing and value stream mapping via simulation: A processsector case study, Int. J. Production Economics 107 pp. 223–236[4] Sean M. Gahagan, 2012, Adding Value to Value Stream Mapping: A Simulation Model Template for VSM, Institute of Industrial Engineers[5] Tony Manos, 2006, Value Stream Mapping—an Introduction, Quality Progress[6] William C. Thorsen, Value Stream Mapping & VM, General Motors Corporation[7] Lixia Chen and Bo Meng, June 2010, The Application of Value Stream Mapping Based Lean Production System, International Journal of Business andManagement, Vol.5 No.6
SMC and the kaizen group studied the Current State map onto the D45T assembly line. A set of kaizen activities initiated and implemented in effort to optimize the productivity of the assembly line. The assembly process is monitored and during the monitoring phase, continuous evaluation on an