Transcription
City of Chesapeake &Chesapeake PublicSchoolsFacilities Master PlanRecommendationsApril 29, 2021ASSESS. PLAN. FUND. BUILD
OUTLINE How did we get here? Current facilityconditionsHow we get ahead: A Facilities MasterPlan (FMP)How the FMP was developedCitizen Steering CommitteeCommunity meetings (5), surveys &feedbackThe FMP recommendationsPhasing the FMP over timeASSESS. PLAN. FUND. BUILD1
HOW DID WE GET HERE?CURRENT FACILIT Y CONDITION SChesapeake Public Schools operates 5.9M squarefeet of schools valued at 2.4B. Schools range inage from brand new to 85 years old, averaging 36.Typically, facilities need major componentreplacement or renovations every twenty years orso starting in their twentieth year. Industrystandards suggest budgeting approximately 2% ofthe total capital renewal value to keep pace withthe repairs and life cycle needs of facilities as theyage. Given the value of CPS school facilities, thisstandard would suggest an average of 34M peryear in capital investment.ASSESS. PLAN. FUND. BUILD2
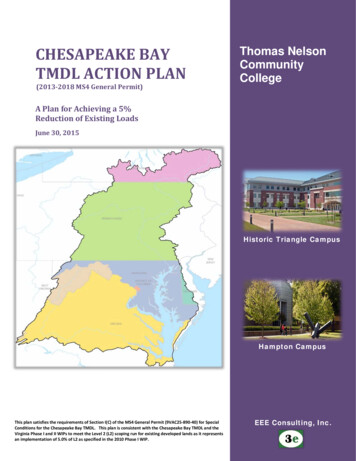
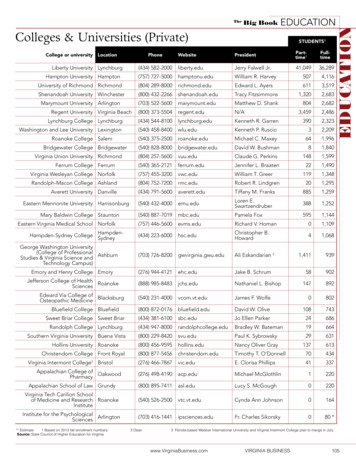
HOW DID WE GET HERE?FCI - Facility ConditionIndex:A numeric score between 0and 1 which quantifies thecondition of a site/building facility or group ofbuilding facilities on thesame site. For the FCI, 0 new and 1.0 exceededuseful life. This score allowsus to compare thecondition of facilitiesagainst other facilities in aschool division and alsoagainst the average ormedian FCI conditions forthe school division.ASSESS. PLAN. FUND. BUILDFACILIT Y CONDITIO N INDE XPOOR CONDITION3
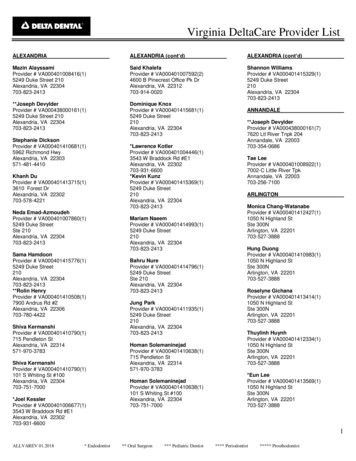
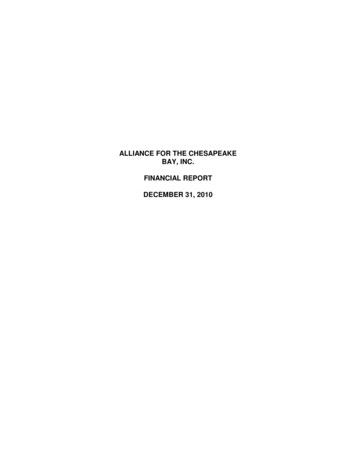
HOW DID WE GET HERE?E D U C AT I O N A L A D E Q UAC Y I N D E XEAI - Educational Adequacy Index:An assessment that rates the various elements ofa school building and school site for how well,or how poorly, they support the desirededucational programs. For the EAI, 100% perfect score and 0% worst possible score.Total possible points for each element:300 Points 200 Points EachASSESS. PLAN. FUND. BUILD100 Points Each4
HOW DID WE GET HERE?TOTA L CO N D I T I O N I N D E XTCI - Total Condition Index:A combination score for each facility that combines condition and educational adequacy. 0 best condition and highest adequacy score possible, and 2 worst condition and lowestadequacy score possible.TCI: 0.00 to 0.70TCI: 0.71 to 0.80TCITCI: 0.81 to 0.90TCITCI: 0.90TCITCI0.81Deep Creek Middle0.82Portlock Primary0.950.82Deep Creek Central Elementary0.96Deep Creek High0.83Rena B. Wright Primary0.960.79Western Branch Primary0.83Western Branch Middle0.99B. M. Williams Primary0.79Great Bridge Middle0.85G. W. Carver Intermediate0.99Greenbrier Primary0.79Greenbrier Intermediate0.85Indian River Middle1.03Butts Road Primary0.80Camelot Elementary0.86Crestwood Intermediate1.05Norfolk Highlands Primary0.86Southeastern Elementary1.06Western Branch Intermediate0.86Chesapeake Alternative School1.07Great Bridge Intermediate0.86Crestwood Middle1.140.69Thurgood Marshall Elementary0.87Chesapeake Career Center1.23Deep Creek Elementary0.70Truitt Intermediate0.90Hugo Owens Middle0.70Great Bridge High0.90Hickory HighGreat Bridge Primary [New 2019]0.00Southwestern ElementaryIndian River High0.36Cedar Road Elementary0.77G. A. Treakle ElementaryOscar Smith Middle0.36Hickory Elementary0.78Grassfield High0.40Sparrow Road IntermediateGrassfield Elementary0.61Western Branch High0.64Greenbrier Middle0.65Hickory Middle0.65Jolliff Middle0.68Oscar Smith HighASSESS. PLAN. FUND. BUILD0.71Georgetown Primary0.00Chittum Elementary [New 2022]0.73Butts Road Intermediate0.945
HOW DID WE GET HERE?CONDITION SUMMARYPriority Condition Needs: 692M 90,267,298 ,13% 264,640,514 ,38% 145,329,541 ,21% 196,685,086 ,28%P1P2P3P4 2.41 billion replacementvalue of all 47 schoolfacilitiesASSESS. PLAN. FUND. BUILD6
HOW WE GE T AHE AD: A FACILITIE S MASTER PL AN (FMP)A Facilities Master Plan (FMP) prioritizes future capital needsto further the District’s educational vision to provide equitableaccess to all students to high-quality learning environments.A FMP identifies major capital projects over the next 10 yearsgiven building conditions, educational adequacy and capacity.Projects are identified and refined over the process by amultitude of stakeholders. Key facility and population data iscollected and analyzed, and future educational opportunitiesenvisioned. Options are then created and critiqued derivingfrom the data and driving toward to the vision.ASSESS. PLAN. FUND. BUILD7
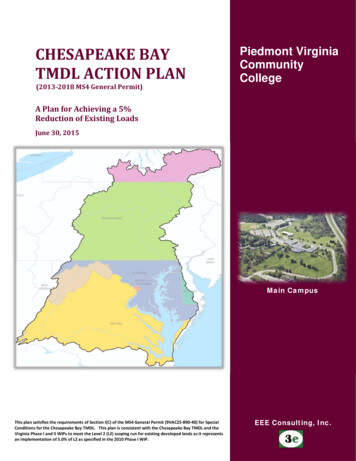
HOW WE GE T AHE AD: A FACILITIE S MASTER PL AN (FMP)Enrollment vs. 39,00037,00035,000ASSESS. PLAN. FUND. BUILD8
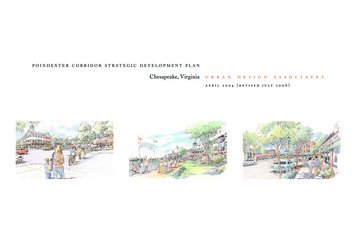
HOW WE GE T AHE AD: A FACILITIE S MASTER PL AN (FMP)Over the past ten years,PK—12 enrollment in CPShas increased by 930students. From the2014-15 to the 2018-19school year, enrollmenthas increased by 1,240students. Based on therecommended projectedenrollment, PK - 12student enrollment in theChesapeakePublic Schools isprojected to increasefrom 40,052 in 2018-19to 44,680 students in2028-29.ASSESS. PLAN. FUND. BUILD9
HOW WE GE T AHE AD: A FACILITIE S MASTER PL AN (FMP)Principles behind Facilities Master Planning.Promotes equity All schools willreceive priorityrepairs with optionscreated to provideequitable access tohigh-quality facilitiesdivision-wideCreated from data,drives towards thevision Options are createdto meet the needs ofeach planning area asidentified by the dataand informed bystakeholdersASSESS. PLAN. FUND. BUILDCommunityengagement materiallyimpacts each step Engagements helpinform the vision,planning priorities,options developed,and the finalrecommendationsTransparencythroughout theprocess The project websiteprovides up-to-datedocuments from theprocess with noticesof upcoming eventsAll options are createdto be “trade-up”scenarios for students No option will beconsidered if it doesnot improve thelearning environmentfor students10
FACILIT Y GOALS TO SUPPORT TE ACHING & LE ARNINGSupport desired transition to K-5 ElementarySchools and away from Primary School andIntermediate School modelIncreased emphasis on Career & TechnicalEducation and Workforce Readiness Programs asalternative or supplemental pathways to collegeEducational Adequacy Improvements (wherestructurally feasible)ASSESS. PLAN. FUND. BUILD11
STEERING COMMITTEE MAKEUPThe Steering Committee was made up of a diverse group of stakeholdersrepresenting all areas of the City. Below is a summary of the SteeringCommittee members. Please see page 51 in the Appendix for the names andaffiliation of all cipals3Military2NAACP1Builders Association1CPS Central Administration7City of Chesapeake Administration 2ASSESS. PLAN. FUND. BUILD12
HOW THE FMP WAS DEVELOPED THE PROCESSFall 2019Condition &EducationalAdequacyAssessmentsWinter 2020OptionsDevelopmentCommunity Dialogue1 (Indian River HS &Western Branch HS)Spring 2020Pause –COVID-19Fall 2020Steering CommitteeMeeting 2City Council/SchoolBoard jectionsCity Council/SchoolBoard Meeting 2Community Dialogue2 (Deep Creek HS &Oscar Smith HS)Steering CommitteeMeeting 4Futures ConferenceSteering CommitteeMeeting 3Winter 2021Final ReportDevelopmentSteering CommitteeMeeting 5Steering CommitteeMeeting 1City Council/SchoolBoard Meeting 1ASSESS. PLAN. FUND. BUILD13
COMMUNITY SURVEYS & FEEDBACKThe City of Chesapeake and CPS held tworounds of Community Dialogues (CD) onNovember 21-22, 2019 & March 11-12,2020. 1,457 survey responses werecollected from the first round of CDs and2,167 from the second.CD 1: What is your level of support inmodernizing career and technical spaces atexisting high schools?Community feedback helped informed theprocess of narrowing down the manypotential options considered during theprocess into a cohesive set ofrecommendations.Covid-19 forced the shutdown of much ofour country on the heels of our secondround of Community Dialogues in March2020. The project website remained openwhile the process was put on hold. Pleasevisit the project website for all reports andmeeting documents relative to the process.ASSESS. PLAN. FUND. BUILD14
T H E F M P R E CO M M E N DAT I O N S P R O J E C T O V E R V I E WThe recommendations for rebuilding andrenovating CPS schools have been dividedinto two phases. The FMP is a living documentand can be modified if the data or visionchanges but should be faithful to both.Phase 1Phase 2 367.9 Million newconstruction / rebuilding 148.2 Million majorrenovations 126.7 Million newconstruction / rebuilding 171.5 Million majorrenovations 24.8 Million priority repairs 112.2 Million priority ation49%NewConstruction24%Phase 1 & 2 RecommendationsASSESS. PLAN. FUND. BUILD15
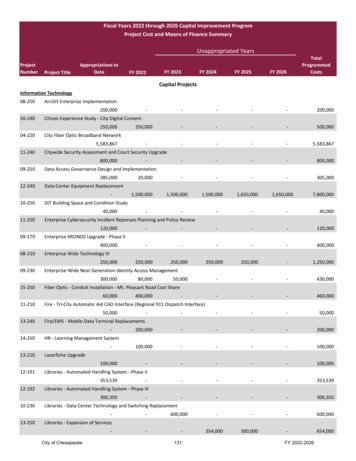
T H E F M P R E CO M M E N DAT I O N S P H A S E 1Phase 1 (years 0-5) - 541M with inflationRough order of magnitude costwith inflationK-2 Addition Greenbrier ISAddition Western Branch PSAddition Western Branch ISMajor Reno Portlock PSMajor Reno / Addition Southeastern ESReplace G. W. Carver ISReplace Truitt ISPartial Reno / Addition Crestwood ISNew Construction Culpepper ES SiteMajor Reno / Addition Indian River MSMajor Reno Crestwood MSMajor Reno Deep Creek HSNew 900 Seat Chesapeake Career CenterReplace Chesapeake Alternative SchoolPriority Repairs AllNew Construction Admin -ASSESS. PLAN. FUND. BUILD 20,000,000 40,000,000 60,000,000 80,000,000 100,000,000 120,000,00016
T H E F M P R E CO M M E N DAT I O N S P H A S E 2Phase 2 (years 6-10) - 410M with inflationRough order of magnitude costwith inflationMajor Reno - SECEP Rena B. Wright PSMajor Reno Deep Creek Central ESReplace Sparrow Road ISNew Construction Clearfield ES SiteMajor Reno Western Branch MSMajor Reno Great Bridge HSPriority Repairs AllNew Construction School Plants Site -ASSESS. PLAN. FUND. BUILD 20,000,000 40,000,000 60,000,000 80,000,000 100,000,000 120,000,00017
E L E M E N TA R Y S C H O O L S C U R R E N TElementary student population is projected to continue to grow, exceeding 100% currentcapacity in 2023-24. Seven schools are identified as needing major renovation or replacementgiven the identified deficiencies and life cycle needs of the facilities when compared to theirreplacement costs. Recommendations focus on building needed capacity while addressingbuilding conditions through rebuilding older, smaller schools in the poorest condition.2028-29ProjectedEnrollment# Schoolsabove 0.66FCISchoolUtilizationBalance # students / capacity TotalCondition vs.BuildingReplacement in millions 296.89 770.70See Page 35-49 of AppendixASSESS. PLAN. FUND. BUILD18
E L E M E N TA R Y S C H O O L S P H A S E 1Phase 1 Recommendations Capacity increased by 1,325 seats 1 new construction elementary school 2 elementary schools replaced on-site 2 elementary schools fully renovatedESMSHSOtherCIP Capacity18,55010,35014,02510043,025ASSESS. PLAN. FUND. ,648104%3636%44,972105%19
MIDDLE SCHOOLS CURRENTMiddle student population is projected to continue to grow, exceeding 100% current capacityby 2028-29. Two schools are identified as needing major renovation or replacement given theidentified deficiencies and life cycle needs of the facilities when compared to their replacementcosts. Recommendations focus on addressing building conditions through rebuilding schools inthe poorest condition.2028-29ProjectedEnrollment# Schoolsabove 0.66FCISchoolUtilizationBalance # students / capacity TotalCondition vs.BuildingReplacement 196.44 in millions 689.32See Page 31 of AppendixASSESS. PLAN. FUND. BUILD20
MIDDLE SCHOOLS PHASE 1Phase 1 Recommendations Capacity increased by approximately 250 seats Renovation and addition to Indian River MS Renovation or replacement to Crestwood MSESMSHSOtherCIP Capacity18,55010,35014,02510043,025ASSESS. PLAN. FUND. ,648104%3636%44,972105%21
HIGH SCHOOLS CURRENTHigh school student population is projected to continue to grow, exceeding 100% currentcapacity between the 2023-2028 school years. Recommendations focus on building neededcapacity through increasing the size of the CCC campus while addressing the poor condition ofthe current CCC campus and renovating Deep Creek HS and in phase two, Great Bridge HS toimprove educational adequacy while addressing building condition needs.2028-29ProjectedEnrollment# Schoolsabove 0.66FCISchoolUtilizationBalance # students / capacity TotalCondition vs.BuildingReplacement 168.55 in millions 905.86See Page 25 of AppendixASSESS. PLAN. FUND. BUILD22
HIGH SCHOOLS PHASE 1Phase 1 Recommendations Replace Chesapeake Career Center on-site with new 900 seat CTE center Full renovation and addition to Deep Creek HSESMSHSOtherCIP Capacity18,55010,35014,02510043,025ASSESS. PLAN. FUND. ,648104%3636%44,972105%23
APPENDIXASSESS. PLAN. FUND. BUILD24
T H E F M P R E CO M M E N DAT I O N S H I G H S C H O O L SHigh schools are currently utilized within an acceptable range but projected to be at 99% utilization in 2023 -24 and104% in 2028-29. Great Bridge and Deep Creek HS along with the Career and Alternative Centers have FCIs above0.65 and low educational adequacy scores, indicating they are potential candidates for replacement or majorrenovation. Of the 198.7M in Priority 1 -4 Capital Renewals, 31% ( 61.6M) are Priority 1 8%2,37099%2,591108%1,966,057 ngAgeSquare FeetCIPCapacityDeep Creek HS35263,4341,7001551,545Grassfield HS12318,1882,400133Great Bridge HS33262,2641,725Hickory HS23249,680Indian River HS35Oscar Smith HSWestern Branch HSSchoolTotalSchoolCapacity2019-202019-20by SqEnrollment UtilizationFeetEducationalPercent CapitalCampusCapital ReplacementAdequacyRenewals thatFCIValueIndexare Priority 1-2Priority 1 CapitalRenewalsPriority 2 CapitalRenewalsDeep Creek HS0.560.52 121,376,66576% 22,863,658 Grassfield HS0.320.74 146,604,45610% Great Bridge HS0.590.46 120,837,59046%Hickory HS0.500.58 115,039,538Indian River HS0.280.70 122,789,779Oscar Smith HS0.460.48 141,570,785Western Branch HS0.430.52Chesapeake Alternative School0.680.44Chesapeake Career Center0.750.36 TotalPriority 3 CapitalRenewalsPriority 1-4 CapitalRenewals6,036,115 2,766,879 - 4,691,100 5,225,698 6,818,076 10,409,903 19,431,754 926,503 37,586,23611% 3,801,075 - 2,537,949 29,604,365 35,943,389- - - 0% - 137,637,8410% - - 14,037,03042% - 3,972,757 32,153,29341% 5,877,332 952,046,97731% 39,360,141 22,226,801 51,361,558 85,794,203 198,742,703ASSESS. PLAN. FUND. BUILD- 4,473,751 Priority 4 CapitalRenewals534,598 - - 120,000 11,643,407 32,829,893 -36,140,40344,593,301 9,065,729 1,560,112 3,821,060 9,065,7299,353,9292,715,792 10,152,221 2,088,674 20,834,01825
COMMUNITY FEEDBACK HIGH SCHOOLSCommunity survey responses indicated strong support for modernizing CTE spaces in general,and for the specific option to rebuild the current CTE center.CD 1: What is your level of support inmodernizing career and technical spaces atexisting high schools?ASSESS. PLAN. FUND. BUILDCD 2: Indicate your preferred order of priorityfor all High School Scenarios/Options.26
T H E F M P R E CO M M E N DAT I O N S H I G H S C H O O L SThe current CTE facility has the 2nd highest FCI in the division, at 0.75, making it more costeffective to invest in a new building than to renovate the existing facility. A new facility will alsoprovide expanded CTE program offerings. The 900-seat capacity will reduce the utilization at allseven comprehensive high schools. There was a high level of support at both communitymeetings for modernizing CTE spaces and replacing the current CTE center.Scenario 1B - Replace Chesapeake Career Center on-sitewith new 900 seat CTE center.ASSESS. PLAN. FUND. BUILD27
T H E F M P R E CO M M E N DAT I O N S H I G H S C H O O L SThe current facility is in poor condition with over 22 million in priority 1 capital renewals, andmany of the classrooms are undersized at 650 square feet. The interior of the existing buildingwould be completely renovated, enlarging the classrooms to current standards. The addition isrequired to keep the school at or near its current capacity, after renovations to enlarge existingclassrooms.Option - Renovation Addition to Deep Creek HSASSESS. PLAN. FUND. BUILD28
T H E F M P R E CO M M E N DAT I O N S H I G H S C H O O L SThe current facility is in poor condition with an FCI of 0.59, and many of the classrooms areundersized at 650 square feet. The interior of the existing building would be completelyrenovated, enlarging the classrooms to current standards. The addition is required to keep theschool at or near its current capacity, after renovations to enlarge existing classrooms.Option - Renovation Addition to Great Bridge HSASSESS. PLAN. FUND. BUILD29
T H E F M P R E CO M M E N DAT I O N S H I G H S C H O O L SThe RecommendationsWhenWhyCost est.Scenario 1B - ReplaceChesapeake Career Centeron-site with new 900 seatCTE center0-5 YearsThe current facility has the 2nd highest FCI in the division, at0.75, making it more cost effective to invest in a new buildingthan to renovate the existing facility. A new facility will alsoprovide expanded CTE program offerings. The 900-seatcapacity will reduce the utilization at all seven comprehensivehigh schools. 93 millionRenovation Addition toDeep Creek HS0-5 YearsThe current facility is in poor condition with over 22 million inpriority 1 capital renewals, and many of the classrooms areundersized at 650 square feet. The interior of the existingbuilding would be completely renovated, enlarging theclassrooms to current standards. The addition is required tokeep the school at or near its current capacity, after renovationsto enlarge existing classrooms. 68.5millionRenovation Addition toGreat Bridge HS6-10 YearsThe current facility is in poor condition with an FCI of 0.6, andmany of the classrooms are undersized at 650 square feet. Theinterior of the existing building would be completely renovated,enlarging the classrooms to current standards. The addition isrequired to keep the school at or near its current capacity, afterrenovations to enlarge existing classrooms. 68.5millionASSESS. PLAN. FUND. BUILD30
T H E F M P R E CO M M E N DAT I O N S M I D D L E S C H O O L SDivision-wide, middle schools are currently utilized within an acceptable range, but projected to be at 105% in 2028 29. However, Indian River is significantly over -utilized and Deep Creek and Great Bridge are moderately over -utilized,with surplus capacity at Greenbrier and Joliff. Crestwood and Indian River MS have FCI scores above 0.65, indicatingthey are potential candidates for replacement or major renovation. Of the 196.4M in Priority 1 -4 Capital Renewals,37% ( 72.1M) are Priority 1-2.SchoolAverageCIP2019-20Building Square FeetCapacity cted ProjectedLive-InLive-InEnrollment Utilization2028-292028-29Projected ProjectedLive-InLive-InEnrollment UtilizationCrestwood MS65121,45962556590%54687%50881%Deep Creek MS51122,714775861111%938121%1,059137%Great Bridge ier MS19201,1641,25092874%85368%91373%Hickory MS20198,8471,5001,30787%1,30187%1,519101%Hugo Owens MS22178,7531,2751,26099%1,303102%1,562123%Indian River MS54120,259625780125%790126%822132%Jolliff MS18190,9431,07573568%67062%70465%Oscar Smith MS10230,0771,0501,066102%1,01797%1,00996%Western Branch 96%10,899105%1,692,194 10,350TotalSchoolEducationalPercent CapitalCampusCapital ReplacementAdequacyRenewals thatFCIValueIndexare Priority 1-2Priority 1 CapitalRenewalsPriority 2 CapitalRenewalsCrestwood MS0.740.45 49,476,86338% 5,568,092 Deep Creek MS0.590.41 49,988,09316% 2,719,015 Great Bridge MS0.600.59 76,298,70849% Greenbrier MS0.480.66 81,945,04888%Hickory MS0.440.51 81,001,2080.50 72,815,8280.44 48,988,0370.56 77,781,47993,722,88757,304,586Hugo Owens MSIndian River MSJolliff MS0.470.660.47Oscar Smith MS0.300.77 Western Branch MS0.620.40 Total 689,322,737ASSESS. PLAN. FUND. BUILDPriority 3 CapitalRenewalsPriority 4 CapitalRenewals3,501,831 29,612,693 6,958,073 7,510,768 17,187,856- 15,785,329 9,326,587 7,170,812 32,282,728 - 16,635,935 305,438 1,892,225 18,833,59815% 2,419,226 3,450,372 12,380,357 18,520,96120% - 2,422,832 3,455,514 6,156,375 12,034,72058% 4,916,720 7,656,732 1,934,177 7,344,118 21,851,7470% - - 15,790,675 1,690,014 17,480,6900% - - 5,105,172 5,105,17234% 3,977,241 4,520,905 11,047,337 23,525,62937% 19,600,2945,748,881 14,793,889 Priority 1-4 CapitalRenewals-271,006 3,980,147 52,500,862- 60,535,629 63,799,009 196,435,79531
T H E F M P R E CO M M E N DAT I O N S M I D D L E S C H O O L SThe current Indian River MS facility has a high FCI at 0.66, and is over -crowded with a 125%utilization in the 2018-19 school year. A major renovation and 24 classroom addition willimprove facility condition and reduce over-utilization.Option 1 – Renovation 24 classroom addition toIndian River MSASSESS. PLAN. FUND. BUILDOption 1 – Replace Chesapeake Center for StudentSuccess (CCSS) on-site (Indian River Annex)32
T H E F M P R E CO M M E N DAT I O N S M I D D L E S C H O O L SThe current Crestwood MS facility has the highest FCI in the division at 0.74, making it acandidate for major renovation or replacement. Further study is needed as to whether torenovate or replace. The cost estimate is based on the replacement value.Option 2a – Renovation/Additions to CrestwoodMSASSESS. PLAN. FUND. BUILDOption 2b – Replacement of Crestwood MS onCrestwood Park Site33
T H E F M P R E CO M M E N DAT I O N S M I D D L E S C H O O L SThe RecommendationsWhenWhyCost est.Option 1 – Renovation 24classroom addition to IndianRiver MS. Replace ChesapeakeCenter for Student Success(CCSS) on-site (Indian RiverAnnex).0-5YearsThe current Indian River MS facility has a high FCI at 0.69, andis over-crowded with a 125% utilization in the 2018-19 schoolyear. A major renovation and 24 classroom addition willimprove facility condition and reduce over-utilization.The CCSS program is located in a building with an FCI of 0.68,making it more cost effective to invest in a new building thanto renovate the existing facility 60 millionOption 2 – Renovation to orReplacement of Crestwood MS0-5YearsThe current facility has the highest FCI in the division at 0.75,making it a candidate for major renovation or replacement.Further study is needed as to whether to renovate or replace.The cost estimate is based on the replacement value. 50 millionOption 2 - Renovation toWestern Branch MS6-10YearsThe current facility is in poor condition with an FCI of 0.64. Amajor renovation will extend the useful life of the building andprovide modernized learning spaces. 39.6millionOption 3 – Rezone portions ofWestern Branch MS to Joliff MS.Rezone portions of Deep CreekMS to area middle schools0-5YearsOverall middle school capacity is sufficient. Rezoning will helpbalance over and under-utilized middle schools across thedivision, without requiring the 12-classroom addition asoriginally proposed for Western Branch MS.ASSESS. PLAN. FUND. BUILD34
T H E F M P R E CO M M E N DAT I O N S N W E L E M E N TA R Y S C H O O L SNorthwest area elementar y schools are currently at 97% combined utilization and projected to reach 104% combinedutilization. Western Branch IS is currently over-utilized at 109%, Chittum ES replacement is planned to open in the2021-22 school year and is projected to have surplus capacity. All area schools have an FCI above 0.5, with theexception of Chittum ES. Of the 27.9M in Priority 1 -4 Capital Renewals, 41% ( 11.5M) are Priority 1 -2.2023-242023-242028-292028-29Projected Projected Projected ProjectedLive-InLive-InLive-InLive-InEnrollment Utilization Enrollment pacity2019-20Enrollment2019-20UtilizationChittum ES stern ES4569,43655053297%54599%53096%Western Branch IS4283,166725788109%965133%939130%Western Branch ority 3CapitalRenewalsPriority ttum ES capacity reflects estimated capacity of replacement school to be completed in ReplacementValueChittum ES (Replacement)0.001.00 44,285,118Southwestern ES0.520.60 24,577,634Western Branch IS0.570.49 29,437,518Western Branch PS0.540.45TotalPercentCapitalRenewalsthat arePriority 1-2Priority 1CapitalRenewalsPriority 2CapitalRenewals - 13% - 1,100,943 4,077,922 3,055,522 8,234,38852% 2,152,451 3,554,999 1,722,573 3,449,082 10,879,106 24,274,64354% 1,878,794 2,858,176 1,978,927 2,116,821 8,832,719 122,574,91341% 4,031,246 7,514,119 7,779,423 8,621,426ASSESS. PLAN. FUND. BUILD- - -Priority 1-4CapitalRenewals - 27,946,21335
T H E F M P R E CO M M E N DAT I O N S N W E L E M E N TA R Y S C H O O L S2023-24 year projected live-in utilization is expected to be 111% at Western Branch Primary and133% at Western Branch Intermediate. 8 classroom additions at each school would reduceoverall area utilization from 104% to 94%.Scenario 1A (modified) – 8 classroom additionWestern Branch Primary School.ASSESS. PLAN. FUND. BUILDScenario 1A (modified) – 8 classroom additionWestern Branch Intermediate School.36
T H E F M P R E CO M M E N DAT I O N S N W E L E M E N TA R Y S C H O O L SThe RecommendationsWhenWhyScenario 1A (modified) – 8classroom additions to bothWestern Branch Primary &Intermediate Schools.0-5 Years2023-24 year projected live-in utilization is expected tobe 111% at Western Branch Primary and 133% atWestern Branch Intermediate. 8 classroom additions ateach school would reduce overall area utilization from104% to 94%.Scenario 1B – Area boundarychanges0-5 YearsArea boundary changes will address over-utilization andutilize excess space at Chittum ES.ASSESS. PLAN. FUND. BUILDCost est. 7.4 million37
T H E F M P R E CO M M E N DAT I O N S N O RT H - C E N T R A LE L E M E N TA R Y S C H O O L SNorth-central area elementar y schools are currently at 101% combined utilization, and projected to reach 112% in2023-24 and 115% in 2028-29. Deep Creek Central ES is the most over -utilized area school, and has the highest FCIat 0.67 indicating it is a potential candidate for major renovation or replacement. Of the 64.6M in Priority 1 -4Capital Renewals, 25% ( 16M) are Priority 1 -2.2023-242023-242028-29Projected Projected ProjectedLive-InLive-InLive-InEnrollment Utilization eBuildingAgeSquareFeetCamelot ES3596,51562544271%49679%51683%Cedar Road ES2385,88087581493%973111%1,022117%Deep Creek Central ES4568,513600779130%920153%941157%Deep Creek ES4173,27077575998%854110%865112%G. A. Treakle ES4572,21857549786%49185%50989%Grassfield 754,402101%4,905112%5,044115%Priority 2CapitalRenewalsPriority 3CapitalRenewalsPriority 4CapitalRenewalsPriority 9-202019-20Capacity Enrollment y ReplacementRenewals thatIndexValueare Priority 1-2Priority 1CapitalRenewalsCamelot ES0.590.54 34,162,54342% 2,018,969 4,338,438 6,440,517 2,329,472 15,127,396Cedar Road ES0.550.60 30,398,1687% Deep Creek Central ES0.660.54 24,250,92840% 1,807,072 2,462,108 2,562,745 3,833,932 10,665,857Deep Creek ES0.460.47 25,934,72035% 1,046,363 G. A. Treakle ES0.570.56 25,562,35311% 101,882 1,015,221 4,281,329 4,619,840 10,018,272Grassfield ES0.430.56 34,034,05517% 174,342,76625% 4,974,286TotalASSESS. PLAN. FUND. BUILD-- 1,057,359 2,537,944 12,554,942 16,150,246939,692 1,634,978 2,076,974 5,698,007 1,183,829 5,225,494 10,996,647 22,683,007523,364 6,932,687 25,938,525 64,592,46438
T H E F M P R E CO M M E N DAT I O N S N O RT H - C E N T R A LE L E M E N TA R Y S C H O O L SThe RecommendationsWhenWhyOption 2 – Build new K-5elementary on Culpepper siteat 900 capacity0-5 YearsElementary utilization in this area is projected to reach113% by 2023-24. A new 900 seat elementary will reduceprojected utilization to 93% and provide a new facility forstudents in the area. This requires rezoning of multipleelementary attendance areas. 39.8millionOption 1 - Renovation toDeep Creek Central ES6-10YearsThe current facility is in poor condition with an FCI of0.67. A major renovation will extend the useful life of thebuilding and provide modernized learning spaces. With anew K-5 elementary on the Culpepper site, a 6-classroomaddition is not needed at Deep Creek Central ES, asrezoning can reduce over-utilization at this school. 16.3milli
Chesapeake Public Schools operates 5.9M square feet of schools valued at 2.4B. Schools range in age from brand new to 85 years old, averaging 36. Typically, facilities need major component replacement or renovations every twenty years or so starting in their twentieth year. Industry standards suggest budgeting approximately 2% of