Transcription
“Fast Food, Diet, and Nutrition AmongAmericans ”Cynthia Ogden, PhDEpidemiologist and Analysis Branch ChiefCDC’s National Center for Health StatisticsApril 20131
Bullet points Obesity levels high in the US‾ Large increases particularly in the 1980s and 1990s Dietary factors play a role‾ Increases in available calories, although recentdecreases in calorie consumption‾ How we eat: eating out, fast foods‾ What we eat: added sugars, beverages2
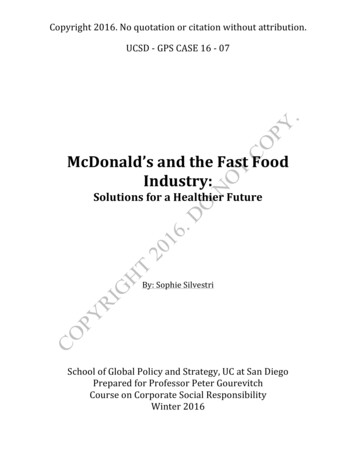
Americans Heavier Today Than in the 1960s40Today nearly 36% of adults and 17% of youth are obesePounds302030 poundsheaviertoday1019 poundsheaviertoday0Average manAverage 11 year old boySources: CDC/NCHS: National Health and Nutrition Examination Survey; www.cdc.gov/nchs/data/ad/ad347.pdf; tp://www.cdc.gov/nchs/data/series/sr 11/sr11 252.pdf (NHESI, NHESII, 2007-2010)3
Obesity increased in 1980s and 1990s inadults; more recently levels have 6-801988-941999-002003-42009-102005-6SOURCE: CDC/NCHS. National Health and Nutrition Examination Survey 1988-194, 1999-2000, 2001-2002, 2003-2004, 2005-2006, 2007-2008, and ity adult 09 10/obesity adult 09 10.htm4
More Calories Available In Our Diet ,00050001970198019902000YearSOURCE: ility-(per-capita)-data-system.aspx#26705; calories adjusted for loss – spoilage and other waste5
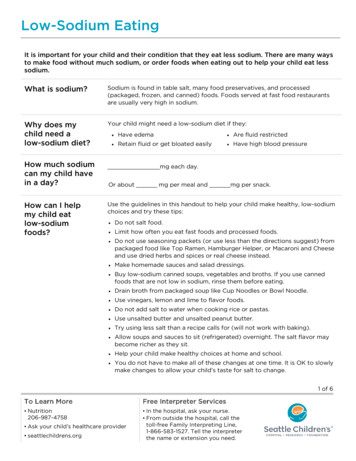
Calories Consumed from Fast FoodDecreases with AgeBothMenWomen25Percent2015.3 15.5 15.11511.3 11.8 10.910.5 11.2 9.7106.0 6.6 5.550Total20-3940-5960 and overAge (years)Source: CDC/NCHS, National Health and Nutrition Examination Survey/What We Eat in America; 2007-2010; Fryar & Ervin NCHS Data Brief .htm6
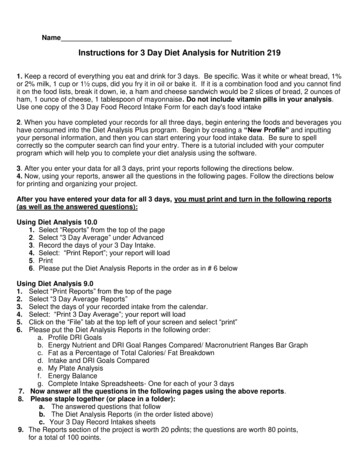
Children’s Diet: Calories From C arbohydratesFat32%Other70%Carbohydrates54%added sugars30%Protein14%Source: CDC/NCHS, National Health and Nutrition Examination Survey/What We Eat in America, 2009-2010; Ervin & Ogden NCHS Data Brief 2013; Ervin et alNCHS Data Brief 2012 http://www.cdc.gov/nchs/data/databriefs/db113.htm; http://www.cdc.gov/nchs/data/databriefs/db87.htm7
Children’s Diet: Added Sugars from Food vs.B everagesBeverages41%Food59%Source: CDC/NCHS, National Health and Nutrition Examination Survey/What We Eat in America, 2005-2008; Ervin et al NCHS Data Brief tm8
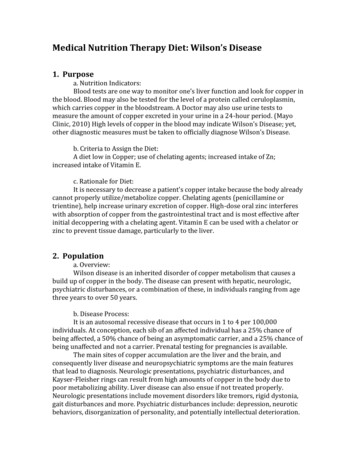
Teen and young adult males consume the highestnumber of calories from s ugar s weetened beverages300273kcal per day252200100178171141112103159malefemale1388671 7070420All2-56-1112-19 20-39Age (years)40-5960 Source: CDC/NCHS, National Health and Nutrition Examination Survey/ Survey/What We Eat in America, 2005-2008; Ogden et al NCHS Data Brief tm9
Higher income individuals consume fewercalories from sugar sweetened beverages% total calories per day109Low income8.2Middle income8.8Higher income8.286.776.2654.4432102-19 years20 yearsSource: CDC/NCHS, National Health and Nutrition Examination Survey/ Survey/What We Eat in America, 2005-2008; Ogden et al NCHS Data Brief tm10
Apr 04, 2013 · “Fast Food, Diet, and Nutrition Among Americans” Cynthia Ogden, PhD Epidemiologist and Analysis Branch Chief C