Transcription
2020
2020
World health statistics 2020: monitoring health for the SDGs, sustainable development goalsISBN 978-92-4-000510-5 (electronic version)ISBN 978-92-4-000511-2 (print version) World Health Organization 2020Some rights reserved. This work is available under the Creative Commons Attribution-NonCommercial-ShareAlike 3.0 IGO licence (CC BY-NC-SA 3.0 3.0/igo).Under the terms of this licence, you may copy, redistribute and adapt the work for non-commercial purposes, provided the work is appropriately cited, as indicatedbelow. In any use of this work, there should be no suggestion that WHO endorses any specific organization, products or services. The use of the WHO logo is notpermitted. If you adapt the work, then you must license your work under the same or equivalent Creative Commons licence. If you create a translation of this work,you should add the following disclaimer along with the suggested citation: “This translation was not created by the World Health Organization (WHO). WHO is notresponsible for the content or accuracy of this translation. The original English edition shall be the binding and authentic edition”.Any mediation relating to disputes arising under the licence shall be conducted in accordance with the mediation rules of the World Intellectual Property Organization.Suggested citation. World health statistics 2020: monitoring health for the SDGs, sustainable development goals. Geneva: World Health Organization; 2020.Licence: CC BY-NC-SA 3.0 IGO.Cataloguing-in-Publication (CIP) data. CIP data are available at http://apps.who.int/iris.Sales, rights and licensing. To purchase WHO publications, see http://apps.who.int/bookorders. To submit requests for commercial use and queries on rights andlicensing, see http://www.who.int/about/licensing.Third-party materials. If you wish to reuse material from this work that is attributed to a third party, such as tables, figures or images, it is your responsibility todetermine whether permission is needed for that reuse and to obtain permission from the copyright holder. The risk of claims resulting from infringement of anythird-party-owned component in the work rests solely with the user.General disclaimers. The designations employed and the presentation of the material in this publication do not imply the expression of any opinion whatsoeveron the part of WHO concerning the legal status of any country, territory, city or area or of its authorities, or concerning the delimitation of its frontiers or boundaries.Dotted and dashed lines on maps represent approximate border lines for which there may not yet be full agreement.The mention of specific companies or of certain manufacturers’ products does not imply that they are endorsed or recommended by WHO in preference to othersof a similar nature that are not mentioned. Errors and omissions excepted, the names of proprietary products are distinguished by initial capital letters.All reasonable precautions have been taken by WHO to verify the information contained in this publication. However, the published material is being distributedwithout warranty of any kind, either expressed or implied. The responsibility for the interpretation and use of the material lies with the reader. In no event shallWHO be liable for damages arising from its use.Photo credits: page 1 WHO / Karen Reidy; page 6 WHO / Lindsay Mackenzie; pages 12, 19 WHO / NOOR / Sebastian Liste; page 23 WHO / Simon LimDesign and layout by L’IV Com Sàrl
CONTENTSForeword. . . . . . . . . . . . . . . . . . . . . . . . . . . . . . . . . . . . . . . . . . . . . . . . . . . . . . . . . . . . . . . . . . . . . . . . . . . . . . .Abbreviations and acronyms.Introduction. .iv. . . . . . . . . . . . . . . . . . . . . . . . . . . . . . . . . . . . . . . . . . . . . . . . . . . . . . . . . . . . . . .v. . . . . . . . . . . . . . . . . . . . . . . . . . . . . . . . . . . . . . . . . . . . . . . . . . . . . . . . . . . . . . . . . . . . . . . . . . . .viKey messages. . . . . . . . . . . . . . . . . . . . . . . . . . . . . . . . . . . . . . . . . . . . . . . . . . . . . . . . . . . . . . . . . . . . . . . . . .1. Major gains in life expectancy in low-income countries. . . . . . . . . . . . . . . . . . . . . . . . . . . . . . . . . . . . . . .2. Fewer maternal and child deaths, and gains against major epidemics. . . . . . . . . . . . . . . . . . . . . . . . . . . .3. Trends in noncommunicable disease mortality and risk factors, and deaths from injuriesand violence. . . . . . . . . . . . . . . . . . . . . . . . . . . . . . . . . . . . . . . . . . . . . . . . . . . . . . . . . . . . .4. Dealing with data challenges. .16. . . . . . . . . . .12. . . . . . . . . . . . . . . . . . . . . . . . . . . . . . . . . . . . . . . . . . . . . . . . . . . . . . . . . .195. High-quality health information and data . . . . . . . . . . . . . . . . . . . . . . . . . . . . . . . . . . . . . . . . . . . . . . . . .Annex 1. Regional highlights of health-related SDG indicators. . . . . . . . . . . . . . . . . . . . . . . . . . . . . . . . . . . .Annex 2. Tables of health statistics by country, WHO region and globally.Annex 3. WHO regional groupings. .vii2327. . . . . . . . . . . . . . . . . . . . . . . . . . . .41. . . . . . . . . . . . . . . . . . . . . . . . . . . . . . . . . . . . . . . . . . . . . . . . . . . . . . . . . .77MONITORING HEALTH FOR THE SDGsiii
FOREWORDI have often said that to make progress, we must be able to measure progress.The Sustainable Development Goals offer a compelling vision of a healthier, safer, fairer world,with concrete targets to work towards across all of the most pressing health challenges of ourtime. Part of realizing that vision knowing where we are, so we can see what we need to do toreach our destination.As part of WHO’s Transformation, we have worked to scale up to reporting country level datafor 46 health-related SDG indicators, which are presented in the World Health Statistics 2020.The 2020 edition finds steady improvements in many key health indicators, while showing that we are still lagging in otherareas. We have made remarkable progress in several important indicators, such as reductions in maternal, neonatal andchild mortality since 2000, but there is still a long way to go to meet the SDG targets.There is mixed news about noncommunicable diseases, the world’s leading causes of death. While the overall rate ofpremature deaths related to noncommunicable diseases has declined in the past two decades, progress has slowed since2010 and key risk factors such as obesity are on the rise.Monitoring progress depends on strong country data and health information systems. There are large gaps in the availabilityof SDG data in many parts of the world. Strengthening country capacity for data and information requires collaborationacross governmental and non-governmental institutions, including ministries of health and finance, national statisticsoffices, offices of the registrar general, local and regional government, and think tanks and academia.One of the key lessons from the COVID-19 pandemic is that we must invest in data and health information systems, aspart of our overall public health capacity, before a crisis strikes. To emerge from this crisis stronger, we must be able tomonitor progress with real-time, reliable and actionable data.Strong health data systems are a core requirement for improving population health outcomes and meeting the SDG healthtargets. WHO is committed to working with the international community to provide support for these critical systems, sothat every country can have reliable, timely, accessible data. Strong health information systems are one of the cornerstonesof our mission to promote health, keep the world safe and serve the vulnerable.Dr Tedros Adhanom GhebreyesusDirector-GeneralWorld Health OrganizationivWORLD HEALTH STATISTICS 2020
ABBREVIATIONS AND ACRONYMSAIDSacquired immunodeficiency syndromeARTantiretroviral therapyCRVScivil registration and vital statisticsDBPdiastolic blood pressureDOTSdirectly-observed treatment, short-courseDTP3diphteria, tetanus and pertussis vaccine (third dose)GHOGlobal Health ObservatoryGPW1313th Global Programme of WorkHALEhealthy life expectancyHIVhuman immunodeficiency virusHPVhuman papillomavirusICD-10International Statistical Classification of Diseases and Related Health Problems (10th revision)IHRInternational Health RegulationsIPVintimate partner violenceITNinsecticide-treated netMDGMillennium Development GoalMMRmaternal mortality ratioNCDnoncommunicable diseaseNSOnational statistics officeNTDneglected tropical diseaseRHISroutine health information systemsSBPsystolic blood pressureSDGSustainable Development GoalTBtuberculosisUHCuniversal health coverageUNUnited NationsUNICEFUnited Nations Children’s FundVAWviolence against womenWHOWorld Health OrganizationWHS World Health Survey PlusMONITORING HEALTH FOR THE SDGsv
INTRODUCTIONThe World health statistics 2020 report is the latest annual compilation of health statistics for 194 Member States.1 Itsummarizes trends in life expectancy and causes of death and reports on progress towards the health and healthrelated Sustainable Development Goals (SDGs) and associated targets. Four indicators of emerging public healthimportance relating to poliomyelitis, hypertension and obesity in adults and school age children have been included.These are part of the WHO’s Thirteenth General Programme of Work 2019–2023 (GPW13), which the 71st World HealthAssembly approved in May 2018.2 The GPW13 is largely based on the SDGs and sets out WHO’s strategic direction until2023.It also assesses the current availability of data for the indicators, and describes the data gaps and WHO’s efforts to supportcountries to improve health information systems. Regional statistics and highlights are provided in Annex 1, while countrylevel statistics for selected health-related SDG indicators are presented in Annex 2, along with the lists of countries in theWHO Regions (Annex 3).Since 2016, the World health statistics reports have been the place to consolidate health and health-related SDGs, whichWHO is tasked with monitoring together with partner UN agencies, as a tool for Member States and decision makers.3123The World health statistics series is produced by WHO’s Division for Data, Analytics and Delivery, in collaboration with WHO technical departments and Regional Offices.Thirteenth General Programme of Work 2019–2023: promote health, keep the world safe, serve the vulnerable. Geneva: World Health Organization; 2019 324775/WHO-PRP-18.1-eng.pdf).The information presented in World health statistics 2020 are based on the data that were available for global monitoring as of March 2020. Those data have been compiled primarilyfrom publications and databases produced and maintained by WHO or by United Nations (UN) groups of which WHO is a member, such as the UN Interagency Group for Child MortalityEstimation. In addition, some statistics have been derived from data produced and maintained by other international organizations, such as the UN Department of Economic and SocialAffairs and its Population Division. The Global Health Observatory database (available at http://apps.who.int/gho/data/?theme main.) contains additional details about the health-relatedSDG indicators, as well as interactive visualizations.viWORLD HEALTH STATISTICS 2020
KEY MESSAGESThe coronavirus disease (COVID-19) pandemic has caused significant loss of lives, disrupted livelihoods andundermined well-being throughout the world. The COVID-19 crises have underscored how unprepared most healthsystems were and the negative impact this can have towards achieving the Sustainable Development Goal (SDGs).These is an urgency to invest in health systems, services and workforce.The 2030 Agenda is a powerful accountability mechanism for the world. It is now more critical than ever to take stockof the lessons learned and progress made in improving population health, and more importantly, to identify and addressthe gaps that persist where progress is not on track.World Health Statistics 2020 sheds light on the progress towards relevant SDGs and their implications in the midst ofthe current COVID-19 emergency. The report highlights the need to track population health and its determinants in acomprehensive and continuous manner. This report’s key messages are presented below.1. The world population is not only living longer but living healthierLife expectancy and healthy life expectancy (HALE) have both increased by over 8% globally between 2000 and 2016, andremain profoundly influenced by income. Despite the largest gains in both indicators being due primarily to the progressmade in reducing child mortality and fighting infectious diseases, low-income and lower-middle-income countries continueto suffer from the poorest overall health outcomes, lagging far behind the global average.To effectively sustain the progress in ensuring longer and healthier lives, timely and effective health policies andinterventions are needed to minimize the potential direct and indirect impact of COVID-19 on life expectancy, due toexcess mortality, and on HALE for populations of different ages, especially among older adults.2. The overall improvements in health move along the fault lines created by inequalities andecho the status and the progress made towards universal health coverageOverall access to essential health services improved from 2000 to 2017, with the strongest increase in low- and lowermiddle-income countries. Yet, service coverage in low- and middle-income countries remains well below coverage inwealthier ones. Due to the serious inadequacy of service coverage in low-resource settings, the overall access to essentialhealth services is still way below optimum. Only between one third and one half of the world’s population was able toobtain essential health services in 2017. The inability to pay for health care poses another major challenge.The COVID-19 pandemic not only draws into focus the need to rebuild resilient health systems with increased accessto quality health services, lowered financial cost and a strengthened health workforce, but also calls for the provision ofservices such as routine vaccinations and basic hygiene and sanitation.3. Compared with the advances against communicable diseases, there has been inadequateprogress in preventing and controlling noncommunicable diseasesRapid epidemiological transition and demographic changes have shifted the disease burden from those that receivedattention in the Millennium Development goals (MDGs) era to noncommunicable diseases (NCDs), particularly in lowand middle-income countries where delivery of effective NCD interventions remains an overwhelming challenge to healthsystems. In 2016, NCDs accounted for 71% of all global deaths, and 85% of the 15 million premature deaths (deathsbetween ages 30 and 70) occurred in low- and middle-income countries.Despite the increase in the proportion of all deaths due to NCDs, the overall rate of NCD-related premature deaths hasbeen declining in the past two decades, but progress has slowed since 2010. Premature mortality from NCD parallels,MONITORING HEALTH FOR THE SDGsvii
and can partly be attributed to, a lack of success in addressing many NCD risk factors. Although tobacco use is steadilydeclining, the prevalence of obesity is on the rise and reduction in harmful alcohol consumption has stagnated globallyand is increasing in some regions.In the event of a health emergency such as COVID-19, patients with pre-existing NCD conditions such as hypertensionand diabetes, become more vulnerable and at higher risk of dying, not only because they are more susceptible to the virusbut also due to the medical resources that have to be directed towards caring for patients with COVID-19. This makesaddressing risk factors to prevent NCDs such as obesity, mental health conditions, in the first place even more crucial.4. Investing in strengthening country health information systems to improve timeliness ofdata could have the greatest positive impact and is vital for countries to monitor progresstowards SDGsAccurate, timely, and comparable health-related statistics are essential for understanding population health trends.Decision-makers need the information to develop appropriate policies, allocate resources and prioritize interventions.For almost a fifth of countries, over half of the indicators have no recent primary or direct underlying data. Data gapsand lags prevent from truly understanding who is being included or left aside and take timely and appropriate action.The existing SDG indicators address a broad range of health aspects but do not capture the breadth of population healthoutcomes and determinants. Monitoring and evaluating population health thus goes beyond the indicators covered inthis report and often requires additional and improved measurements.WHO is committed to supporting Member States to make improvements in surveillance and health information systems.These improvements will enhance the scope and quality of health information and standardize processes to generatecomparable estimates at the global level.Getting accurate data on COVID-19 related deaths has been a challenge. The COVID-19 pandemic underscores the seriousgaps in timely, reliable, accessible and actionable data and measurements that compromise preparedness, prevention andresponse to health emergencies. The International Health Regulations (IHR) (2005) monitoring framework is one of thedata collection tools that have demonstrated value in evaluating and building country capacities to prevent, detect, assess,report and respond to public health emergencies. From self-assessment of the 13 core capacities in 2019, countries haveshown steady progress across almost all capacities including surveillance, laboratory and coordination. As the pandemicprogresses, objective and comparable data are crucial to determine the effectiveness of different national strategies used tomitigate and suppress, and thus to better prepare for the probable continuation of the epidemic over the next year or more.5. Current rate of progress falls short and COVID-19 further risks getting the world off trackto achieve SDGsPrevention and treatment coverage have substantially improved for major infectious diseases, maternal, neonatal and childhealth care, leading to steady decline in incidence and mortality from these diseases in the past two decades. However,the current rate of change is insufficient to reach the 2030 SDG targets. Preserving progress made, constant vigilance,early detection and monitoring, a unified national response (in coordination with global partners) and, rapidly scaling upsolutions for high risk, resource limited and marginalized populations are key to achieve SDGs.viiiWORLD HEALTH STATISTICS 2020
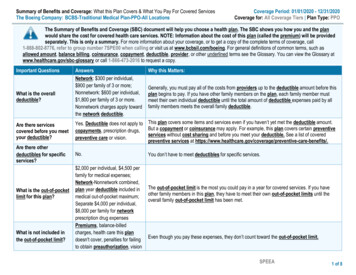
1MAJOR GAINS INLIFE EXPECTANCYIN LOW-INCOMECOUNTRIESSignificant progress towards several health-relatedSDGs increased average life expectancy at birth by5.5 years globally between 2000 and 2016: from 66.5 to72.0 years (1). Many of the health-related SDG indicatorstracked in this report have shown improvements, much ofit reflecting momentum that was built during the precedingMillennium Development Goals (MDGs) era and sustainedsubsequently.1 For several indicators, however, advances arecurrently stalling or are progressing too slowly to achievethe relevant SDG targets.expectancy rose by 18% in low-income countries comparedwith 8% globally over the same period (1).Life expectancy remains profoundly influenced by income:In 2016, it was 18.1 years lower in low-income countries(62.7 years) than in high-income countries (80.8 years).Since 2000, that gap has narrowed somewhat. Lowincome countries have seen the biggest recent gains inlife expectancy: On average in those countries, it rose by21% between 2000 and 2016 (or 11 years), compared with8% (5 years) globally and 4% (3 years) in high-incomecountries (Figure 1.1). In all age groups other than people65 years and older, the biggest decreases in mortality ratesoccurred in low-income countries. Similarly, healthy lifeIn low-income countries overall, fewer than 3 out of 5newborns are expected to reach the age of 70 and morethan one third of all deaths are among children youngerthan 15 years. Premature deaths2 in those countries aredue primarily to lower respiratory infections, diarrhoealdiseases, acquired immunodeficiency syndrome (AIDS),malaria and preterm birth complications. In high-incomecountries, 80% of newborns are expected to live beyondthe age of 70. Ischaemic heart disease, lung cancer andsuicides are the three top causes of premature death in thelatter countries (3).1See section 2.The recent life expectancy gains in low-income countries arelargely due to major reductions in mortality in children under5 years in low-income countries (1), a reduction of 53% from143 deaths per 1000 live births in 2000 to 68 in 2018 (2).There is room for further progress, given the persistentand substantial gap that remains between average lifeexpectancy in low- and in high-income countries.2Deaths occurring before the age of 70.MONITORING HEALTH FOR THE SDGs1
Life expectancyHealthy life expectancy22222020181616Gain in years between 2000 and 2016Gain in years between 2000 and 20161814121086 Global14121086442200Low incomeLower-middleincomeUpper-middleincomeHigh incomeGlobalLow incomeLower-middleincomeUpper-middleincomeHigh incomeNote: Each circle represents a country.Source: Global health estimates 2016: Life expectancy, 2000–2016. Geneva: World Health Organization; 2018 (1).Fig. 1.1Gains in life expectancy and healthy life expectancy between 2000 and 2016, by country income groupNEW INDICATORS IN THE 2020 EDITIONSDG indicatorsSDG 2.2.3: In 2016, the global prevalence of anaemia among women of reproductive age was 32.8% (compared with 30.3% in 2012). Applied to the latest UN population estimates,that equated to 615.8 million women with anaemia. The rates of anaemia were highest in the WHO South-East Asia (45.8%), Eastern Mediterranean (39.8%) and African (39.0%)regions (4).SDG 3.b.1: Human papillomavirus (HPV) is the most common viral infection of the reproductive tract, and can cause cervical cancer. The vaccine targeting 9–14 year-old girls isnow offered in 90 countries, but is yet to reach the poorest countries where the risk of cervical cancer is the greatest. Global coverage for a full course of HPV vaccines increasedfrom 3% in 2010 to 12% in 2018 (5).SDG 3.b.3: Based on a sample of 25 countries, surveyed between 2008 and 2019, on average only 22.4% of health facilities provided an available and affordable (accessible)core set of relevant essential medicines for treatment, prevention and management of acute and chronic, communicable and noncommunicable diseases in primary health caresettings. A lot of variation in access to medicines is observed between these 25 countries. Specifically, in 28% of countries none of the facilities provided accessible medicines (6).SDG 3.d.2: By rendering medicines ineffective, antimicrobial resistance undermines the treatment of common infections and increases the risk of spread to others. After the launchof the Global Antimicrobial Resistance Surveillance System (GLASS) in 2016, as of 21 April 2020, a total of 91 countries and territories have been supported to enroll into the systemand participate in the annual data call on antimicrobial resistance and consumption. Data on the overall prevalence of antimicrobial- resistance pathogens are currently limited,but completeness and representativeness of the data have continuously increased at every GLASS data call. The last data call run in 2019 gathered frequency of antimicrobialresistant pathogens in common acute bacterial infections, including bloodstream infections from 66 countries and territories (7). Monitoring AMR will help inform control strategiesand actions to mitigate impact on the population such as informing the treatment protocols, enhancing Infection Prevention and Control (IPC) and water, sanitation and hygiene(WASH) in health care facilities, increasing the availability of “Access” group antibiotics, as well as continuous improvement of AMR surveillance capacities. Establishing AMRsurveillance systems will also build country capacity to monitor and respond to risks from emerging pathogens.SDG 6.2.2(b): Proportion of population using a hand-washing facility with soap and water.aGPW13 indicatorsbNumber of cases of poliomyelitis caused by wild poliovirus.cAge-standardized prevalence of raised blood pressure among persons aged 18 years (defined as systolic blood pressure of 140 mmHg and/or diastolic blood pressure 90 mmHg) and mean systolic blood pressure.dPrevalence of obesity.eabcde2See Section 2.The GPW13 impact measurement indicators (8) of public health importance are related and complementary to SDG monitoring. These additional indicators with available numericaldata are reported in the main report and in the annexes. The GPW13 indicators that currently lack numerical data are: Vaccine coverage of at-risk groups for epidemic- orpandemic-prone diseases); Proportion of vulnerable people in fragile settings provided with essential health services); Patterns of antibiotic consumption at the national level;Percentage of blood stream infections due to antimicrobial-resistant organisms; Percentage of people protected by effective regulation on trans fats.See Section 2.See Section 3.See Section 3.WORLD HEALTH STATISTICS 2020
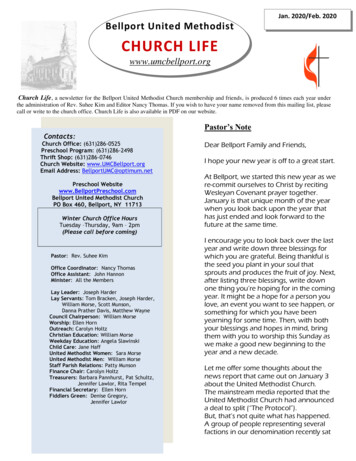
The progress being made offers a platform for furtherimprovements. But it does not guarantee that the world willmeet the health-related SDG targets for 2030. Currently,none of the nine main health-related SDG indicatorswith explicit targets for 2030 are on-track to meet them.However, some individual countries have achieved or areon-track to achieve SDG targets; they should intensify theirefforts to ensure progress is equitable.Health systems and universal healthcoverageIn the SDG monitoring framework, progress towardsuniversal health coverage (UHC) is tracked with twoindicators: (i) a service coverage index (which measurescoverage of selected essential health services on a scaleof 0 to 100); and (ii) the proportion of the population withlarge out-of-pocket expenditures on health care (whichmeasures the incidence of catastrophic health spending,rendered as percentage).The service coverage index improved from 45 globally in2000 to 66 in 2017, with the strongest increase in lowand lower-middle-income countries, where the baselineat 2000 was lowest. However, the pace of that progresshas slowed since 2010. The improvements are especiallynotable for infectious disease interventions and, to a lesserextent, for reproductive, maternal and child health services.Within countries, coverage of the latter services is typicallylower in poorer households than in richer households (9).Overall, between one third and one half the world’spopulation (33% to 49%) was covered by essentialhealth services in 2017 (9). Service coverage continuedto be lower in low- and middle-income countries than inwealthier ones; the same held for health workforce densitiesand immunization coverage (Figure 1.2). Available dataindicate that over 40% of all countries have fewer than 10medical doctors per 10 000 people, over 55% have fewerthan 40 nursing and midwifery personnel per 10 000people, over 68% have fewer than five dentists per 10 000population and over 65% have less than five pharmacistsper 10 000 population (10).Globally, women comprise over 76% of medical doctorsand nursing personnel, although the sex distribution variesconsiderably depending on the occupation and region.While women comprise a little over 40% of medicaldoctors worldwide, they make up 90% of nursing personnel.Nursing is by far the largest occupational group in the healthsector, with nurses accounting for an average 59% of healthprofessionals in the 172 countries with available data (11).The age distribution of the nursing workforce is alsonoteworthy: 1 in 6 nurses in the world is aged 55 yearsor older and is expected to retire in the next decade. Thatproportion is even higher in the Region of the Americas(24%) (11). The sex distribution of health workers showsthat, although women represent the majority of the healthworkforce, they are often under-represented at seniormanagement levels (12).Disparities in distribution of health workforces – e.g. interms of their age and sex distribution, employment statusand pay levels – hinder UHC and the achievement of theSDGs.In health systems with strong financial protection, healthservice coverage should not be a source of financial hardshipfor people accessing those services. Yet, the proportion ofthe global population experiencing catastrophic healthexpenditure1 has increased steadily since 2000.Out-of-pocket health spending can force people tochoose between spending on health and spending onother necessities. The proportion of the global population1Defined as large out-of-pocket spending in relation to household consumption or income(SDG 3.8.2).AFRAMRSEAREUREMRWPRGlobal 0 10 20 30 40 50 60 70 80 90Density (per 10 000 population)Source: State of the world’s nursing report. Geneva: World Health Organization; 2020 (11).Fig. 1.2Number of nurses per 10 000 population, by WHO region, 2018MONITORING HEALTH FOR THE SDGs3
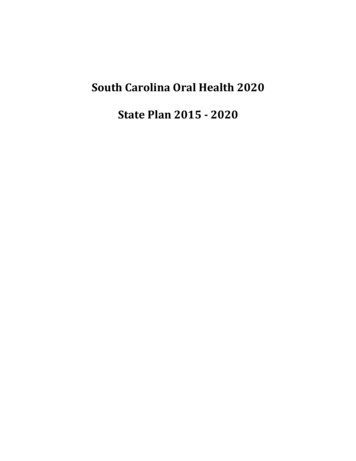
Quadrant I90Quadrant II80Service coverage index, 201570Median605040302010Quadrant IIIQuadrant IV0Median051015202530Incidence of catastrophic spending (SDG 3.8.2 – 10% threshold, 2008–2018)LowonincomeUpper-middleSource: Primary health carethe road to universal health coverage:2019 monitoringincomereport. Geneva: World Health Organization; 2019 (13).Lower-middle incomeHigh incomeFig. 1.3Levels of servic
vi WORLD HEALTH STATISTICS 22 INTRODUCTION T he World health statistics 2020 report is the latest annual compilation of health statistics for 194 Member States. 1 It summarizes trends in life expectancy and causes of death and reports on progress towards the health and health-related Sus