Transcription
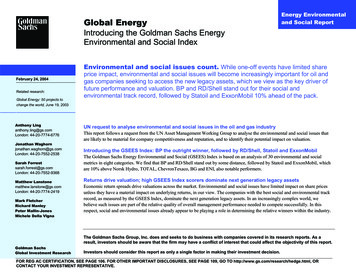
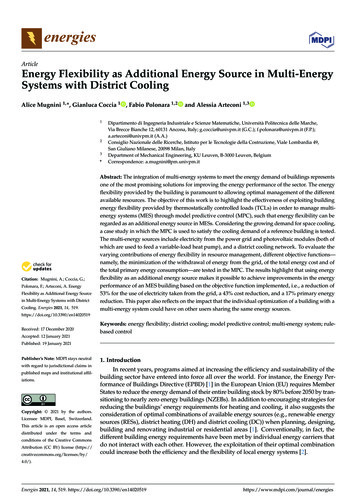
Asian LNG spot prices and oil-linked contract prices are expected toremain relatively flat over the outlook period, as the LNG market remainswell supplied and oil prices stabilise above US 60 a barrel. Australian export volumes are forecast to increase by 5.3% to 83 milliontonnes in 2021–22, as technical issues are resolved at the Prelude andGorgon LNG plants. Export volumes are forecast to be relatively flat in2022–23. 7.2Australia’s LNG exports earnings are forecast to increase from anestimated 32 billion in 2020–21 to 49 billion in 2021–22, as oil-linkedcontract prices rise sharply.Figure 7.1: LNG demand and world supply capacityWorld tradeLNG trade is expected to rise by 2.5% in 2021, as the energy demandimpacts of the COVID-19 pandemic impact fade. Trade is then expected toincrease by 7.7% in 2022 and 1.6% in 2023.Given the large scale expansion of global LNG capacity in recent years,import demand is expected to remain short of export capacity throughoutthe outlook period. Beyond 2023, the global LNG market may tighten,due to the April 2021 decision to indefinitely suspend the MozambiqueLNG project, in response to rising security issues. This project has anannual nameplate capacity of 13 million tonnes, and was previouslyexpected to start exporting LNG in 2024.Resources and Energy Quarterly June 20211004008030060200401002002013LNG trade growth to gain steamIn 2020, global LNG trade reached 355 million tonnes, a modest increaseof 1.5% (Figure 7.1). This improvement was in stark contrast to the stronggrowth from previous years, reflecting the impacts of the COVID-19pandemic on LNG demand. Global LNG trade growth picked up in the firsthalf of 2021, as the economic impacts of COVID-19 eased, and as abitterly cold northern hemisphere winter raised heating demand. The coldnorthern hemisphere winter also reduced gas storage in major importingnations, which lifted restocking demand in the following months.5002015201720192021Per centSummaryMillion tonnes7.102023AustraliaNorth AmericaMiddle EastAfricaSouth East AsiaRest of the worldWorld tradeCapacity utilisation (rhs)Source: Nexant (2021) World Gas Model; Department of Industry, Science, Energy andResources (2021)7.3World importsJapanese LNG demand to cool in response to rising nuclear generationJapan imported 18 million tonnes of LNG in the three months to April2021, marginally higher year-on-year (Figure 7.2). Since late 2020,Japanese imports have risen, due to strong heating demand during anexceptionally cold winter. LNG import demand has also been supported bynuclear outages, with nuclear generation hitting a 3-year low during the2020–21 winter period. Although nuclear generation has recovered insubsequent months, these gains have been moderate, as only nine ofJapan’s 33 operable nuclear reactors have gained approval to restartsince the Fukushima nuclear accident in 2011.64
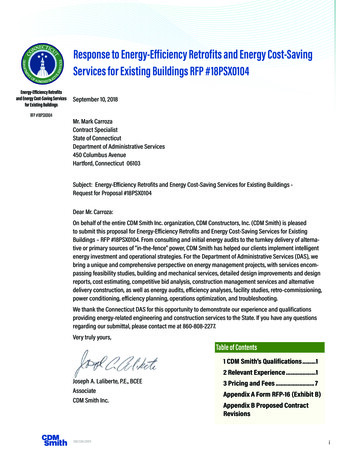
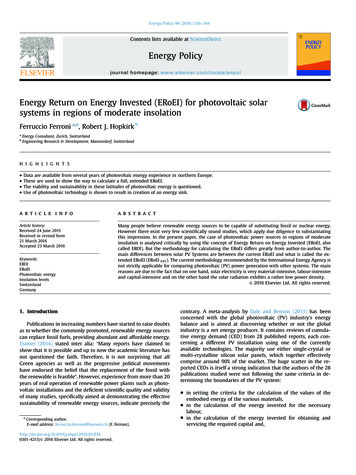
Figure 7.2: Asian LNG imports and spot price25202015151010550Apr-18Apr-19JapanChinaAsian LNG spot price (rhs)Apr-20South KoreaTaiwan0Apr-21Source: Bloomberg (2021)China forecast to be the world’s largest LNG importer from 2022China’s LNG imports increased by 12% in 2020, reaching 67 milliontonnes — making it the world’s second largest LNG importing country. Gasconsumption increased significantly in 2020, driven by the industrial andresidential sectors, and ongoing coal-to-gas switching. The share of LNGResources and Energy Quarterly June 202110010808606404202Jan-19Oct-19AustraliaMalaysia & IndonesiaUnited StatesJul-20Million tonnesFigure 7.3: China’s gas supply by source0Apr-18US a mmtuMillion tonnes25in Chinese gas demand remained historically high in 2020, reflecting lowLNG prices. In 2020, Australia accounted for the largest share of China’sLNG imports, at around 43% (Figure 7.3).Per centLNG imports in 2021 are estimated to fall marginally to 73 million tonnes,as higher nuclear generation more than offsets higher gas demand fromthe economic recovery. However, the pace of gains in nuclear generationremains uncertain, and subject to potential delays and slippages. Importsduring the second half of 2021 are also likely to be affected by localisedCOVID-19 containment measures (see macroeconomic outlook chapter),which will weigh on residential demand. LNG imports are expected to fallfurther to 72 million tonnes in 2023, due to energy efficiency improvementsand higher nuclear output. Beyond the outlook period, Japan’s LNG importdemand is likely to be affected by the April 2021 announcement tighteningJapan’s 2030 emissions reductions target. This may increase the incentiveto reconnect currently idled nuclear power plants.0Apr-21QatarOtherTotal volumes (rhs)Source: Bloomberg (2021); National Bureau of Statistics of China (2021) GeneralAdministration of CustomsIn May 2021, there were media reports that at least two of China’s secondtier LNG importers were instructed by the Chinese government to avoidpurchasing additional Australian LNG cargoes. Second-tier Chinese LNGimporters account for around 10% of Chinese imports, with large stateowned enterprises accounting for the rest. At the time of writing, thesealleged directives have not materially affected Australia’s LNG exports toChina. With second-tier LNG importers less active on spot markets, theimpacts from these directives are likely to be limited.After China imported virtually no LNG from the US in 2019, importsresumed in April 2020 and reached 1.1 million tonnes in December. Thisincrease followed tariff waivers as part of the US-China Phase One tradedeal. For the rest of the outlook period, Chinese targets for purchases ofUS energy products are expected to remain in place.65
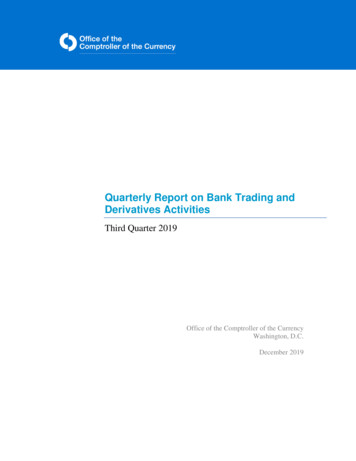
Over the outlook period, China’s LNG import demand is expected to seeincreased competition from rising gas supply from domestic sources andpipeline imports. Despite China facing geological challenges tapping itsextensive gas reserves, domestic gas output is expected to rise due tosupportive government policies. The 14th Five Year Plan’s energy resourcesecurity strategy targets higher domestic gas production. Pipeline gasimports are also expected to grow, due to the Power of Siberia pipelineopening in December 2019. The pipeline has an annual nameplatecapacity of 38 billion cubic metres of gas — equal to about 28 milliontonnes of LNG.South Korea’s LNG demand to increase due to coal-to-gas switchingSouth Korea’s LNG imports were strong in late 2020 and early 2021,supported by temporary nuclear and coal power plant outages, and strongwinter demand. This follows relatively weak LNG imports in early 2020,when imports were weighed down by both the impacts of the COVID-19pandemic on power demand, and by the restart of nuclear power plants.Over 2020, South Korea’s LNG imports fell by 1.8% to 40 million tonnes.South Korea’s LNG imports are forecast to stage a modest recoverybetween 2021 and 2023, rising by about 1.4% a year (Figure 7.4).Although gas demand is expected to be negatively affected by growingnuclear capacity, it is also expected to benefit from government policiesthat favour gas usage over coal. South Korea’s policies to transition awayfrom coal is expected to continue supporting LNG imports beyond theoutlook period, as the government plans to convert 25% of coal-firedcapacity to gas by 2031.Resources and Energy Quarterly June 2021Figure 7.4: World LNG import changes6030Million tonnesChinese LNG imports are expected to remain a key driver of global LNGdemand growth, rising by an average 8.7% per annum over the next threeyears. As a result, China is expected to become the world’s largest LNGimporter in 2022, overtaking Japan. China’s 14th Five Year Plan indicatesthat gas will play an important role in the country’s energy transition tomeet its ‘carbon-neutral by 2060’ pledge.0-30-60201320152017JapanChinaEuropeWorld supply capacity201920212023South KoreaEmerging AsiaRest of worldNotes: Emerging Asia includes India.Source: Nexant (2021) World Gas Model; Department of Industry, Science, Energy andResources (2021)Taiwan’s imports to riseTaiwan’s LNG demand was resilient in 2020, rising by 7.7% despite theimpacts of COVID-19. Gas-fired power generation grew substantially in2020, driven by government initiatives to phase out coal and nuclearpower. These government policies are assumed to continue throughoutthe outlook period, with the Taiwanese government aiming to increase theshare of gas-fired power generation in its electricity mix, from 35% in 2020to 50% by 2025. However, any substantial growth in Taiwan’s imports islikely to depend on the construction of a third LNG import terminal, as thetwo existing terminals are operating at full capacity. Taiwanese LNGimports are forecast to reach 18 million tonnes in 2023, 14% higher than2020 volumes.66
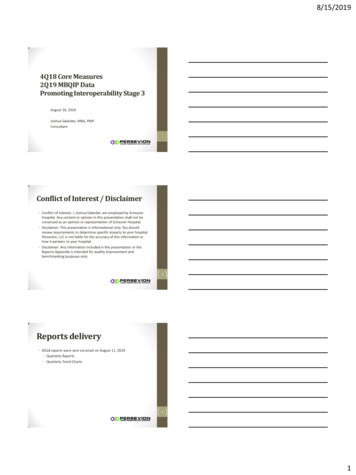
India’s LNG imports were volatile in 2020, negatively affected by thelockdowns earlier in the year. In the second half of 2020, imports rosemarkedly, due to the opportunistic buying of cheap LNG on the spotmarket. Over the full year, India’s LNG imports in 2020 rose by 9.9% to26 million tonnes. This volatility is expected to persist into the second halfof 2021, as India continues to grapple with COVID-19. Media reportssuggest some Indian importers are asking suppliers to defer deliveries, asCOVID-19 containment measures have reduced gas demand. Indian LNGimports in 2021 are forecast to rise by 7.3% to 27 million tonnes.Imports are forecast to rise to 29 million tonnes in 2022, as residential gasdemand recovers. As a price sensitive LNG importer, Indian imports arelikely to be affected by the relative cost of LNG throughout the outlookperiod. Beyond the outlook period, the Indian government has ambitions tolift the share of gas in its energy mix from about 6% in 2020 to 15% in2030. Its success will depend on a range of factors, including gas marketreforms, infrastructure development, and higher domestic gas output.Europe’s Nord Stream 2 pipeline to reduce LNG import demandIn recent years, Europe has played an important role in balancing theglobal LNG market; its extensive storage capacity and liquid gas hubshave absorbed large volumes of LNG. However, in late 2020 and early2021, the region absorbed fewer LNG cargoes, due to high Asian demand.European LNG import demand is forecast to fall, reflecting the ramp up oftwo new gas pipelines. The Trans Adriatic Pipeline began commercialoperations in November 2020, and has an annual nameplate capacity of10 billion cubic metres (about 7.4 million tonnes of LNG). The otherEuropean gas pipeline, Nord Stream 2, has faced delays due togeopolitical tensions. However, US President Biden announced inMay 2021 that the US government was waiving sanctions on thecompanies involved with Nord Stream 2. As a result, Nord Stream 2 isexpected to be operational in the second half of 2021, transporting up to55 billion cubic metres of pipeline gas each year from Russia to Germany(40 million tonnes of LNG).Resources and Energy Quarterly June 2021As a result of assumed higher pipeline gas imports, European LNGimports are forecast to fall from 85 million tonnes in 2020 to 69 milliontonnes in 2023.Emerging Asia to significantly increase LNG importsOther South and South-East Asian economies were a major source ofdemand growth in late 2020 and early 2021. Ship tracking data suggeststhat in the three months to April 2021, Pakistan’s LNG imports rose by7.3% year-on-year, and Bangladesh’s by 10%.Over the outlook period, imports from emerging Asian economies areexpected to increase due to declining domestic gas production, theexpansion of gas-fired power generation and new LNG infrastructuredevelopments. Individually, these countries are relatively small importersof LNG, although collectively they are expected to account for a growingshare of global LNG demand going forward. The region (including India) isforecast to import 84 million tonnes of LNG by 2023, 44% higher than2020 volumes (Figure 7.5).Figure 7.5: LNG imports from emerging Asian countries10080Million tonnesIndian residential gas demand to 202020212022PakistanThailandOther emerging Asia2023Source: Nexant (2021) World Gas Model; Department of Industry, Science, Energy andResources (2021)67
World exportsLingering 2020 impacts to affect LNG export capacityIn 2020, weak spot LNG and oil prices resulted in multiple FID deferrals,and only one liquefaction project was approved— Sempra Energy’s2.5 million tonnes per annum (mtpa) Costa Azul project in Mexico. At theend of 2020, global LNG capacity was estimated at around 450 mtpa, withanother 125 mtpa of capacity under construction or sanctioned fordevelopment. However, less than 10 mtpa of new capacity is expected tocome online in 2021.There is around 900 mtpa of proposed LNG capacity in the pre-FID stage,though much of this is unlikely to proceed. LNG capacity is expected torise later in the decade, predominantly as a result of new projects in Qatarand Russia. This growing capacity in low-cost producers is likely to affectfuture investment decisions in other producers, which could impact thetiming of the next wave of LNG capacity additions.US exports to rise in the short-termIn 2020, the US was the largest driver of the recovery in global LNGexports. US exports declined significantly between June andSeptember 2020, as high US prices reduced the competitiveness of USLNG exports to Asia and Europe. Later in the year, supply disruptions inother major exporters lifted Asian and European prices, raising theattractiveness of US exports. As a result, US exports rose sharply,reaching a record high in December 2020. US LNG exports rose 31% to50 million tonnes in 2020.So far in 2021, US exports have increased further, reaching a new recordin March 2021 and remaining historically high in later months. Over the fullyear, US LNG exports are forecast to increase by 13% year-on-year to56 million tonnes, reflecting ongoing growth in US LNG capacity.US LNG capacity growth is expected to stagnate in 2022, and US exportsare projected to increase only marginally. In 2023, exports are expected torise by 5.8%, reflecting higher liquefaction capacity. However, the pace ofcapacity growth remains uncertain. In March 2021, Annova LNGResources and Energy Quarterly June 2021announced they were ceasing development of their planned Texas exportfacility, due to changes in the global LNG market. Facing strong pricecompetition from expanding Qatari and Russian LNG capacity, future USLNG facilities could face similar FID deferrals or cancellations.Figure 7.6: Outlook for global LNG exports90Million 2021SouthAfricaEast Asia2022Rest ofworld2023Source: Nexant (2021) World Gas Model; Department of Industry, Science, Energy andResources (2021)Qatar’s exports to remain relatively steady over the short-termQatar’s LNG exports were largely resilient in 2020. Shipping data indicatesthat Qatar may have been the world’s largest LNG exporter in 2020,slightly surpassing Australia. However, given the marginal differencebetween the two country’s exports and uncertainty surrounding the preciselevel of Qatar’s LNG exports, an accurate assessment of totals is difficult.Qatar’s LNG exports are forecast to be relatively steady in 2021 and 2022,hovering around 79 million tonnes (Figure 7.6). Beyond the outlook period,Qatar’s LNG exports are expected to increase significantly, as a result ofthe US29 billion North Field East project, anticipated to be completed inlate 2025. This project has a nameplate capacity of 33 million tonnes,lifting Qatar’s export capacity to 110 million tonnes.68
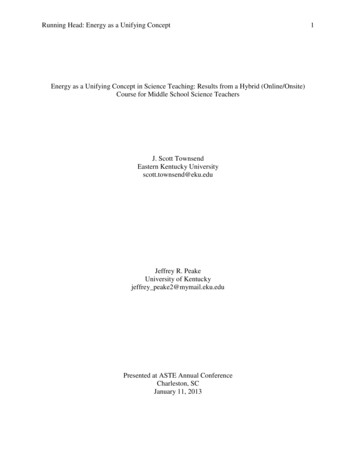
PricesLNG spot prices to stabiliseAsian LNG spot prices have varied significantly as the COVID-19pandemic has progressed. Prices were first affected by dramatically lowerdemand, falling to a record low US 1.68 a mmBtu on 30 April 2020. Pricesrecovered gradually in later months, as consumption recovered, anddisruptions at several LNG facilities reduced export supply. Prices thenshot up in late 2020 and in early 2021, as a bitterly cold North Asian winterincreased heating demand. To meet this heating demand, purchasersturned to the spot market to complement contracted cargoes, and pricesreached a record high US 39.72 a mmBtu on 13 January 2021. Localisedsupply disruptions during this period also drove up prices. In February2021, prices fell to average US 7.18 a mmBtu, but have since recovered,averaging 9.95 a mmBtu in May 2021. This growth was due to Asianimporters replenishing storage before the forecast warm NorthernHemisphere summer, which is expected to see increased cooling demand.Benchmark LNG spot prices diverged during the first half of 2021, drivenby regional cold snaps and logistical difficulties in diverting cargoes tohigher price markets (Figure 7.7). The difference between Asian spotprices and Henry Hub prices reached a record high in January 2021, ascongestion in the Panama Canal limited the opportunity for US exportersto meet demand from Asian buyers. In later months, US and Europeanprices both rose sharply, as cold weather increased heating demand forgas. US prices have also increased as a result of the Texas winter storm,which shut in large volumes of gas production. There have also been anumber of supply disruptions at major exporters — including Australia,Qatar and the US — which have facilitated strong price gains.Spot prices converged during the June quarter, and North-East Asian spotprices are estimated to average US 9.92 a mmBtu in the June quarter2021. Prices are again expected to increase over the northern hemispherewinter, reaching US 11.00 a mmBtu in the December quarter 2021. Thisincrease is expected to be more moderate than the prior year, as theResources and Energy Quarterly June 2021Northern Hemisphere winter is expected to be milder. There are alsoexpected to be less notable supply constraints.Figure 7.7: Global gas and LNG prices, monthly2520US a May-21ANEA LNG spot priceHenry HubUK National Balancing PointJapan average import priceNotes: ANEA is the Argus Northeast Asia spot price. LNG prices are DES (Delivered ExShip), which include shipping and insurance.Source: Argus (2021); Bloomberg (2021)Prices are expected to average US 9.38 a mmBtu in 2022, andUS 8.63 a mmBtu in 2023. Similar to recent years, prices are expected topick up over the December quarters, reflecting higher demand in thenorthern hemisphere winter (Figure 7.8). However, any price increases arelikely to be moderated by growing export capacity, which will keep theLNG market well supplied.Oil prices forecast to remain above US 60 a barrelAlmost 70% of the LNG traded in Asia is sold via long-term contractswhich link the price of LNG to the price of oil (commonly the Japanesecustoms-cleared crude price), typically lagged by around three to sixmonths (depending on contractual arrangements).69
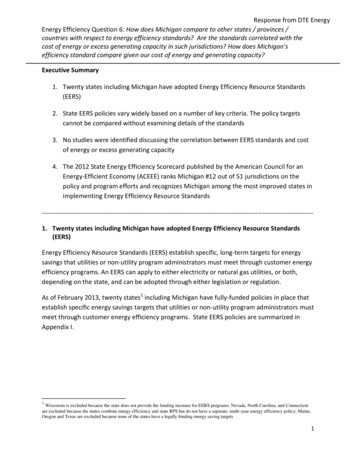
7.615901275960645330015-3Dec-17Dec-19Oil-linked premium to ANEAIndicative oil-linked contract priceDec-210Dec-23ANEA LNG spot priceBrent crude oil (rhs)Notes: ANEA is the Argus Northeast Asia spot price. LNG prices are DES (Delivered ExShip), which include shipping and insurance. The long-term oil-linked contract price isindicative, and is estimated at 14% of the 3-month lagged JCC oil price plus shipping. The oillinked premium to ANEA represents the differential between these two prices.Source: Argus (2021); Bloomberg (2021); Department of Industry, Science, Energy andResources (2021)Oil prices recovered to above US 60 a barrel in the March quarter 2021,driven by supply restraint across major producers and recoveringconsumption. Due to the contract lag of several months, these oil priceswere reflected in contract prices in the June quarter 2021. Contract pricesare expected to increase further in the September quarter 2021, reflectingongoing oil price gains. Oil prices in the June quarter 2021 have increasedto around US 70 a barrel, as oil stocks were drawn down andconsumption has picked up. Over the outlook period, oil prices areexpected to fall slightly, as market-driven producers respond to higherprices and OPEC raises production targets. However, oil prices areforecast to remain around US 65 a barrel over the outlook period. This isexpected to lead to relatively steady oil-linked contract prices.Resources and Energy Quarterly June 2021AustraliaAustralia’s LNG export volumes broadly stableUS a barrelUS a mmBtuFigure 7.8: LNG spot and contract prices, quarterlyAustralia’s LNG export volumes have been relatively resilient throughoutthe COVID-19 pandemic. Since the March quarter 2020, Australian exportvolumes have ranged between 18.4 million tonnes and 20.6 million tonneseach quarter. These variations were largely driven by technical outages,with output affected at the Gorgon and Prelude facilities. In the Marchquarter 2021, Australia’s LNG exports totalled 20.1 million tonnes, 2.2%lower quarter-on-quarter and 0.1% lower year-on-year.Production at Gorgon has been limited since May 2020, when technicalissues were detected in the heat exchanger of Train 2. After repairs werecompleted, Train 1 was taken offline for inspection, and similar issues toTrain 2 were found in January 2021. Inspections for Train 3 are ongoing asof June 2021, with repairs to follow if necessary. Due to these phasedshutdowns, Gorgon has been operating well below its nameplate capacityof 15 mtpa since May 2020.Prelude FLNG has also gone through significant production disruptions,and was offline between February 2020 and January 2021. Althoughproduction has increased in subsequent months, Prelude FLNG is yet toproduce at its full nameplate capacity of 3.6 million tonnes since it shippedits first cargo in June 2019.In 2020–21, Australian LNG export volumes are estimated to fallmarginally to 79 million tonnes, reflecting the technical issues at theGorgon and Prelude LNG plants.Australia’s export earnings recoveringIn the March quarter 2021, Australia’s LNG export earnings increased to 8.3 billion, up 12% quarter-on-quarter. Despite this strong quarter-onquarter gain, export earnings remained 35% lower year-on-year, asrelatively low oil-linked contract prices affected export earnings. Almostthree-quarters of Australian LNG is sold via long-term contracts that linkthe price of LNG to the price of oil with a lag of around three to six months,depending on contractual arrangements. Australian export earnings are70
estimated to have returned to average levels in the June quarter 2021, asLNG contract prices reflected the March quarter 2021 recovery in oil pricesto over US 60 a barrel. For 2020–21, Australian LNG exports areestimated to be 32 billion, down 32% from 2019–20 (Figure olume2018–192020–212022–23Higher prices expected to lift Australia’s LNG export earningsAustralia’s LNG export earnings are estimated to have fallen sharply in2020–21, down to 32 billion from 48 billion in 2019–20 (Figure 7.10).Figure 7.10: Price and volume contribution to LNG export earnings50Value (rhs)Source: ABS (2021) International Trade in Goods and Services, 5368.0; Department ofIndustry, Science, Energy and Resources (2021)LNG export volumes expected to return to above pre-COVID-19 levelsIn January 2021, Santos announced an FID for an infill drilling program inthe Bayu-Undan field, with first production expected in the Septemberquarter 2021. This program will extend output at the Darwin LNG facility,which was previously expected to halt production in 2022. This investmentdecision is expected to narrow the time between its depletion and thestart-up of the Barossa backfill project. Santos announced an FID forBarossa on 30 March 2021, and is expecting initial gas production in thefirst half of 2025. Barossa is expected to extend the facility life of DarwinLNG by around 20 years.Resources and Energy Quarterly June 2021LNG exports are forecast to rebound to around 83 million tonnes in2021–22. The rebound reflects an assumed resolution of technical issuesat various facilities and Prelude FLNG ramping up towards its nameplatecapacity. In 2022–23, Australian exports are expected to remain around83 million tonnes.25Per cent2012–13A billionMillion tonnesFigure 7.9: Australia’s LNG exportsCapacity utilisation at the North West Shelf (NWS) is expected to declinein 2022, as gas from existing fields is depleted. NWS has securedshort-term infill from Pluto and Waitsia, two projects with shorter leadtimes. However, large scale backfill projects are required for the longerterm. Given the complex commercial arrangements associated with theNWS and high capital costs, there is potential for further backfill projectdelays. Browse is earmarked as backfill to the NWS, however this projecthas faced FID deferrals until at least 2023 due to weak market ��192020–21VolumesPricesValues2022–23Source: ABS (2021) International Trade in Goods and Services, 5368.0; Department ofIndustry, Science, Energy and Resources (2021)71
The majority of this decline was due to weak contract prices, particularly inSeptember quarter 2020 and December quarter 2020. Export earnings areforecast to increase to 49 billion in 2021–22, with oil-linked contractprices expected to be around pre-COVID-19 levels. Export values in2022–23 are forecast to be 46 billion, as export prices fall marginally.Uncertainty surrounds the next wave of investmentThe outlook for the next wave of investment in Australian LNG projects isshrouded by considerable uncertainty, with weak market conditionsresulting in FID deferrals (see the Resources and Energy Major Projects2020 publication). Most LNG projects in the investment pipeline are backfillprojects required to support the ongoing operation of existing LNGfacilities. The proposed Scarborough to Pluto LNG expansion — where a5 mtpa train would be added to Pluto — is the only substantial expansionto Australia’s LNG capacity in the investment pipeline. Woodside isexpected to announce a FID on the Scarborough to Pluto project in thesecond half of 2021.In the next few years, it is likely that at least one import terminal will reacha FID and commence importing LNG. Five potential projects have beenproposed, all concentrated in south eastern Australia. The proponents areaiming to start commercial operation by 2022 or 2023. It is likely that onlyone or two of the five projects currently under consideration will proceed.Revisions to the outlookAustralia’s LNG export earnings have been revised up by 5.3 billion in2021–22, reflecting higher assumed LNG spot prices and oil-linkedcontract prices. Export earnings in 2022–23 have been revised down by 277 million, reflecting lower assumed oil-linked contract prices.Resources and Energy Quarterly June 202172
Table 7.1: Gas outlookAnnual percentage S /bbl45.367.365.863.348.5-2.2-3.9US /bbl46.467.364.360.045.1-4.5-6.7US /MMbtu4.410.89.48.6147.0-13.0-8.0US Bcm157.6153.1160.6161.2-2.84.90.4– Eastern marketBcm57.556.554.354.6-1.7-3.80.4– Western marketBcm85.781.491.291.6-5.012.00.4– Northern 83.1-0.75.30.3A m47,52532,23349,03345,691-32.252.1-6.8A m48,04732,23348,22044,166-32.949.6-8.4– nominal valueA /GJ11.47.811.210.4-31.744.5-7.1– real valueA /GJ11.57.811.010.1-32.442.1-8.7– nominal valueUS /MMBtu8.16.19.38.6-23.952.2-7.4– real valueUS /MMBtu8.16.19.28.3-24.849.7-9.0JCC oil pricea– nominal– realhAsian LNG spot priceg– nominal– realhGas productionsGas consumptionsLNG tradedsLNG export volumed– nominal value– real valuee2020–21sff2020–21sLNG export unit valuegehNotes: a JCC stands for Japan Customs-cleared Crude; b Production includes both sales gas and gas used in the production process (i.e. plant use) and ethane. Historical gas product ion data wasrevised in the June quarter 2017 to align with Australian Petroleum Statistics; c Gas production from Bayu-Undan Joint Production Development Area is not included in Australian production.Browse basin production associated with the Ichthys project is classified as Northern market; d 1 million tonnes of LNG is equivalent to approximately 1.36 billion cubic metres of gas; e In 2020–21Australian dollars; f Forecast; g 1 MMBtu is equivalent to 1.055 GJ; h In 2021 US dollars; s Estimate.Source: ABS (2021) International Trade in Goods and Services, 5368.0; Department of Industry, Science, Energy and Resources ( 2021); Company reports; Nexant (2021) World Gas ModelResources and Energy Quarterly June 202173
LNG trade is expected to rise by 2.5% in 2021, as the energy demand impacts of the COVID-19 pandemic impact fade. Trade is then expected to increase by 7.7% in 2022 and 1.6% in 2023. Given the large scale expansion of global LNG capacity in recent years, import demand is expected to remai