Transcription
Quarterly Model Portfolio Review and MarketSummary for ShareBuilder 401k Plan SponsorsFirst Quarter 2016Contributors:ShareBuilder 401k Model Portfolio Performance and Review provided by Capital One Advisors.Market and Economic Overview is provided by Capital One Asset Management.Securities and services are: Not FDIC insured Not bank guaranteed May lose value Not a deposit Not Insured by anyFederal Government AgencyCapital One Advisors and Capital One Asset Management are separate but affiliated legal entities of Capital One Financial Corporation and each isresponsible for its own products and services.Advisory services are provided by Capital One Advisors, LLC, an SEC registered investment advisor and a subsidiary of Capital One Financial Corporation.ShareBuilder 401k and Spark 401k are the marketing names for Capital One Advisors, LLC.
Quarterly Model Portfolio Review and Market Summary forShareBuilder 401k Plan SponsorsWe are committed to helping you and your employees build toward retirement readiness. Each quarter,the Capital One Advisors Investment Committee reviews the model portfolios offered in ShareBuilder401k plans and determines if adjustments are needed. This is part of our fiduciary responsibility we takeon for your company’s 401(k) plan.The Investment Committee uses the outputs from an analysis that works to optimize the asset allocationfor each model portfolio such that it meets the stated model portfolio’s objective. Objectives of theportfolios range from a focus on capital preservation to a focus on aggressive growth. The portfolioanalysis looks at several factors, including historical returns, historical volatility and underlying investmentcorrelation. As the past is no guarantee of the future, the Investment Committee also considers economicindicators, market signals and sound investing principles to determine if adjustments to any of the fivemodel portfolios are warranted.Employees have the option to invest in a model portfolio or select freely from the 21 fund optionscurrently offered in your ShareBuilder 401k plan.This report provides:Page 2-4: Model Portfolio Recaps and Investment Committee DecisionsPage 5-6: Summary of the past Quarter’s Market PerformanceAny changes to the ShareBuilder 401k model portfolios will occur automatically for your employeesinvested in one. Their upcoming contributions will move to the new allocations going forward ifapplicable. For those employees that use auto-rebalancing, pre-existing balances prior to a change willrebalance to the new allocation at the next scheduled auto-rebalance date. This is typically at the end ofeach calendar quarter.We hope you find this report helpful in providing more insights on the investment options in your planand how the market and economic factors may impact them.Best Regards,The Capital One Advisors Investment Committee1
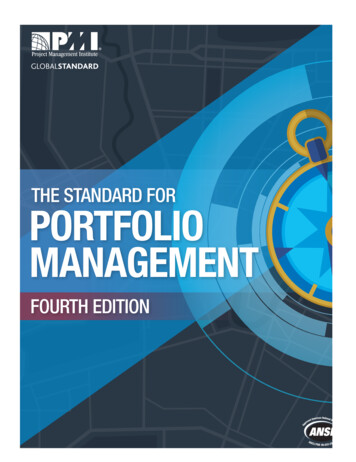
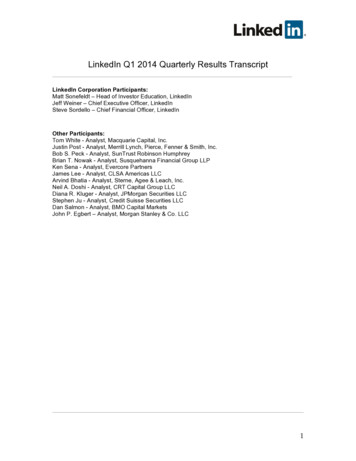
ShareBuilder 401k Model Portfolios RecapIn your ShareBuilder 401k, employees can select investments from the fund roster or choose one of ourfive model portfolios. The Capital One Advisors Investment Committee oversees the make-up andasset allocation of the model portfolios. The model portfolios range from Stable (capital preservation) toAggressive (focused on growth).The following provides an overview of how the model portfolio’s performed with some insights on someof the driving factors. The Investment Committee takes a long-term view when evaluating performanceand opportunities, so short-term results need to be taken in that context.As of the past quarter, the model portfolios performed as follows:Stable Portfolio:View important disclosures about the Stable PortfolioSHYiShares 1-3 Year Treasury BondBNDVanguard Total Bond Market85%5%BWXSPDR Barclays International Treasury Bond5%TIPiShares TIPS Bond5%Portfolio Performance*3-Month1-Year3-Year5-Year10-YearAs of 3/31/20161.35%0.30%-0.40%0.44%1.83%The Stable portfolio has a 100% allocation to fixed income securities. In periods of declining interest rates, similar to the firstquarter of 2016, bond prices tend to go up. Increasing bond prices tend to result in positive returns for fixed income securities.The Stable portfolio tends to behave in the same manner. In the first quarter of 2016 all of the fixed income ETFs in the Stableportfolio experienced positive returns, this helps explain the portfolio’s return of 1.35% for the quarter.Conservative Portfolio:View important disclosures about the Conservative PortfolioBNDVanguard Total Bond MarketVUGVanguard Growth ETF5%TIPiShares TIPS Bond 15%50%IJHiShares Core S&P Mid -Cap4%VTVVanguard Value ETF 14%IWMiShares Russell 20003%VEAVanguard FTSE Developed Markets6%VWOVanguard FTSE Emerging Markets3%Portfolio Performance*3-Month1-Year3-Year5-Year10-YearAs of 3/31/20162.51%-0.44%3.33%4.76%3.87%The Conservative portfolio has a 65% allocation to fixed income and a 35% allocation to equity. In periods of declining interestrates, similar to the first quarter of 2016, bond prices tend to go up. Increasing bond prices tend to result in positive returnsfor fixed income securities. The fixed income allocation of the Conservative portfolio tends to behave in the same manner. Inthe first quarter of 2016 both of the fixed income securities in the Conservative portfolio experienced positive returns. Theportfolio’s 35% allocation to equity is divided amongst six asset categories (Large-Cap Value, Foreign Large Blend, LargeCap Growth, Mid-Cap Blend, Small-Cap Blend and Diversified Emerging); the equity securities in the Conservative portfolioexperienced returns similar to the broad based indices mentioned in the quarterly market recap. The portfolio’s allocationto Large-Cap Value, Large-Cap Growth, Mid-Cap Blend and Diversified Emerging helped contribute positive returns for thequarter; whereas its allocations to Foreign Large Blend and Small-Cap Blend were drags on return for the quarter.2
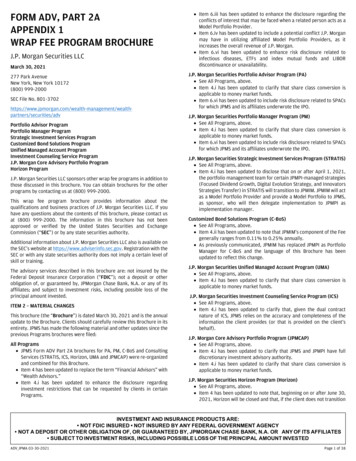
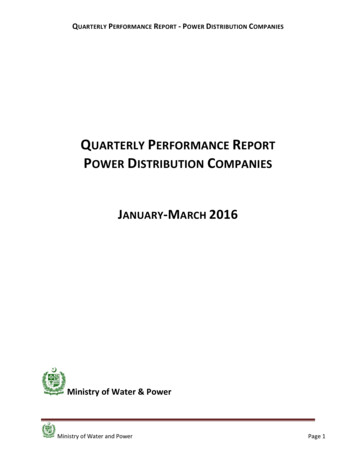
Balanced Portfolio:View important disclosures about the Balanced Portfolio40%BNDVanguard Total Bond MarketVTVVanguard Value ETF 17%VEAVanguard FTSE Developed Markets11%TIPiShares TIPS Bond 10%VUGVanguard Growth ETF8%IJHiShares Core S&P Mid- Cap6%IWMiShares Russell 20004%VWOVanguard FTSE Emerging Markets4%Portfolio Performance*3-Month1-Year3-Year5-Year10-YearAs of 3/31/20162.09%-1.39%4.12%5.30%3.32%The Balanced portfolio has a 50% allocation to fixed income and a 50% allocation to equity. In periods of declining interestrates, similar to the first quarter of 2016, bond prices tend to go up. Increasing bond prices tend to result in positive returnsfor fixed income securities. The fixed income allocation of the Balanced portfolio tends to behave in the same manner. In thefirst quarter of 2016 both of the fixed income securities in the Balanced portfolio experienced positive returns. The portfolio’s50% allocation to equity is divided amongst six asset categories (Large-Cap Value, Foreign Large Blend, Large-Cap Growth,Mid-Cap Blend, Small-Cap Blend and Diversified Emerging); the equity securities in the Balanced portfolio experienced returnssimilar to the broad based indices mentioned in the quarterly market recap. The portfolio’s allocation to Large-Cap Value,Large-Cap Growth, Mid-Cap Blend and Diversified Emerging helped contribute positive returns for the quarter. However, theportfolio’s allocations to Foreign Large Blend and Small-Cap Blend were drags on return for the quarter. Specifically, it was theBalanced portfolio’s increased allocation to Foreign Large Blend and Small-Cap Blend in relation to the Conservative portfoliowhich accounts for the return differential between the two portfolios.Moderate Portfolio:View important disclosures about the Moderate PortfolioVTVVanguard Value ETF 27%IJHiShares Core S&P Mid -Cap12%VEAVanguard FTSE Developed Markets19%IWMiShares Russell 20008%BNDVanguard Total Bond Market15%VWOVanguard FTSE Emerging Markets5%VUGVanguard Growth ETF 14%Portfolio Performance*3-Month1-Year3-Year5-Year10-YearAs of 3/31/20161.12%-3.22%6.32%6.78%4.22%The Moderate portfolio has a 15% allocation to fixed income and an 85% allocation to equity. In periods of declining interestrates, similar to the first quarter of 2016, bond prices tend to go up. Increasing bond prices tend to result in positive returnsfor fixed income securities. The fixed income allocation of the Moderate portfolio tends to behave in the same manner. In thefirst quarter of 2016 both of the fixed income security in the Moderate portfolio experienced a positive return. The portfolio’s85% allocation to equity is divided amongst six asset categories (Large-Cap Value, Foreign Large Blend, Large-Cap Growth,Mid-Cap Blend, Small-Cap Blend and Diversified Emerging); the equity securities in the Moderate portfolio experienced returnssimilar to the broad based indices mentioned in the quarterly market recap. The portfolio’s allocation to Large-Cap Value,Large-Cap Growth, Mid-Cap Blend and Diversified Emerging helped contribute positive returns for the quarter. However, theportfolio’s allocations to Foreign Large Blend and Small-Cap Blend were drags on return for the quarter. Specifically, it wasthe Moderate portfolio’s increased allocation to Foreign Large Blend and Small-Cap Blend in relation to the Balanced portfoliowhich accounts for the return differential between the two portfolios.3
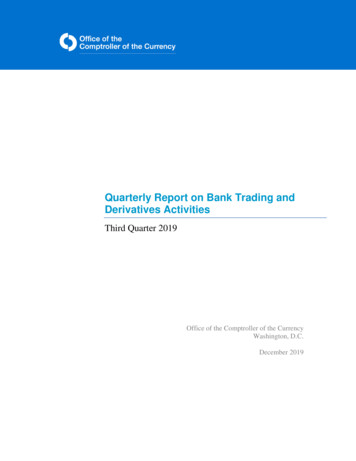
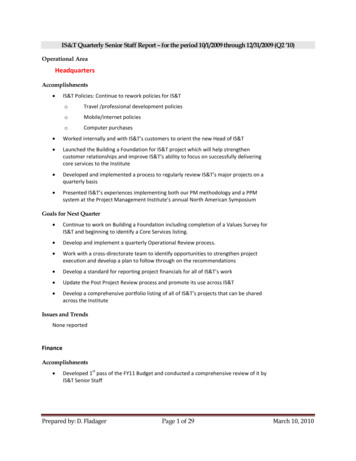
Aggressive Portfolio:View important disclosures about the Aggressive PortfolioVTVVanguard Value ETF 33%IWMiShares Russell 2000VEAVanguard FTSE Developed Markets21%VWOVanguard FTSE Emerging Markets10%5%VUGVanguard Growth ETF15%VNQVanguard REIT3%IJHiShares Core S&P Mid-Cap13%Portfolio Performance*3-Month1-Year3-Year5-Year10-YearAs of 3/31/20160.89%-3.80%7.43%7.58%4.50%The Aggressive portfolio has a 100% allocation to equity. The portfolio’s equity allocation is divided amongst seven assetcategories (Large-Cap Value, Foreign Large Blend, Large-Cap Growth, Mid-Cap Blend, Small-Cap Blend, Diversified Emergingand REITs); the equity securities in the Aggressive portfolio experienced returns similar to the broad based indices mentionedin the quarterly market recap. The portfolio’s allocation to Large-Cap Value, Large-Cap Growth, Mid-Cap Blend, DiversifiedEmerging and REITs helped contribute positive returns for the quarter. However, the portfolio’s allocations to Foreign LargeBlend and Small-Cap Blend were drags on return for the quarter. Specifically, it was the Aggressive portfolio’s increasedallocation to Foreign Large Blend and Small-Cap Blend and its zero allocation to fixed income in relation to the Moderateportfolio which accounts for the return differential between the two portfolios.The Investment Committee’s Allocation DecisionThe Capital One Advisors Investment Committee held its model portfolio review meeting on May 6, 2016.After reviewing the results of the previous quarter, the ASI efficient frontier model suggested allocations,and discussing the outlook for the coming months, the Committee determined that the model portfoliosare appropriately allocated. As mentioned above, the Investment Committee focuses on long termperformance and opportunities in line with each model portfolio’s objective.*These are based on past performance, and are not forecasts of future results. Returns reflect the asset management expense of 0.75% and the modelportfolio expense ratio. Your asset management expense may be less as Capital One Advisors, LLC offers lower asset management expenses for plans withlarger total account assets, typically beginning at 500,000. If your company uses an additional advisor or registered representative to support your plan,your asset management could be up to 0.50% higher but is capped at 1.25%.Total returns are historical and include change in share value and reinvestment of dividends and capital gains. Any holdings, asset allocation or othercomposition data shown are as of the date indicated, are subject to change at any time and may not be representative of the past model portfolio’sinvestments. Your actual model portfolio will vary based on date of purchases, if you use auto-rebalancing and other variables.Past performance is not an indication of future results. The value of your investment will fluctuate over time and it is possible to lose part or all of the amountinvested.4
Capital One Asset Management’s Quarterly SummaryMarket and Economic OverviewUS stocks finished the first quarter of the year near the flat line, however, the path to that finish was avolatile one. At one point during the quarter, the Standard and Poor’s 500 was down more than 10%, itsworst start to a year in its history. Broad commodity markets likewise began the year in the red, but likeequities, reversed course and posted small positive returns. The bond market, as represented by theBarclays Aggregate Index, posted strong quarterly returns of about 3.0%.For roughly the first half of the quarter, risk assets reacted negatively to rising risks of recession in theUS. Investors also did not believe the Federal Reserve (the “Fed”) would raise interest rates four times in2016, as the Fed had stated at its December 2015 meeting. However, economic data in the US continuedto show modest improvement. For example, the labor market continued to add jobs at a healthy clip ofabout 200,000 jobs per month; the housing market showed improvement in prices and levels of activity;regional manufacturing indexes appeared to show industrial activity was bottoming; and core inflationwas consistently above the Fed’s 2.0% target. In addition, the Fed struck a dovish tone at its Marchmeeting, acknowledging that it would likely raise interest rates only twice in 2016, a pleasant surprise thatsupported risk assets.Furthermore, the European Central Bank (the “ECB”) revealed a surprisingly strong package of measuresmeant to spur economic growth in the Eurozone. Among the most unanticipated steps was theannouncement that the ECB would expand its quantitative easing program to include corporate bonds,in addition to increasing the size of the program from 60 billion per month to 80 billion per month.The central bank also lowered its deposit rate further into negative territory, down to -0.4%. Combinedwith the policy steps announced by the Bank of Japan in February, the three major global central bankswere fully supporting global risk assets, in an effort to stimulate economic growth and stoke inflationarypressures. Risks emanating from China also subsided.The yield on the 10-Year Treasury fell sharply during the quarter, at one point touching a low of 1.66%,after having started the year at 2.27%, and settled at 1.77% at quarter’s end. The strength in the bondmarket was the result of the flight-to-safety trade, as the relative safety of Treasuries was in demand.Investment Grade Credit also performed well during the quarter, as spreads narrowed and default riskebbed. High yield bonds also posted positive quarterly returns, benefiting from the narrowing of spreadsand improving credit picture from Energy and Materials companies, though like equities, the broad indexthat tracks the sector was down over 5.0% at its worst during the quarter.Broad commodity markets gained for the quarter. Led by energy commodities, the BloombergCommodity Index rose by 0.3%. West Texas Intermediate crude jumped nearly 11%, copper rose by over4%, while wheat, corn and soybeans all increased by more than 4%. Gold, which tends to benefit in timesof turmoil, jumped by more than 16% during the quarter.Unless otherwise noted, performance and return data sourced from Bloomberg, LP as of March 31, 20165
DisclosuresFor informational purposes only. Neither the information nor any opinion expressed in this material constitutes an offer to buy orsell any security or instrument or participate in any particular trading strategy. Capital One, N.A., its affiliates and subsidiaries are notproviding or offering to provide personalized investment advice through this communication, or recommending an action to you.Capital One, N.A., its affiliates and subsidiaries are not acting as an advisor to you and do not owe a fiduciary duty to you with respectto the information and material contained in this communication. This communication is not intended as tax or legal advice; consultwith any and all internal or external advisors and experts that you deem appropriate before acting on this information or material.Wealth and Asset Management products and services are offered by Capital One, N.A. (“Bank”). All investment management clientsare clients of the Bank, who has delegated the investment management services to Capital One Asset Management, LLC (COAM) viaa master services agreement. Investment management services are provided to the Bank by COAM, a SEC registered investmentadvisor and wholly-owned subsidiary of Capital One, N.A. 2016 Capital One. All rights reserved. COAM registered with the SECin 2001 as a Registered Investment Adviser as a Separately Identifiable Division or Department (“SIDD”). In 2005, COAM changedits registration to a wholly owned subsidiary when it filed with the State of Louisiana as a Limited Liability Company. Please refer toCOAM’s ADV Part 2, which is available upon request, for additional information on COAM.Recipients of this report will not be treated as a client by virtue of having received this report. No part of this report may beredistributed to others or replicated in any form without the prior consent of Capital One.All charts and graphs are shown for illustrative purposes only. Opinions, estimates, forecasts, and statements of financial markettrends that are based on current market conditions constitute our judgment and are subject to change without notice. Theinformation has been obtained from sources believed to be reliable but we do not warrant its completeness, timeliness, or accuracy,except with respect to any disclosures relative to Capital One. The information contained herein is as of the date referenced, and wedo not undertake any obligation to update such information.Any opinions and recommendations expressed herein do not take into account an investor’s financial circumstances, investmentobjectives, or financial needs and are not intended for advice regarding or recommendations of particular investments and/or tradingstrategies, including investments that reference a particular derivative index or benchmark.Past performance is not indicative of future results. The securities described herein may be complex, may involve significant risk andvolatility, may involve the complete loss of principal, and may only be appropriate for highly sophisticated investors who are capableof understanding and assuming the risks involved. The securities discussed may fluctuate in price or value and could be adverselyaffected by changes in interest rates, exchange rates, or other factors. Asset allocation and diversification do not assure or guaranteebetter performance, and cannot eliminate the risk of investment losses.Investors must make their own decisions regarding any securities or financial instruments mentioned or discussed herein, and mustnot rely upon this report in evaluating the merits of investing in any instruments or pursuing investment strategies described herein.In no event should Capital One be liable for any use by any party, or for any decision made or action taken by any party in relianceupon, or for any inaccuracies or errors in, or for any omissions from, the information contained herein.Fixed Income securities are subject to availability and market fluctuations. These securities may be worth less than the originalcost upon redemption. Corporate bonds generally provide higher yields than U.S. treasuries while incurring higher risks. Certainhigh yield/high-risk bonds carry particular market risks and may experience greater volatility in market value than investment-gradecorporate bonds. Government bonds and Treasury bills are guaranteed by the U.S. government and, if held
Quarterly Model Portfolio Review and Market Summary for ShareBuilder 401k Plan Sponsors We are committed to helping you and your employees build toward retirement readiness. Each quarter, the Capital One Advisors Investment Committee reviews the model portfolios offered in ShareBui