Transcription
Quarterly Report on Bank Trading andDerivatives ActivitiesThird Quarter 2019Office of the Comptroller of the CurrencyWashington, D.C.December 2019
ContentsAbout This Report .1Executive Summary .1Revenue.2Insured U.S. Commercial Banks and Savings Associations’ Trading Revenue.2Holding Company Trading Revenue .2Bank Trading Revenue as a Percentage of Consolidated Holding CompanyTrading Revenue.3Counterparty Credit Risk .3Market Risk.8Value-at-Risk .8Volatility Index .8Level 3 Trading Assets .9Notional Amounts of All Derivative Contracts .10Credit Derivatives .11Compression Activity .11Centrally Cleared Derivative Contracts .12Glossary of Terms .13Index of Tables and Figures.15Appendix: Supplementary Graphs and Tables.16Quarterly Derivatives Report: Third Quarter 2019i
About This ReportThe Office of the Comptroller of the Currency’s (OCC) quarterly report on bank trading andderivatives activities is based on call report information provided by all insured U.S. commercialbanks and savings associations; reports filed by U.S. financial holding companies; and otherpublished data. A total of 1,334 1 insured U.S. commercial banks and savings associationsreported trading and derivatives activities at the end of the third quarter of 2019. A small groupof large financial institutions continues to dominate trading and derivatives activity in theU.S. commercial banking system. During the third quarter of 2019, four large commercial banksrepresented 87.2 percent of the total banking industry notional amounts and 83.2 percent ofindustry net current credit exposure (NCCE) (see tables 1 and 4 in the appendix).The OCC and other supervisors have dedicated examiners at the largest banks to continuouslyevaluate the credit, market, operational, reputation, and compliance risks of bank trading andderivatives activities. In addition to the OCC’s supervisory activities, the OCC works with otherfinancial supervisors and major market participants to address infrastructure, clearing, andmargining issues in over-the-counter (OTC) derivatives. OCC activities include development ofobjectives and milestones for stronger trade processing and improved market transparency acrossderivative categories, migration of certain highly liquid products to clearinghouses, andrequirements for posting and collecting margin.This is the 96th edition of the OCC’s Quarterly Report on Bank Trading and DerivativesActivities. The first report was published in 1995. Please send any comments or feedback on thestructure and content of this report to the OCC by email: QuarterlyDerivatives@occ.treas.gov.Executive Summary Insured U.S. commercial banks and savings associations (collectively, banks) reportedtrading revenue of 7.2 billion in the third quarter of 2019, 0.9 billion less (10.9 percent)than in the previous quarter and 0.1 billion more (2.0 percent) than a year earlier (seetable 1).Credit exposure from derivatives increased in the third quarter of 2019 compared with thesecond quarter of 2019. NCCE increased 54.2 billion, or 14.6 percent, to 425 billion (seetable 5).Derivative notional amounts decreased in the third quarter of 2019 by 3.7 trillion, or1.8 percent, to 201.1 trillion (see table 10).Derivative contracts remained concentrated in interest rate products, which totaled 147.1 trillion or 73.1 percent of total derivative notional amounts (see table 10).1Institutions with total assets of less than 5 billion have the option to file the FFIEC 051 call report. Due to thelimited amount of derivatives data provided by FFIEC 051 call report filers, this report provides this informationseparately and distinctly in table 13 in the appendix.Quarterly Derivatives Report: Third Quarter 20191
RevenueInsured U.S. Commercial Banks and Savings Associations’ TradingRevenueInsured U.S. commercial banks and savings associations reported 7.2 billion in trading revenuein the third quarter of 2019, 0.9 billion less (10.9 percent) than in the previous quarter and 0.1 billion more (2.0 percent) than a year earlier (see table 1). The quarter-over-quarter decreasein trading revenue was driven by decreases in combined interest rate and foreign exchange (FX)derivatives and equity derivatives. For a historical view of quarterly bank trading revenue byinstrument, see graph 9a in the appendix.Table 1: Quarterly Bank Trading Revenue, in Millions of Dollars3Q20192Q2019Q/QChangeQ/Q %ChangeInterest rate and foreign exchange 4,241 5,630- 1,390Equity 1,805 2,464Commodity and other 1,109- 43CreditTotal trading revenue3Q2018Y/YChangeY/Y %Change-24.7% 5,129- 888-17.3%- 659-26.7% 1,444 36225.1% 1,1532657.9% 346 763220.3% 43 30 1342.6% 141- 98-69.7% 7,198 8,081- 883-10.9% 7,059 1382.0%Source: Call reports, Schedule RIHolding Company Trading RevenueConsolidated bank holding company (BHC) trading performance provides a more completepicture of trading revenue in the banking system. As shown in table 2, consolidated holdingcompany trading revenue of 16.4 billion in the third quarter of 2019 was 2.0 billion(10.8 percent) lower than in the previous quarter. The quarter-over-quarter decrease in tradingrevenue was driven by decreases in combined interest rate and FX derivatives, equityderivatives, and credit derivatives. Year-over-year holding company trading revenue increasedby 2.7 billion (20.0 percent). For a historical view of quarterly holding company tradingrevenue by instrument, see graph 9b in the appendix.Table 2: Quarterly Holding Company Trading Revenue, in Millions of Dollars3Q20192Q2019Q/QchangeQ/Q %change3Q2018Y/YchangeY/Y %changeInterest rate and foreign exchange 9,578 10,093- 515-5.1% 6,891 2,68739.0%Equity 4,547 6,083- 1,536-25.3% 5,222- 675-12.9%Commodity and other 1,046 512 534104.3% 874 17219.7%CreditTotal HC trading revenue 1,217 1,689- 472-27.9% 666 55182.7% 16,389 18,378- 1,989-10.8% 13,653 2,73620.0%Source: Consolidated Financial Statements for Holding Companies—FR Y-9C, Schedule HIQuarterly Derivatives Report: Third Quarter 20192
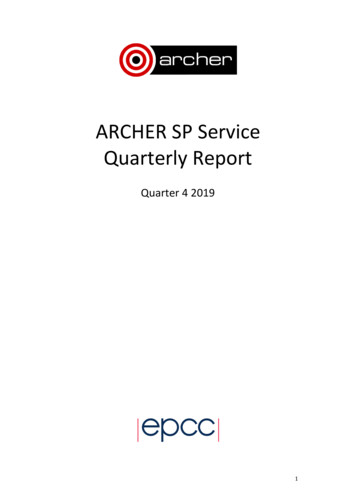
Bank Trading Revenue as a Percentage of Consolidated HoldingCompany Trading RevenueBefore the financial crisis, trading revenue at banks typically ranged from 60 percent to80 percent of consolidated BHC trading revenue. Since the financial crisis and the adoption ofbank charters by the former investment banks, the percentage of bank trading revenue toconsolidated BHC trading revenue has fallen and is now typically between 30 percent and50 percent. This decline reflects the significant amount of trading activity by the formerinvestment banks that, while included in BHC results, remains outside insured commercialbanks. More generally, insured U.S. commercial banks and savings associations have morelimited legal authorities than their holding companies, particularly in the trading of commodityand equity products.In the third quarter of 2019, banks generated 43.9 percent of consolidated holding companytrading revenue, down from 44 percent in the previous quarter (see figure 1).Figure 1: Bank Trading Revenue as a Percentage of Consolidated Holding Company Trading RevenueSource: Consolidated Financial Statements for Holding Companies—FR Y-9C (Schedule HI) and call report (Schedule RI)Counterparty Credit RiskCounterparty credit risk is a significant risk in bank derivative trading activities. The notionalamount of a derivative contract is a reference amount that determines contractual payments, butit is generally not an amount at risk. The credit risk in a derivative contract is a function of anumber of variables, such as whether counterparties exchange notional principal, the volatility ofthe underlying market factors (interest rate, currency, commodity, equity, or corporate referenceentity), the maturity and liquidity of the contract, and the creditworthiness of the counterparty.Credit risk in derivatives differs from credit risk in loans because of the more uncertain nature ofthe potential credit exposure. Because the credit exposure is a function of movements in marketfactors, banks do not know, and can only estimate, how much the value of the derivative contractmight be at various points in the future.Quarterly Derivatives Report: Third Quarter 20193
The credit exposure is bilateral in most derivative transactions, such as swaps (which make upthe bulk of bank derivative contracts). Each party to the contract may (and, if the contract has along enough tenor, probably will) have a credit exposure to the other party at various timesduring the contract’s life. With a funded traditional loan, the amount at risk is the amountadvanced to the borrower. The credit risk is unilateral as the bank faces the credit exposure of theborrower.Measuring credit exposure in derivative contracts involves identifying those contracts on which abank would lose value if the counterparty to a contract defaulted. The total of all contracts withpositive value (i.e., derivative receivables) to the bank is the gross positive fair value (GPFV)and represents an initial measurement of credit exposure. The total of all contracts with negativevalue (i.e., derivative payables) to the bank is the gross negative fair value (GNFV) andrepresents a measurement of the exposure the bank poses to its counterparties.GPFV increased by 293 billion (14.7 percent) in the third quarter of 2019 to 2.3 trillion,primarily driven by a 220 billion (16.4 percent) increase in receivables from interest ratecontracts (see table 3). GNFV increased 287 billion (14.8 percent) to 2.2 trillion during thequarter, primarily driven by a 221 billion (17.2 percent) increase in payables on interest ratecontracts.Table 3: Gross Positive Fair Values and Gross Negative Fair Values, in Billions of DollarsInterest rate3Q20192Q2019Q/QChangeQ/Q %Change3Q2018Y/YChangeY/Y %Change 1,563 1,343 22016.4% 970 59361.2%Foreign exchange 506 442 6414.5% 544- 37-6.9%Equity 115 119- 4-2.9% 132- 17-12.8% 47 36 1130.4% 52- 5-8.9%CommoditiesCredit 47 46 12.1% 55- 8-15.1% 2,279 1,987 29314.7% 1,753 52630.0%3Q20192Q2019Q/QChangeQ/Q %Change3Q2018Y/YChangeY/Y %Change 1,509 1,287 22117.2% 916 59364.7%Foreign exchange 503 445 5913.3% 518- 14-2.8%EquityGross positive fair valueInterest rate 114 120- 6-5.1% 130- 17-12.7%Commodities 52 39 1333.7% 49 24.8%Credit 50 49 00.6% 56- 7-11.6% 2,227 1,940 28714.8% 1,669 55833.4%Gross negative fair valueSource: Call reports, Schedule RC-LA legally enforceable netting agreement between a bank and a counterparty creates a single legalobligation for all transactions (called a “netting set”) under the agreement. Therefore, whenbanks have such agreements with their counterparties, contracts with negative values (an amounta bank would pay to its counterparty) can offset contracts with positive values (an amount owedby the counterparty to the bank), leaving an NCCE as shown in table 4.Quarterly Derivatives Report: Third Quarter 20194
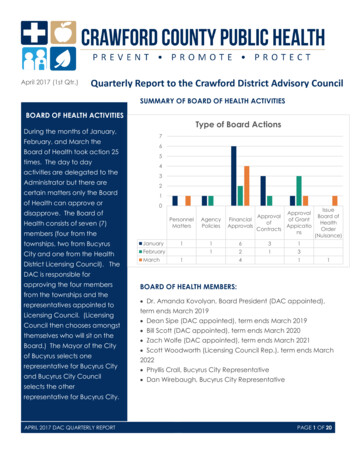
Table 4: Netting Contract ExamplesBank A portfolio with Counterparty BNumber ofcontractsContracts with positive value to Bank A6 500Gross positive fair valueContracts with negative value to Bank A4- 350Gross negative fair value10 150NCCE to Bank A from Counterparty BTotal contractsValue ofcontractsCredit measure/metricMost, but not necessarily all, derivative transactions that a bank has with an individualcounterparty are subject to a legally enforceable netting agreement. Some transactions may besubject to the laws of a jurisdiction that does not provide legal certainty of netting agreements, inwhich case banks must regard such transactions as separate from the netting set. Othertransactions may involve nonstandard contractual documentation. Transactions that are notsubject to the same legally enforceable netting agreement have distinct values that cannot benetted and for which the appropriate current credit measure is the gross exposure to the bank, ifthat amount is positive. While banks can net exposures within a netting set under the samenetting agreement, they cannot net exposures across netting sets without a separate legallyenforceable netting agreement. As a result, a bank’s NCCE to a particular counterparty equalsthe sum of the GPFV of contracts less the dollar amount of netting benefits with thatcounterparty. A bank’s NCCE across all counterparties equals the sum of its NCCE to each of itscounterparties.NCCE is the primary metric the OCC uses to evaluate credit risk in bank derivative activities.NCCE for insured U.S. commercial banks and savings associations increased by 54 billion(14.6 percent) to 425 billion in the third quarter of 2019 (see table 5). 2 Legally enforceablenetting agreements allowed banks to reduce GPFV exposures by 81.4 percent ( 1.9 trillion) inthe third quarter of 2019.Table 5: Net Current Credit Exposure, in Billions of Dollars3Q20192Q2019Q/QChangeQ/Q %Change 2,279 1,987 29314.7% 425 371 5414.6%Netting benefit RC-R 1,854 1,616 23814.8%Netting benefit % RC-R81.4%81.3%Gross positive fair valueNCCE RC-R0.1%Source: Call reports, Schedules RC-L and RC-RNCCE peaked at 804 billion at the end of 2008, during the financial crisis, when interest rateshad plunged and credit spreads were very high (see figure 2). The significant decline in NCCEsince 2008 has largely resulted from declines in the GPFV of interest rate and credit contracts.The GPFV from interest rate contracts has fallen from 5.1 trillion at the end of 2008 to 1.6 trillion at the end of the third quarter of 2019 (see table 3). In addition, on September 30,2Banks report NCCE on two different schedules (RC-R and RC-L) of the call report, and the amounts reported arenot the same because of differences in the scope of coverage. Neither measure comprehensively captures NCCE.RC-L includes exposure only from OTC derivative transactions; it excludes exchange-traded transactions. RC-Rexcludes transactions not subject to capital requirements. This report uses RC-R to measure NCCE.Quarterly Derivatives Report: Third Quarter 20195
2019, exposure from credit contracts was 47.0 billion, which is 1.0 trillion lower(95.7 percent) than the 1.1 trillion on December 31, 2008 (see table 3).Figure 2: Net Current Credit Exposure, in Billions of DollarsSource: Call reports, Schedule RC-RThe bulk of NCCE in the financial system is concentrated in banks and securities firms(42.2 percent) and in corporations and other counterparties (46.8 percent) (see table 6). Thecombined exposure to hedge funds and sovereign governments was small (11.0 percent in total).Table 6: NCCE by Counterparty Type as a Percentage of Total NCCEBanks andsecurities firmsHedge fundsSovereigngovernmentsCorp and all othercounterparties3Q 201942.2%1.9%9.1%46.8%2Q 201941.5%4.3%9.8%44.5%1Q 201943.5%4.6%9.6%42.3%4Q 201841.7%5.0%10.0%43.2%4Q 201741.7%3.1%7.9%47.3%4Q 201648.4%2.0%6.5%43.0%4Q 201553.3%2.1%6.0%38.5%Source: Call reports, Schedule RC-LA more risk-sensitive measure of credit exposure would consider the value of collateral heldagainst counterparty exposures. Reporting banks held collateral valued at 109.2 percent of theirtotal NCCE at the end of the third quarter of 2019, down slightly from 110.1 percent in thesecond quarter of 2019 (see table 7). Collateral held against hedge fund exposures increased inthe third quarter and coverage remains very high at 543.8 percent. Bank exposures to hedgefunds are secured, because banks take initial margin on transactions with hedge funds, inaddition to fully securing any current credit exposure. Collateral coverage of corporate andsovereign exposures is much less than coverage of financial institutions and hedge funds,although coverage of corporate exposures has been increasing over the past several yearsbecause of increases in the volume of trades cleared at central counterparties.Quarterly Derivatives Report: Third Quarter 20196
Table 7: Ratio of Fair Value Collateral to Net Current Credit ExposureFV hedge fundsFV sovereigngovernmentsFV corporateand all othercounterpartiesFV/NCCE %1Q 2019127.7%343.8%48.2%88.2%113.4%4Q 2018128.9%308.0%47.1%91.8%113.7%4Q 2017124.4%495.5%25.1%89.8%111.5%4Q 2016119.1%491.5%34.2%67.0%98.5%4Q 2015101.6%435.5%15.6%66.2%89.6%FV banks andsecurities firms3Q 2019131.8%2Q 2019Source: Call reports, Schedule RC-LThe majority of collateral held by banks against NCCE is very liquid with 63.1 percent held incash (both U.S. dollar and non-dollar) and an additional 12.5 percent held in U.S. Treasuries andgovernment agency securities (see table 8). Supervisors assess changes in the quality andliquidity of collateral held as a key early indicator of potential easing in credit terms. Examinersreview the collateral management practices of derivative dealers as a regular part of theirsupervision activities.Table 8: Composition of CollateralCash U.S. Cash othercurrenciesU.S.TreasurysecuritiesU.S. gov.agencyCorpbondsEquitysecuritiesAll othercollateral3Q 201935.8%27.3%11.0%1.5%1.8%6.3%16.2%2Q 201934.9%26.0%12.0%1.5%1.9%6.6%17.1%1Q 201934.0%26.0%11.9%1.6%2.1%7.4%17.2%4Q 201837.2%23.3%10.8%2.2%2.1%7.1%17.2%4Q 201737.6%25.5%10.3%1.9%2.5%5.7%16.5%4Q 201640.1%31.5%8.1%1.7%1.6%5.0%12.0%4Q 201543.7%31.7%4.6%1.6%1.4%5.3%11.7%Source: Call reports, Schedule RC-LCredit quality metrics for derivative exposures improved in the third quarter of 2019, as banksreported net recoveries of 4.8 million, compared with net charge-offs of 17.2 million in thesecond quarter of 2019 (see graph 7 in the appendix). The number of banks reporting charge-offsdecreased from 13 to 11 banks. Net charge-offs in the third quarter of 2019 represented 0.001percent of the NCCE from derivative contracts. For comparison purposes, commercial andindustrial (C&I) loan net charge-offs increased 417.1 million, or 23.5 percent, to 2.2 billionduring the quarter and were 0.1 percent of total C&I loans. Charge-offs of derivative exposurestypically are associated with problem commercial lending exposures, in which the borrower hasan associated swap transaction.Quarterly Derivatives Report: Third Quarter 20197
Market RiskValue-at-RiskBanks primarily control market risk in trading operations by establishing limits
Insured U.S. Commercial Banks and Savings Associations’ Trading Revenue Insured U.S. commercial banks and savings associations reported 7.2 billion in trading revenue in the third quarter of 2019, 0.9 billion less (10.9 percent) than in the previous quarter and 0.1 bill