Transcription
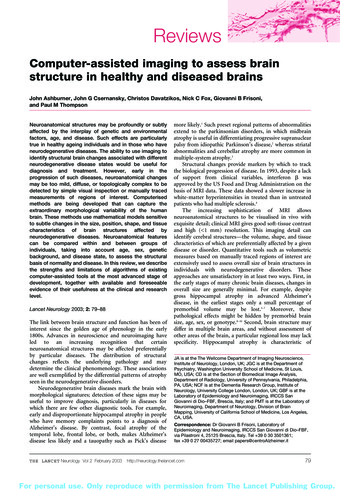
ReviewsComputer-assisted imaging to assess brainstructure in healthy and diseased brainsJohn Ashburner, John G Csernansky, Christos Davatzikos, Nick C Fox, Giovanni B Frisoni,and Paul M ThompsonNeuroanatomical structures may be profoundly or subtlyaffected by the interplay of genetic and environmentalfactors, age, and disease. Such effects are particularlytrue in healthy ageing individuals and in those who haveneurodegenerative diseases. The ability to use imaging toidentify structural brain changes associated with differentneurodegenerative disease states would be useful fordiagnosis and treatment. However, early in theprogression of such diseases, neuroanatomical changesmay be too mild, diffuse, or topologically complex to bedetected by simple visual inspection or manually tracedmeasurements of regions of interest. Computerisedmethods are being developed that can capture theextraordinary morphological variability of the humanbrain. These methods use mathematical models sensitiveto subtle changes in the size, position, shape, and tissuecharacteristics of brain structures affected byneurodegenerative diseases. Neuroanatomical featurescan be compared within and between groups ofindividuals, taking into account age, sex, geneticbackground, and disease state, to assess the structuralbasis of normality and disease. In this review, we describethe strengths and limitations of algorithms of existingcomputer-assisted tools at the most advanced stage ofdevelopment, together with available and foreseeableevidence of their usefulness at the clinical and researchlevel.Lancet Neurology 2003; 2: 79–88The link between brain structure and function has been ofinterest since the golden age of phrenology in the early1800s. Advances in neuroscience and neuroimaging haveled to an increasing recognition that certainneuroanatomical structures may be affected preferentiallyby particular diseases. The distribution of structuralchanges reflects the underlying pathology and maydetermine the clinical phenomenology. These associationsare well exemplified by the differential patterns of atrophyseen in the neurodegenerative disorders.Neurodegenerative brain diseases mark the brain withmorphological signatures; detection of these signs may beuseful to improve diagnosis, particularly in diseases forwhich there are few other diagnostic tools. For example,early and disproportionate hippocampal atrophy in peoplewho have memory complaints points to a diagnosis ofAlzheimer’s disease. By contrast, focal atrophy of thetemporal lobe, frontal lobe, or both, makes Alzheimer’sdisease less likely and a tauopathy such as Pick’s diseaseTHE LANCET Neurology Vol 2 February 2003more likely.1 Such preset regional patterns of abnormalitiesextend to the parkinsonian disorders, in which midbrainatrophy is useful in differentiating progressive supranuclearpalsy from idiopathic Parkinson’s disease,2 whereas striatalabnormalities and cerebellar atrophy are more common inmultiple-system atrophy.3Structural changes provide markers by which to trackthe biological progression of disease. In 1993, despite a lackof support from clinical variables, interferon wasapproved by the US Food and Drug Administration on thebasis of MRI data. These data showed a slower increase inwhite-matter hyperintensities in treated than in untreatedpatients who had multiple sclerosis.4The increasing sophistication of MRI allowsneuroanatomical structures to be visualised in vivo withexquisite detail; clinical MRI gives good soft-tissue contrastand high ( 1 mm) resolution. This imaging detail canidentify cerebral structures—the volume, shape, and tissuechracteristics of which are preferentially affected by a givendisease or disorder. Quantitative tools such as volumetricmeasures based on manually traced regions of interest areextensively used to assess overall size of brain structures inindividuals with neurodegenerative disorders. Theseapproaches are unsatisfactory in at least two ways. First, inthe early stages of many chronic brain diseases, changes inoverall size are generally minimal. For example, despitegross hippocampal atrophy in advanced Alzheimer’sdisease, in the earliest stages only a small percentage ofpremorbid volume may be lost.5–7 Moreover, thesepathological effects might be hidden by premorbid brainsize, age, sex, or genotype.8–10 Second, brain structure maydiffer in multiple brain areas, and without assessment ofother areas of the brain, a particular regional loss may lackspecificity. Hippocampal atrophy is characteristic ofJA is at the The Wellcome Department of Imaging Neuroscience,Institute of Neurology, London, UK; JGC is at the Department ofPsychiatry, Washington University School of Medicine, St Louis,MO, USA; CD is at the Section of Biomedical Image Analysis,Department of Radiology, University of Pennsylvania, Philadelphia,PA, USA; NCF is at the Dementia Research Group, Institute ofNeurology, University College London, London, UK; GBF is at theLaboratory of Epidemiology and Neuroimaging, IRCCS SanGiovanni di Dio–FBF, Brescia, Italy; and PMT is at the Laboratory ofNeuroimaging, Department of Neurology, Division of BrainMapping, University of California School of Medicine, Los Angeles,CA, USA.Correspondence: Dr Giovanni B Frisoni, Laboratory ofEpidemiology and Neuroimaging, IRCCS San Giovanni di Dio–FBF,via Pilastroni 4, 25125 Brescia, Italy. Tel 39 0 30 3501361;fax 39 0 27 00435727; email t.com79For personal use. Only reproduce with permission from The Lancet Publishing Group.
ReviewComputational neuroanatomyAlzheimer’s disease but is also present, although lessseverely, in other degenerative diseases such asfrontotemporal degeneration,11,12 which also features notablefrontal and temporal cortical atrophy.13Developments in computer science may offer some help.First, new approaches have become increasingly automated,which avoids error-prone and labour-intensive manualmeasurements. Second, such algorithms can offerunprecedented precision; they can detect brain-volumedifferences of 0·5% between images from the sameindividual.14The effort to develop such algorithms has been referredto as computational anatomy.15 The individual algorithmscan be classified into two broad groups based on theiranticipated use: algorithms devised to detect groupdifferences at one point in time and those devised to detectprospective changes over time. The first group can beespecially useful to define disease-specific signatures and toreveal the selective vulnerability of different cell types todifferent pathologies, which may guide treatment strategies.The second group can be applied to one or more individualsto track disease progression, be it the natural history or asmodified by treatment. These tools can also correlatesymptoms or functions with involvement of a givenstructure or neural system. It should be kept in mind that,although an algorithm may have been developed for onepurpose, it can also be useful for another. Tools in the twogroups have been adapted to analyse individual cases, anissue of great interest to improve clinical diagnosis.In this review, we describe the strengths and limitationsof algorithms of computational anatomy at the mostadvanced stage of development, together with available andforeseeable evidence of their usefulness at the clinical andresearch level. We discuss separately tools capable ofdetecting cross-sectional group differences at a given timeand also tools that are able to detect changes in individualpeople over time (table). For the group tools, we also addressthe methods used for analysis—ie, whole-brain versusregion of interest. Computational strategies aimed atassessment of individual cases are in their infancy and will beonly briefly discussed.the MR images) are separated; tissue segmentation, in whichvoxels representing grey and white matter and CSF areseparated on the basis of intensity values; spatialnormalisation, also called registration, in which the voxels ofinterest are matched to a template or an earlier scan from thesame individual; and statistical comparison of differentgroups of patients or points in time. Errors can arise in thebrain-extraction and segmentation phases; for example,partial volume effects can cause some periventricular whitematter to be classified as grey. However, the pivotal step ofall methods is registration. Cross-sectional methods matchimages of interest to a reference stereotactic template (atypical brain or a typical hippocampus, etc) or templates toimages, and prospective methods match sequential images ofthe same patients taken at different times, with use of thefirst image as the reference (table16–21). Most methods permitvolumetric measurements, although pure shape variablescan also be extracted.Registration strategiesRegistration strategies differ in their scope—ie, analysis ofthe whole brain or preselected regions of interest—andmathematical approach, which takes into account global orlocal variability of the brain’s size and shape. Many crosssectional methods that account for global variability arecompletely automated, whereas those that account for localvariability frequently require manually positionedlandmarks to precisely match the image to the template.Prospective methods use the complexity of each individual’sbrain structure to align accurately an individual’s serialimages.In the statistical comparisons of groups of patients ortime points, the variable of interest can be derived from thegrey-scale values of voxels (voxel-based approaches) or fromdeformation fields (deformation-based approaches).Current voxel-based approaches first remove global orglobal and local variability, and then modulate voxelintensity according to contraction or expansion duringregistration. Differences in voxel intensity reflect the amountor concentration of grey or white matter.Cross-sectional methodsComputational anatomy algorithmsMost computational anatomy algorithms involve some or allof the following steps: brain extraction, in which brain andnon-brain voxels (volume elements represented as pixels onGlobal variability is removed by the approach developed atthe Wellcome Department of Imaging Neuroscience group,London, UK, based on statistical parametric mapping, andreferred to here as Ashburner and Friston’s method.16 GlobalBasic features of registration and analysis in computational neuroanatomyRegistrationMatchingModelled brainvariabilityManually positionedlandmarksAnalysisModelled voxelvariabilityMeasure ofinterestImage to templateImage to templateImage to templateTemplate to imageGlobalGlobal and ationDeformationVolumeVolumeVolume and shapeVolume and shapeImage to imageImage to me and shapeCross-sectional methodsAshburner and Friston’s method16RAVENS17Cortical pattern matching18Diffeomorphic mapping of hippocampus19Prospective methodsBrain-boundary shift integral20Voxel-compression mapping2180THE LANCET Neurology Vol 2 February 2003http://neurology.thelancet.comFor personal use. Only reproduce with permission from The Lancet Publishing Group.
ReviewComputational neuroanatomyand local variability is removed by a technique developed atthe Section of Biomedical Image Analysis at the Departmentof Radiology, University of Pennsylvania, PA, USA, calledregional analysis of volumes examined in normalised space(RAVENS).17Local registration removes all the variability in shape ofregions of interest between individuals (eg, the corticalmantle or the hippocampus). A deformation field can becomputed that stores information on the extent of warping,intensity increase or decrease, or a combination of these, foreach voxel to obtain the precise match between the imagesand the template. Deformation fields can be computed bywarping the images of interest to a template or vice versa.Therefore, deformation fields are compared rather thanregistered images. We will discuss cortical pattern matching,developed at the University of California at Los Angeles, CA,USA18 and diffeomorphic mapping of the hippocampusdeveloped at Washington University School of Medicine,MO, USA (table).15,19groups have been successfully used on prospective data andto assess changes in individuals.24 Most algorithms areundergoing constant refinement and updating by theoriginal developers and users, and details of Ashburner andFriston’s are available at http://www.jiscmail.ac.uk/lists/spm.html in the JISCMAIL archives.Automatic softwares other than those we discuss indetail have been developed for segmentation andregistration.25,26 These systems automatically assign voxelsto several subcortical brain structures (striatum, claustrum,thalamus) and to cortical regions (frontal, temporal,parietal, and occipital) and can be useful for analysis ofanatomical differences. Besides cortical pattern matching,additional methods have been developed to measure thethickness of the cortex that can also compare corticalanatomy across individuals and groups.27Prospective methodsThe key distinction between the Ashburner and Friston’sapproach and RAVENS is a difference in spatialnormalisation methods. Ashburner and Friston’s methoduses linear and non-linear warping algorithms that removeglobal brain variability; RAVENS uses a very highdimensional (the number of dimensions is equal to thenumber of voxels in the template and target scans) threedimensional warping technique aimed at removal of localand global variability.28 The two methods modulate voxelintensity in relation to voxel expansion or contractionduring registration.28,29Registered grey-matter images are smoothed with an8–12 mm filter. This method yields normally distributeddata and allows the use of statistical parametric tools. Thestatistical approach of Ashburner and Friston’s method(statistical parametric mapping) is based on the generallinear model, and identifies regions of tissue with increasedor decreased density or concentration that are significantlyrelated to the effects under study.30 Ideally, the thresholdfor significance should be set at p 0·05, corrected formultiple comparisons, but when a hypothesis has beenformed of the expected effect, a threshold of p 0·001uncorrected can be used. However, like every statisticaltest, the larger the effect size and group size, the higher thesensitivity of the method for identifying differences. If nonparametric modelling is desirable, a non-parametricversion (statistical non-parametric mapping) can be used.31Ashburner and Friston’s method has beenimplemented in software that runs under MicrosoftWindows or UNIX systems, which can be downloadedfrom http://www.fil.ion.ucl.ac.uk/spm at no cost. TheRAVENS method can be used in an automated system,requiring UNIX or Linux operating systems, or a semiautomated mode, and requires UNIX or Linux withOpenGL graphics capabilities, and is available from one ofthe authors (CD).Image registration can be more straightforward for detectionof prospective changes within individuals. The methodinvolves matching an image to others for the same persontaken at different times. By contrast with cross-sectionalmethods, the unique morphology of any individual’s brain isnot an issue, and the complexity of the brain structure itselfis used to achieve accurate matching. Only changes overtime are measured, and the complex brain shape and size isassumed to be generally invariant in the same individual.Information on prospective global changes can be obtainedby rigidly matching serial scans and subtracting thesuperimposed images. The difference reflects the volume ofbrain tissue lost or gained (eg, brain-boundary shift integral20or structural image evaluation using normalisation ofatrophy).22,23 Information on local changes can be obtainedby use of non-linear registration, which permitscompression or expansion of each voxel to obtain a preciseregistration (voxel-compression method). The resultingdeformation fields provide a map (voxel-compression map)of the amount of compression or expansion applied at eachvoxel. This change reflects the amount of brain tissue orcerebrospinal fluid lost or gained between scans. Typicalpatterns of change under different conditions (eg, normalageing vs Alzheimer’s disease) can be identified byregistration and averaging of individual voxel-compressionmaps and comparing the resulting averages.RequirementsTo be done well, all methods need high spatial resolutionand clear differentiation between tissue types. Normally,three-dimensional, high-resolution, T1-weighted MRI(spoiled gradient or magnetisation-prepared rapid-acquisition gradient recalled echo) acquired with conventional 1·5TMR scanners and 1 mm3 voxels (ideally isotropic) across thecranium provide sufficient detail and contrast.These methods represent a set of flexible and dynamicrather than strictly defined tools. Algorithms originallydeveloped to detect cross-sectional differences amongTHE LANCET Neurology Vol 2 February 2003The methodsWhole-brain analysis with voxel-basedmorphometryCortical pattern matchingCortical pattern matching is a sensitive approach thathttp://neurology.thelancet.com81For personal use. Only reproduce with permission from The Lancet Publishing Group.
ReviewComputational neuroanatomymeasures the topological variability of the cortex.32–35The approach consists of two basic steps: cortical flatteningand sulcal matching. To make an average cortical modelfor a group of individuals, all MR scans are first globallyaligned to a standard three-dimensional coordinate space.From each individual’s MR scan, a three-dimensionalcortical surface model is extracted, consisting of a networkof discrete triangular tiles. All consistent sulcal or gyrallandmarks are identified on the cortical model, which isthen flattened. Sulcal features are aligned acrossindividuals with a warping technique. An average set ofsulcal curves derived from many people is overlaid onthe flat map. These maps are warped so that thoseindividual sulcal features in them are driven intocorrespondence with the average set of sulcal curves. Thesewarped images are averaged together and decoded.Importantly, measures of grey-matter density, andfunctional imaging data if available, may be convectedalong with these warps and plotted on the averagecortex before statistical analysis. As in Ashburner andFriston’s method, ANCOVA can be applied to the corticalsurface maps. Regions are identified in which deficits aremost closely correlated with symptoms or diseaseprogression.This modelling technique can be executed on high-enddesktop computers. These algorithms are frequently used inclient–server mode, connecting to a supercomputer for verylarge-scale analyses,36 and are available from one of theauthors (PT).Diffeomorphic mapping of the hippocampus andother closed brain structuresgroups of patients, including patterns of hemisphericalasymmetry; assess the degree to which the volume andshape of such structures change within individuals overtime; and test for differences in brain-structure volumes andshapes between groups with and without neurologicaldiseases.19,39–41Definition of the brain structures of interest within thetemplate scan depends on contributions from specialists inneuroanatomy, radiology, and neuropathology. In addition,the initial step of the algorithm is guided by landmarksmanually placed within the template and target MR scans.42However, once the chosen structures within the template havebeen defined and the target scans have been landmarked, theburden for applying this neuroanatomical information tolarge numbers of individual target scans lies solely with thetransformations.Algorithms can be done with software for desktoppersonal computers. Interested investigators can inquire atSurgical Navigation Technologies (Louisville, Colorado, USA)about obtaining available versions of these methods.Brain-boundary shift integral methodThe comparison of serial images always starts withregistration. To assess global cerebral loss, this matchingis done by rigid-body registration. As a result of thestructural readjustments that occur within the brain inneurodegenerative disorders, the image produced bysubtracting the registered repeat image from the initial imageshows intensity loss at tissue boundaries. The intensityloss corresponds to the positional shift caused by the structuralreadjustment, and, hence, tissue loss can be approximated bycalculation of the volume through which the boundary hasshifted (brain-boundary shift integral).20Diffeomorphic brain mapping represents neuroanatomicalstructures by use of templates and their0·2variability by probabilistic transformations applied to the templates.15,37,380·2Displacement maps are generated bycalculation of the difference between thelocations of several thousand points on0·0the hippocampal surface compared with0·0the overall mean of the points (thetemplate). The transformations are highdimensional as well as diffeomorphic(invertible, continuous, and differen0·100·08tiable), which makes them especially0·090·070·08sensitive to subtle forms of neuroan0·070·06atomical variation.0·060·05When the template is constructed0·050·040·04from an MR scan and information0·030·03identifying the boundary of a structure is0·020·02carried along with the transformation,0·010·010·00selected structures within MR scans of0·00individuals are automatically defined.More importantly, the transformationfields and metrics derived from them Figure 1. Age-related changes of brain structure. Top: percentage difference between youngerby singular value decomposition (ie, (59–69 years) and older (75–90 years) participants, revealing regional patterns of brain atrophy inthe grey matter (left) and the corpus callosum (right). The underlying fuzzy grey-scale images arenon-zero vectors, or eigenvectors) can sections of the average distribution of the grey matter from all participants. Bottom: projection ofbe used to: define composite shapes the age differences on the cortical surface. Colour-scale shows relative change as a decimaland volumes of brain structures in fraction—eg, 0·02 2%.82THE LANCET Neurology Vol 2 February 2003http://neurology.thelancet.comFor personal use. Only reproduce with permission from The Lancet Publishing Group.
ReviewComputational neuroanatomyVoxel-compression mappingUnrelatedFraternalIdenticalRigid-body registration, however,individuals (reference)twinstwinscannot model localised brain changes.WFWTo assess these changes, matchingneeds to be done with a non-linearalgorithm that will permit localiseddeformation, such as one that modelsthe brain as a compressible viscousS/Mfluid.21,43 The repeat image is firstrigidly registered to the initial scan,then non-linear registration is used tomatch the scans locally as well asglobally:thegoverningfluidequations are repeatedly solved tokeep to a minimum all differencesbetween scans. The expansion orcontraction that has occurred in eachvoxel is calculated from thedeformation field to create the voxelcompressionmap;contractionimplies local atrophy and expansionimplies local growth (eg, in a CSF Figure 2. Genetic continuum of similarity in brain structure in identical and fraternal twins, and nonrelated individuals. Colour-coded maps show the percentage reduction in within-pair variance for eachspace).To find out which features are cortical region. Purple/blue normal between-individual difference (100% of normal); green 60% ofnormal differences; red 30% of normal differences. F frontal cortex; S/M sensorimotor cortex;consistent for a particular disease, W Wernicke’s language cortex. Figure reproduced with permission from Nature Publishing Group.robust group analysis is required.Statistical parametric mapping analysis30 of fluidly registered age-related grey-matter loss in the hippocampus and in theimages incorporates the neuroanatomical sensitivity of orbitofrontal cortex (figure 1). Some of these findings are inwithin-individual registration and the power of group agreement with pathological data, but future studies willcomparisons done with between-individual registration.need to clarify whether inconsistent results are due toA practical difficulty with any prospective method is different performances of the image analysis tools or tothat MR scanners regularly undergo substantial hardware different study populations. In this dataset, RAVENS alsoand software modifications. Since these changes can showed increased white-matter volume in the anteriorsubstantially alter image quality and intensity contrast, the portion of the splenium in women but not in men.same scanner and MR acquisition parameters should be Significant correlations were noted between regionalused for baseline and repeat scans. As with any other callosal measurements and verbal and non-verbalmethod of measuring changes in brain volume over time, neuropsychological tests.47 These results are consistent withthese methods are also sensitive to subtle brain changes that post-mortem reports48 and with the hypothesis that greatersplenial size facilitates more bilateral processing of tasks byare not disease-related, such as hydration.44Other prospective methods have been developed such as women.structural image evaluation using normalisation ofIn fraternal (dizygotic) and identical (monozygotic)atrophy,45 which finds all brain-surface edge points and twins, cortical pattern matching has been used to investigateestimates the motion of these edge points from one time the amount and location of genetic control over the cerebralpoint to the next. A cross-sectional evolution has been cortex (figure 2). The patterns were averaged and compareddeveloped.22,23 There are no studies that compare the with the average differences that would be seen betweenperformance of this method and the brain-boundary shift pairs of randomly selected unrelated individuals. Fraternalintegral method.twins exhibit 30% of the normal between-individualdifferences, and these affinities are largely restricted toClinical findingsperisylvian language and spatial association cortices.Structural differences related to age, sex, andGenetically identical twins display only 10–30% of normalgenotypedifferences in a large anatomical band spanning frontal,By application of Ashburner and Friston’s method to a large sensorimotor, and Wernicke’s language cortices, whichdatabase of normal individuals aged 18–79 years, age- suggests strong genetic control of brain structure in theserelated grey-matter loss could be seen bilaterally in the regions.33insula, superior parietal gyri, and central and cingulatesulci, whereas the amygdala, hippocampi, and entorhinal Morphological signatures of brain diseasescortex exhibited little or no age effect.29 On images taken in Alzheimer’s disease91 people aged 59–85 years (mean age 80·7) enrolled in the With Ashburner and Friston’s method, hippocampalBaltimore Longitudinal Study of Aging,46 RAVENS detected atrophy has been visualised in Alzheimer’s disease. This33THE LANCET Neurology Vol 2 February 2003http://neurology.thelancet.com83For personal use. Only reproduce with permission from The Lancet Publishing Group.
ReviewComputational neuroanatomyFigure 3. Early grey-matter changes in Alzheimer’s disease. Voxels of decreased grey-matter density detected with Ashburner and Friston’s method inthe amygdala and hippocampal complex and temporal cortex are shown in yellow. Significant voxels are superimposed on MRI of one participant.Figure reproduced with permission from BMJ Publishing Group.54method and cortical pattern matching have shown volumeloss in the posterior cingulate gyrus and adjacentprecuneus, and the temporoparietal association cortex.49,50This atrophy profile is consistent with metabolic deficitscommonly reported in fluorodeoxyglucose PET studies,and with amyloid- peptide and neurofibrillary-tangledistribution.51,52 In most studies in Alzheimer’s disease inwhich Ashburner and Friston’s method was used,53–55atrophy has been noted in the caudate nucleus. Althoughthis finding is not immediately understandable, ithighlights the need for strong biological or physiologicalplausibility to accept the findings of computationalneuroanatomy techniques. In three patients who had verymild Alzheimer’s disease (Mini-Mental State Examinationscores of 26 and 27), compared with 26 non-dementedcontrols, the amygdalar-hippocampal complex wassignificantly atrophied bilaterally (p 0·0001 uncorrectedfor multiple comparisons), which suggests that thetechnique is also sensitive in small groups and in theearliest stages of the disease (figure 3).54With use of diffeomorphic brain mapping of thehippocampus, volume loss has been detected in the head ofthe hippocampus and along the lateral edge of thehippocampal body in patients with very mild Alzheimer’sdisease, but in non-demented elderly controls a generalflattening of the structure without volume loss wasdetected (figure 4). The linear combination ofhippocampal volumes with two eigenvectors, whichreflects a distinct pattern of neuroanatomical deformation,significantly distinguished individuals with very mildAlzheimer’s disease from non-demented elderly controls,with sensitivity and specificity of 83% and 78%. A differentset of eigenvectors, which reflect a different pattern,distinguished the non-demented elderly from youngercontrols with 100% accuracy. Therefore, the knownbiological and pathological differences between ageing andAlzheimer’s disease can be appreciated at the macroscopicstructural level as different shape deformations of selectedbrain structures.Frontotemporal versus semantic dementiaDifferent patterns of cortical atrophy have been seen infrontotemporal and semantic dementia by use ofAshburner and Friston’s method. In frontotemporaldementia, there is notable involvement of the rightdorsolateral frontal and left premotor cortex, and in84semantic dementia involvement of the ante
of prospective changes within individuals. The method involves matching an image to others for the same person taken at different times. By contrast with cross-sectional methods, the unique morphology of any individual’s brain is not an issue, and the complexity of the brain structure itself is used to achi