Transcription
Petimar et al. International Journal of Behavioral Nutrition and Physical Activity(2019) ARCHOpen AccessEvaluation of the impact of calorie labelingon McDonald’s restaurant menus: a naturalexperimentJoshua Petimar1* , Maricelle Ramirez2,3, Sheryl L. Rifas-Shiman2, Stephanie Linakis2, Jewel Mullen4,Christina A. Roberto5 and Jason P. Block2AbstractBackground: The long-term effect of calorie labeling on fast-food purchases is unclear. McDonald’s voluntarilylabeled its menus with calories in 2012, providing an opportunity to evaluate this initiative on purchases.Methods: From 2010 to 2014, we collected receipts from and administered questionnaires to 2971 adults, 2164adolescents, and 447 parents/guardians of school-age children during repeated visits to 82 restaurants, includingMcDonald’s and five control chains that did not label menus over the study period in four New England cities. In2018, we analyzed the data by using difference-in-differences analyses to estimate associations of calorie labelingwith calories purchased (actual and estimated) and predicted probability of noticing calorie information on menus.Results: Calorie labeling at McDonald’s was not associated with changes in calories purchased in adults (change 19 cal pre- vs. post-labeling at McDonald’s compared to control chains, 95% CI: 112, 75), adolescents (change 49 cal, 95% CI: 136, 38), or children (change 13 cal, 95% CI: 108, 135). Calorie labeling generally increased thepredicted probability of noticing calorie information, but did not improve estimation of calories purchased.Conclusions: Calorie labeling at McDonald’s was not associated with changes in calories purchased in adults,adolescents, or children. Although participants were more likely to notice calories on menus post-labeling, therewas no improvement in ability to accurately estimate calories purchased.Keywords: Calorie labeling, Menu labeling, Nutrition policy, Natural experiment, Obesity preventionBackgroundIn May 2018, restaurant chains with 20 or more locationsin the United States were mandated to label their menuswith calorie information to comply with the menu labelingprovision of the 2010 Patient Protection and AffordableCare Act (ACA) [1]. Policymakers adopted this requirement to increase awareness of the calorie content of prepared food purchased outside the home, especiallyrestaurant food, where calories are underestimated by restaurant patrons [2–4]. The federal policy also preemptedcity and state laws requiring calorie labeling, establishinguniform requirements for chain food establishmentsacross the country [5]. The downstream goal of the law is* Correspondence: jsp778@mail.harvard.edu1Department of Epidemiology, Harvard T.H. Chan School of Public Health,677 Huntington Avenue, Boston, MA 02115, USAFull list of author information is available at the end of the articleto enhance diet quality by changing consumer behaviorand encouraging food retailers to offer lower calorie items.In part, due to several delays in implementation of the law[5], many large restaurant chains began voluntarily postingcalories on their menus before it was required, includingMcDonald’s, which began labeling in September 2012.Despite the popularity of calorie labeling [6] and thefederal requirement, the effectiveness of this policy forreducing calories purchased in restaurants is unclear. Although some previous observational and experimentalstudies have found that calorie labeling reduces caloriespurchased [7–11], other studies have found no difference, especially those conducted in real-world settings,primarily at fast-food restaurants [12–19]. Importantly,many studies that previously examined this associationlacked appropriate comparison groups [20]. Few studiesin adolescents and children have had large enough The Author(s). 2019 Open Access This article is distributed under the terms of the Creative Commons Attribution 4.0International License (http://creativecommons.org/licenses/by/4.0/), which permits unrestricted use, distribution, andreproduction in any medium, provided you give appropriate credit to the original author(s) and the source, provide a link tothe Creative Commons license, and indicate if changes were made. The Creative Commons Public Domain Dedication o/1.0/) applies to the data made available in this article, unless otherwise stated.
Petimar et al. International Journal of Behavioral Nutrition and Physical Activitysamples to examine this association overall or in subgroups [14, 17, 21].To address these gaps, we conducted a study to evaluate McDonald’s calorie labeling on customers’ actualand estimated calorie content of purchased foods, compared to customers of five fast-food chains that did notimplement labeling over the study period. We examinedthis separately in adults, adolescents, and children.MethodsStudy area and restaurant selectionWe capitalized on a natural experiment to examine caloriepurchases before and after voluntary calorie labeling atMcDonald’s in 2012 compared to a group of control restaurants: Burger King, Subway, KFC (except for adolescents),Wendy’s, and Dunkin Donuts (only for adolescents). Thesewere chosen as control restaurants because they are similarto McDonald’s in popularity, price point, and types of mealsserved. Further, all have a wide range of menu offerings interms of calories, allowing us to detect changes in overalltrends in calorie purchases independent of labeling. Otherdetails regarding the process and rationale for restaurant selection have been described previously [2]. Our study areaincluded Boston and Springfield, Massachusetts; Hartford,Connecticut; and Providence, Rhode Island, four large NewEngland cities with substantial racial and socioeconomic diversity. For adults and children, we randomly selected threeMcDonald’s, three Burger Kings, two Subways, one KFC,and one Wendy’s in each city in 2010. These restaurantchains were chosen because they had at least two locationsin each city and offered dinnertime meals. Restaurants thathad closed or whose management refused participation in2010 were replaced by randomly selecting another restaurant of the same chain in the same city. We revisited thesame restaurants every year from 2011 to 2014 except whenmanagement refused to participate, in which case we selected the nearest restaurant of the same chain. We sampled adults and children in 48 restaurants, 37 of whichwere included in both the pre-intervention (i.e. 2010–2012)and post-intervention periods (i.e. 2013–2014). Data collection in 2012 was limited and only done to supplementcollection in restaurants that were added in 2011. We collected participant surveys and receipts in the evenings fromApril to August in each year of data collection.The restaurant selection procedure was similar foradolescent participants, except we chose restaurantchains with at least two sites within one mile of a highschool (three McDonald’s, two Burger Kings, two Subways, two Dunkin Donuts, and one Wendy’s in eachcity) and enrolled participants in the early afternoonduring the school year and at lunchtime over the summer. We believed this sampling strategy would help usrecruit adolescents, especially after school when theymay be unaccompanied by adults, thereby minimizing(2019) 16:99Page 2 of 11the influence of parent and guardian preferences. We excluded restaurants poorly attended by adolescents; thisresulted in more exclusions in the pre-interventionperiod for adolescents (n 11) than we had for adultsand children (n 5). As a result, we visited more restaurants to recruit the adolescent sample than we did foradults and children. Overall, we sampled adolescentsfrom 53 restaurants, 37 of which were included in boththe pre- and post-intervention periods. We collectedsurveys from June to August in each year of data collection; in Boston only, we collected a separate after-schoolsample from April through June in each year of datacollection. This study was approved by the institutionalreview board of Harvard Pilgrim Health Care.Participant enrollmentWe invited all adults ( 18 years), adolescents (11–20 years),and parents or legal guardians of children (3–15 years) toparticipate. While there was an overlap in age eligibility forthe groups, we enrolled them at different times of day,making it unlikely that any participants were included inboth samples. As described previously [2], we approachedrestaurant customers as they entered the restaurant and requested they return the receipt and complete a questionnaire upon exiting in exchange for a 2 incentive. Afterparticipants returned their receipt, we administered a questionnaire asking them to identify which items on the receiptwere purchased for their personal consumption (or theirchild’s for the children sample). With the questionnaire, wefurther assessed details that were not clear from the receipt,such as whether items were shared, the use of sauces/condiments, the addition of cheese, the type of salad dressing,and specific beverage choices. We also asked participants toestimate their meal’s calorie content and assessed participant characteristics. We gathered all information directlyfrom adults and adolescents; for children, all questions weredirected to their parent or legal guardian. Although adultsand children were enrolled at the same restaurants andtimes, we did not include parents or legal guardians in theadult sample if their accompanying child was enrolled (wepreferentially enrolled children when an adult was accompanying a child). We administered questionnairesin English, but a Spanish language version of the recruitment script was available to facilitate recruitmentof Spanish speakers. The overall response rate was approximately 42% for adults (40% pre-intervention and45% post-intervention), 46% for adolescents (43% preintervention and 51% post-intervention), and 44% forchildren (44% both pre- and post-intervention).OutcomesOur primary outcome was total calories purchased foreach participant, which was calculated by linking itemspurchased for participants’ consumption to nutrition
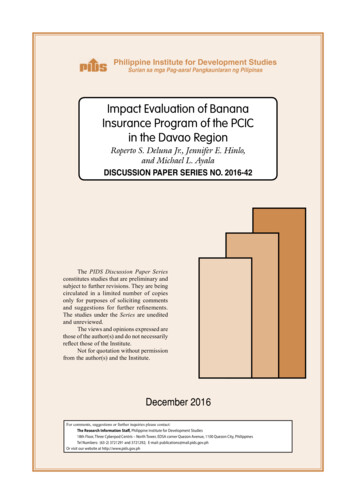
Petimar et al. International Journal of Behavioral Nutrition and Physical Activityinformation from restaurant websites (collected in July ofeach year of the study) and summing the total calories purchased for each participant. Estimated total calories purchased was a secondary outcome because we wanted todetermine if labeling helped consumers understand theoverall calorie content of their meals (even if they did notpurchase fewer calories). We also included whether participants noticed calorie information on menus as a secondaryoutcome. Both of these were assessed on questionnaires.CovariatesWe measured participant characteristics that we hypothesized might affect response to labeling on questionnaires, including age, sex, race/ethnicity (“White,” “Black,” “Hispanic,”“Asian” and/or “Other”), and self-reported weight andheight, which we used to calculate body mass index (BMI).We also asked participants how important price, taste, convenience, and the total number of calories were when deciding which items to order at the restaurant (“not at all”, “alittle”, or “a lot”).Statistical analysisWe conducted analyses separately in adults, adolescents,and children. We excluded participants whose estimatedor actual calorie intake exceeded 5000 cal ( 1% in allsamples) and those who had missing data on any of thecovariates in our main model (n 179 adults [6%], n 115 adolescents [5%], n 72 children [14%]).For our primary analyses examining the associationbetween calorie labeling and calories purchased after labeling in 2012, we fit multivariable generalized estimating equations (GEE) that included indicator variables forgroup (McDonald’s vs. other) and period (pre- vs. postlabeling), an interaction term between group and period(βinteraction), which estimated the effect of calorie labeling, and covariates whose distributions appeared tochange slightly over time differently between groups:age, sex, race/ethnicity, BMI, city, and restaurant chain.In adolescents and children, we adjusted for BMI-forage-and-sex z-score, calculated from national referencedata [22], instead of BMI. We included these covariatesbecause if the population composition of the two intervention groups changed differently over time, and wererelated to calorie purchases, this could bias the association between labeling and calorie purchases. To account for correlation between purchases in the samerestaurant, we included restaurant location as a randomeffect. We additionally examined differences in caloriespurchased between the post- and pre-intervention periods within each intervention group.In secondary analyses, we examined differences in thepredicted probability of underestimating the calorie content of purchased meals, as well as whether participantsnoticed calorie information on menus. For each analysis,(2019) 16:99Page 3 of 11we excluded individuals missing data on the respectiveoutcome (across samples: 7–12% missing calorie underestimation; 1–2% missing noticing calorie information).We ran multivariable GEEs, adjusting for the same covariates as in our primary analysis, and obtained standardizedpredicted probabilities of each outcome [23, 24] withineach group and period. We then found the difference inmean standardized predicted probabilities between thepost- and pre-intervention periods for each interventiongroup, calculated the difference-in-differences, and obtained 95% confidence intervals (CI) from 1000 bootstrapped samples. In sensitivity analyses, we consideredunderestimation of calories purchased as a continuousmeasure, rather than a binary measure. We additionallycalculated the proportion of customers who reportedusing calorie labels to make purchasing decisions amongthose who said they noticed the calorie labels in McDonald’s in the post-labeling period.One important assumption of difference-in-differencesanalyses is that the pre-trend values for the outcomesare similar in the intervention and control groups. Totest this, we ran the primary models described abovewith observations from 2010 and 2011 only and evaluated the interactions between intervention group andtime (there were too few participants enrolled in 2012 toinclude in this analysis). We did not detect any significant interactions (P-interaction 0.20 for all), and therefore had no evidence that the pre-intervention trends inthe outcomes differed between intervention and controlgroups.We conducted sensitivity analyses where we repeated allprimary and secondary analyses additionally adjusting forimportance of calories, convenience, price, and taste inparticipant food choices, as well as whether participantsproperly estimated recommended daily calorie intake. Wealso reexamined associations between calorie labeling andcalories purchased after excluding McDonald’s customerswho did not report seeing calorie labeling after implementation. Lastly, we conducted exploratory subgroup analyses in which we repeated our primary analysis withinstrata of participant sex (male/female), weight status(obesity/no obesity), and race/ethnicity (Black/Hispanic/White); we could not explore these in purchases made forchildren due to low sample size.All statistical analyses were conducted in SAS version9.4 (Cary, NC). We calculated 2-sided 95% CIs for allstatistical tests.ResultsThe study population after exclusions (Table 1) included2971 adults (31% McDonald’s customers; mean age, 37.6years [SD, 15.9]; 43% female), 2164 adolescents (41%McDonald’s customers; mean age, 16.3 years [2.7]; 48% female), and 447 children (41% McDonald’s customers; mean
dProvidenceSpringfield––––––Kentucky Fried ChickenSubwayWendy’sA lot338 2000- 3000 3000Mean (standard deviation) or %40 1000- ��11272437752029403961–28.1 (6.0)38.1 (15.2)15251743–20223424941929404060–27.9 (6.2)36.9 321749510.52 (0.92)23.1 (4.5)15.8 1745550.54 (1.09)23.5 (5.0)15.7 (2.7)Post(n 8520.49 (1.03)23.6 (4.8)16.6 (2.7)Pre(n 752)Other 1490.59 (0.98)24.2 (5.3)16.7 (2.5)Post(n 917328371550500.76 (1.91)20.0 (6.0)7.8 (3.0)Pre(n 9194415329361749511.11 (1.67)22.1 (7.0)8.5 (3.1)Post(n 59)Other 1491.24 (1.54)22.2 (6.9)8.4 (3.3)Pre(n 81.27 (1.69)22.3 (7.6)8.2 (3.1)Post(n 85)(2019) 16:99a20 1000262724A littleEstimation of daily calorie needs (%)264926Not at allImportance of calories in selecting meals (%)47––Burger KingDunkin’ nt (%)28BostonCity (%)34WhiteRace/ethnicity (%)52Male52––BMI-for-age-and-sex z scoreSex (%)27.6 (5.8)28.0 (6.1)BMI, kg/m238.3 (15.7)37.9 (16.7)Age, yearsPre(n 546)Pre(n 579)Post(n 755)Pre(n 1294)McDonald’sPost(n 343)AdolescentsMcDonald’sOther chainAdultsTable 1 Characteristicsa of Participating Adults, Adolescents, and Children by Restaurant Chain and Timing of PurchasePetimar et al. International Journal of Behavioral Nutrition and Physical ActivityPage 4 of 11
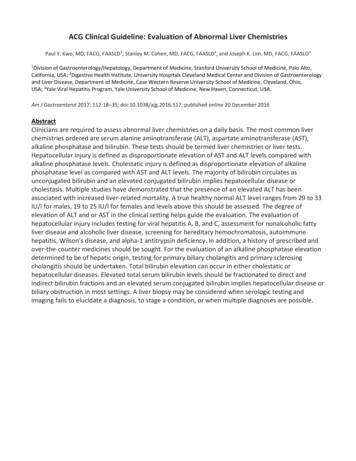
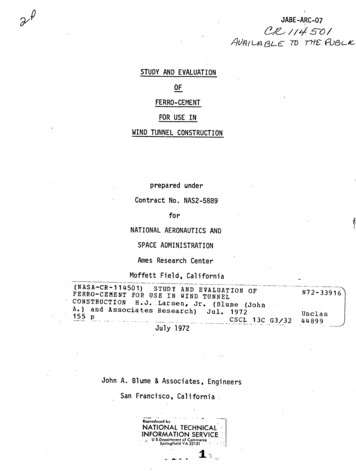
Petimar et al. International Journal of Behavioral Nutrition and Physical Activityage, 8.2 years [3.1]; 51% female). Most participants werenon-White (60 to 84%) across all samples. Among adults,compared to control chains, McDonald’s customers weremore likely to be female and Black; school-age children atMcDonald’s were also more likely to be Black. Among adolescents, a higher proportion of McDonald’s customerswere in Boston compared to the control restaurants due tothe additional sample during the school year. The meancalories purchased was 807 (range: 0–4000) for adults, 746(range: 0–2980) for adolescents, and 694 (range: 90–2170)for children. About half of participants across age groupsresponded that calories influenced their meal selection tosome degree, and most answered that that recommendeddaily calorie intake was between 1000 and 3000 cal.In multivariable-adjusted models, the calorie content ofmeals declined by 80 cal in McDonald’s (95% CI: 155, 4)and by 60 cal in control restaurants (95% CI: 116, 5) inthe post- compared to the pre-intervention period amongadults. In difference-in-differences models comparingMcDonald’s to control restaurants before vs. after labeling,there was no change in calories purchased associated withcalorie labeling (βinteraction 19 cal, 95% CI: 112, 75)(Table 2). We similarly observed decreases in calories purchased among children in both McDonald’s and control restaurants, but again no change in calories purchasedassociated with labeling (βinteraction 13 cal, 95% CI: 108,135). In adolescents, we observed neither a decline in calories purchased over time nor a change associated withlabeling; the βinteraction was the largest for this group though( 49, 95% CI -136, 38). Results were similar when adjustingfor additional covariates in sensitivity analyses(Additional file 1: Table S1) and when restricting the analysis to McDonald’s customers who reported seeing calorieinformation on menus (Additional file 1: Table S2).We did not observe any changes in predicted probability of underestimating calories purchased in eitherMcDonald’s (predicted change 1, 95% CI: 6, 8) orcontrol restaurants (predicted change 1, 95% CI: 5,4) in the post- compared to the pre-intervention periodamong adults, and, in differences-in-differences models,there was no association of calorie labeling on ability toaccurately estimate calories purchased (βinteraction 1,95% CI: -7, 9). Difference-in-differences were similarlynull among adolescent purchases and purchases madefor children (Table 3). Results with continuous underestimation of calories were consistent with those usingthe binary measure (Additional file 1: Table S3). Inadults, as expected, calorie labeling was associated with asubstantial increase in predicted probability of noticingcalorie information on McDonald’s menus compared tocontrol restaurant menus (βinteraction 28, 95% CI: 21,36). These results were similar among adolescents, butwere weaker among parents/guardians of children (βinter95% CI: 7, 31). Results for bothaction 13,(2019) 16:99Page 5 of 11underestimation of calories and noticing of calorie information on menus were similar when adjusting for additional covariates, though we could not run theseanalyses in children due to small sample sizes (Additional file 1: Table S4). We found that 28% of adults,15% of adolescents, and 24% of parents/guardians ofchildren who noticed labels said that they used the labelto decide what to purchase. Among all participants inMcDonald’s in the post-labeling period, 13% of adults,6% of adolescents, and 8% of children noticed and usedthe labels.When repeating our primary analysis stratified by participant characteristics (Table 4), we observed fewer caloriespurchased by adolescents with obesity in McDonald’s compared to control restaurants (βinteraction 246 cal, 95% CI:-500, 9). Calorie labeling was also associated with reducedcalories purchased by Black (βinteraction 128 cal, 95% CI: 237, 19) and White adolescents (βinteraction 141 cal,95% CI: 291, 10), but not among Hispanics or in eithersex. We did not observe associations of calorie labeling bythese characteristics in adults.DiscussionIn this natural experiment of adults, adolescents, andchildren, we found that McDonald’s voluntary calorie labeling was not associated with large overall changes incalorie content of meals purchased compared to unlabeled fast-food restaurant meals. Exploratory analysesrevealed that calorie labeling was associated with fewercalories purchased among adolescents with obesity aswell as Black and White adolescents. Although therewere no associations of calorie labeling in our primaryanalyses, adult purchases and purchases made for children in both intervention and control groups had fewercalories over time. Moreover, although there was a substantially higher predicted probability of noticing calorieinformation in McDonald’s after labeling compared tocontrol restaurants among adults and adolescents, calorie labeling was not associated with improvements inestimation of calories purchased.Our main results are consistent with most previousstudies conducted in fast-food restaurants using a natural experiment design [12–17, 20], which have generallyfound that calorie labeling is associated with noticingcalorie information but not with calories purchased.Many of these studies sampled participants from thesame chains as in the present study, using data collectedin cities that had implemented calorie labeling (i.e. NewYork City, Philadelphia, and Seattle) compared to control cities that had not. Only two of these studies investigated this association in children and adolescentsspecifically, and both did not observe any differences incalories purchased after labeling [14, 17]. Although thissuggests limited ability of calorie labeling to reduce
c,d719 (369)759 (488)718 (474)585 (280)709 (408)630 (425)PostaChange (adjusted) 80 ( 155, 4) 40 ( 106, 26) 158 ( 231, 86)Change (crude) 89 ( 168, 10) 51 ( 123, 21) 134 ( 214, 53)b766 (345)756 (427)888 (455)PreaOther Chains585 (345)739 (459)816 (468)Posta 180 ( 291, 69) 17 ( 82, 48) 72 ( 127, 16)Change (crude) 159 ( 257, 61)1 ( 48, 50) 60 ( 116, 5)Change (adjusted)b13 ( 108, 135) 49 ( 136, 38) 19 ( 112, 75)Difference-indifferences(adjusted)bbMean (SD) presentedAdjusted for age (years, continuous), sex (female [ref], male), race/ethnicity (white [ref], black, Asian, Hispanic, other), BMI (kg/m2, continuous), city (Boston [ref], Hartford, Providence, Springfield), and restaurant chain(Burger King [ref], KFC, Subway, Wendy’s). Restaurant location was included as a random effectcControl restaurants included Burger King (ref), Wendy’s, Subway, and Dunkin’ DonutsdAdjusted for BMI-for-age-and-sex-z score (continuous) instead of e 2 Multivariable-Adjusted Changes (95% CI) in Calories Purchased by Adults, Adolescents, and Children After Calorie Labeling in McDonald’s Restaurants Compared toOther Fast-Food RestaurantsPetimar et al. International Journal of Behavioral Nutrition and Physical Activity(2019) 16:99Page 6 of 11
b,cb,c67%71%64% 5% ( 12, 1%)1% ( 16, 17%) 6% ( 12, 0%) 1% ( 17, 14%)14%11%15%PreMcDonald’s36%38%45%Post21% (7, 35%)27% (21, 32%)30% (24, 36%)Change (crude)22% (7, 37%)26% (20, 32%)30% (24, 37%)Change (adjusted)a1% ( 6, 8%)Change (adjusted)a1% ( 6, 8%)Change (crude)Noticed Calorie 5%19%26%PostOther Chains70%76%69%PreOther Chains7% ( 3, 18%)1% ( 4, 5%)2% ( 2, 6%)Change (crude)0% ( 14, 13%) 5% ( 10, 1%)0% ( 5, 4%)Change (crude)9% ( 2, 21%)1% ( 3, 5%)2% ( 2, 6%)Change (adjusted)a 2% ( 17, 12%) 5% ( 10, 1%) 1% ( 5, 4%)Change (adjusted)a13% ( 7, 31%)25% (18, 32%)28% (21, 36%)Difference-in-differencesa3% ( 18, 24%) 1% ( 9, 8%)1% ( 7, 9%)Difference-in-differencesaaChanges in the predicted probability of the outcome of interest are adjusted for age (years, continuous), sex (female [ref], male), race/ethnicity (white [ref], black, Asian, Hispanic, other), BMI (kg/m2, continuous), city(Boston [ref], Hartford, Providence, Springfield), and restaurant chain (Burger King [ref], KFC, Subway, Wendy’s). Restaurant location was included as a random effectbControl restaurants included Burger King (ref), Wendy’s, Subway, and Dunkin’ DonutscAdjusted for BMI-for-age-and-sex z score (continuous) instead of dultsPreMcDonald’sUnderestimated Calories PurchasedTable 3 Multivariable-Adjusted Changes (95% CI) in Calorie Underestimation and Noticing of Menu Calorie Information by Adults, Adolescents, and Children After CalorieLabeling in McDonald’s Restaurants Compared to Other Fast-Food RestaurantsPetimar et al. International Journal of Behavioral Nutrition and Physical Activity(2019) 16:99Page 7 of 11
Petimar et al. International Journal of Behavioral Nutrition and Physical Activity(2019) 16:99Page 8 of 11Table 4 Multivariable-Adjusted Difference-in-Differences (95% CI) for Calories Purchased in Adults and Adolescents by differencesMale1707 19 ( 122, 85)1121 81 ( 203, 41)Female1264 12 ( 130, 106)1043 12 ( 115, 92)Obesity889 112 ( 282, 56)284 246 ( 500, 9)No obesity208619 ( 67, 105)1880 30 ( 112, 52)Black906 33 ( 151, 84)747 128 ( 237, 19)Hispanic566 63 ( 330, 203)57741 ( 131, 214)White1143 38 ( 177, 100)427 141 ( 291, 10)SexObesity StatuscRace/ethnicityaAdjusted for age (years, continuous), sex (female [ref], male), race/ethnicity (white [ref], black, Asian, Hispanic, other), BMI (kg/m2, continuous), city (Boston [ref],Hartford, Providence, Springfield), and restaurant chain (Burger King [ref], KFC, Subway, Wendy’s). Restaurant location was included as a random effectbAdjusted for same variables as in adults, except BMI-for-sex-and-age z score (continuous) was used instead of BMI, and control restaurants included Burger King(ref), Wendy’s, Subway, and Dunkin’ DonutscObesity defined as BMI 30 in adults and BMI-for-age-and-sex z score 1.645 in adolescentscalories purchased in fast-food settings, one exception isa study conducted by Bollinger et al., which found a significant 15-cal decrease in Starbucks purchases in NewYork City after labeling (compared to Starbucks locations in Boston and Philadelphia where labeling was notyet implemented) [7]. This study used 100 million restaurant transactions, allowing them to detect very smalldifferences in calories purchased. No other study to date,including the present study, has been large enough todetect such small differences in calories purchased.However, microsimulation studies have shown that evensmall reductions (e.g. 8–11 cal/day) could prevent hundreds of thousands of cases of obesity and cardiometabolic disease [25, 26]. Thus, the lack of an association inthe present study and in past small studies can be usedonly as evidence against a moderate or large effect oflabeling on calories purchased. They should not be usedto rule out a small but meaningful effect of labelingbecause these studies have generally not been powered todetect such effects. The statistically non-significant reduction of 49 cal among adolescents dining at McDonald’scompared to other chains, pre vs. post, provides furtherevidence that a small reduction cannot be ruled out in thisstudy.Although our study included a greater number of childand adolescent participants than previous studies [14, 17],we could not completely separate potential parent andguardian influence over choices. Our sampling of adolescents in the early afternoon in restaurants within one mileof a high school may have increased our chances of enrolling adolescents unaccompanied by adults. However, wedid not exclude adolescents who were accompanied by anadult. This is also true for children in our sample, whowere all accompanied by an adult. In a study of parentchild dyads by Tandon et al., most parents ( 70%) reported that the child alone selected the child’s meal [17],whereas Elbel et al. reported that only 31% of children decided on their own what they ate [14]. Purchases made forchildren in our study, therefore, likely represent somecombination of child and adult preferences. However,Elbel et al. also reported no association between parentalinvolvement and fast-food calorie consumption; it is unclear whether pare
McDonald’s and five control chains that did not label menus over the study period in four New England cities. In 2018, we analyzed the data by using difference-in-differences analyses to estimate associations of calorie labeling with calories purchased (actual and estimated) and predic