Transcription
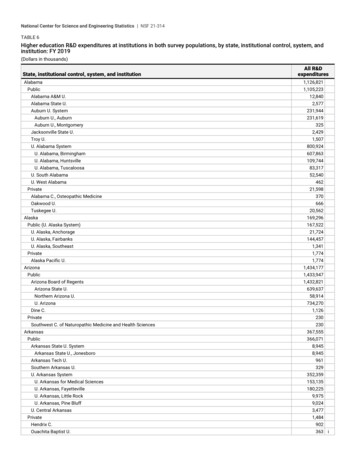
STUDENT AND YINDICATORSTSA BenchmarksFinancial and Performance Measures for School DistrictsTexas School Alliance districts are diverse. They vary in location, geographic size, population size,property wealth, the economic status of their students, etc. Alliance school districts are alsochanging. With increased competition from charter schools and rapid enrollment growth in fastgrowth school districts (and moderate growth in mostother types of districts), the student populations aregrowing and shifting. Because of the diversity andchanging nature of school districts, it is hard todescribe them or their activity accurately. ThisBenchmarks publication is designed to help yourschool district understand how its finances andperformance compare to other school districts withinTSA. We hope that it will help you answer questionslike: how does my school district compare to otherschool districts of its size in the percentage of state aidit receives? Do other schools with the same wealth perWADA produce similar numbers of post-secondaryready students?Do school districts in TSA payteachers more on average than our district?Report Sections and Data SourcesThis publication provides four different sections of reports organized by data type : Student andTeacher Populations, Revenue Data, Expenditure Data, and Accountability Indicators. The firstthree sections rely on data from the 2015-16 actual financial data submitted for the PublicEducation Information Management System (PEIMS), as provided by the Texas Education Agency(TEA) as well as the property tax records from the State Comptroller’s Office. The data for thefourth section concerning Accountability Indicators comes from the 2015-16 Texas AcademicPerformance Reports (TAPR).
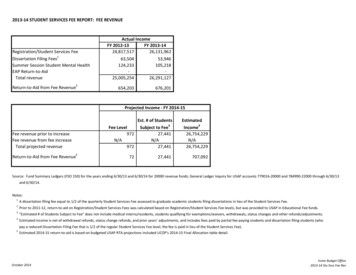
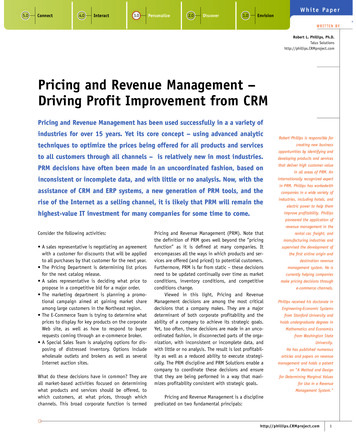
Snapshot ReportsEach section contains several “snapshot reports” that describethe trends that data suggests about particular data measureslike student enrollment, tax rates or test scores. The snapshotsmake use of both TSA-wide data and data disaggregated into“analyze categories” according to district type, enrollment size,wealth per WADA,and a district’s concentration ofeconomically disadvantaged student populations (fordescriptions, see the side panel to the right, and to find outwhich schools fall in which categories, see pages 3 and 4). Thecontent of each report is mapped in the figure below. Eachsnapshot report is made up of several data elements: datatype, summary description, district comparisons,highlight statistics and the TSA average. The data typenames the statistic that the report describes and indicates fromwhat year the data was collected. The summary provides aquick analysis of the data included in the report. The districtcomparisons show the districts that are at the upper andlower bounds of the TSA average. The highlight statisticsprovides notable information about certain interesting districtsor groups of districts. The TSA average provides the TSAaverage of the report’s featured statistic.SummaryHighlightStatisticsFigure 1.SnapshotReportLayoutTSAAverageWealth perWADAThere are 11 Wealth perWADA categories, whichgroup districts accordingto the average districtproperty wealth perstudent in average dailyattendancePercent ofEconomicallyDisadvantagedStudents5 categories organizedistricts according to thepercent of economicallydisadvantaged studentspresent in the district.Data Lowest TSADistrict Value
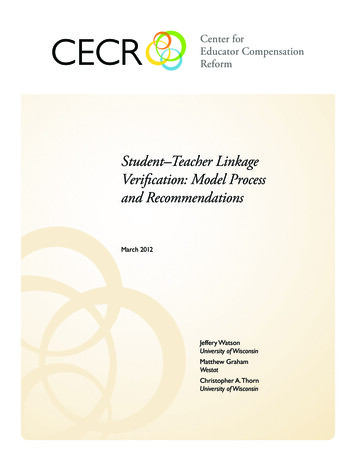
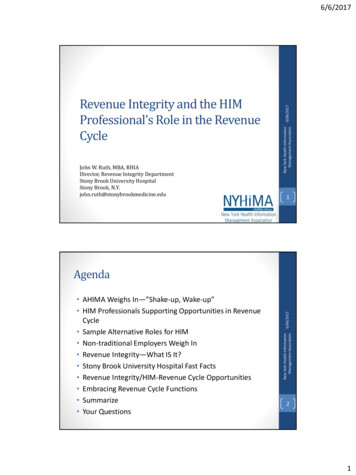
Enrollment Type50,000 25,000-49,99910,000-24,999ALDINE ISDALIEF ISDABILENE ISDARLINGTON ISDAMARILLO ISDHARLINGEN CISDAUSTIN ISDCORPUS CHRSTI ISDCYPRESS-FAIRBANKS ISDRICHARDSON ISDHURSTEULESSBEDFORD ISDMCALLEN ISDDALLAS ISDECTOR COUNTY ISDMIDLAND ISDEL PASO ISDHUMBLE ISDSAN ANGELO ISDFORT BEND ISDKILLEEN ISDTYLER ISDFORT WORTH ISDIRVING ISDWACO ISDGARLAND ISDLUBBOCK ISDHOUSTON ISDMESQUITE ISDKATY ISDPHARR-SAN JUAN-ALAMO ISDNORTH EAST ISDRICHARDSON ISDNORTHSIDE ISDSOCORRO ISDSAN ANTONIO ISDSPRING BRANCH ISDUNITED ISDSOURCE: 2015-16 PEIMS Actual and Budget Financial DataAnalyzeCategoriescontinued EnrollmentType8 categories organizedistricts according to thenumber of students inthe district.District Type8 categories organizedistricts according towhere they are located—in urban, suburban orrural areas.
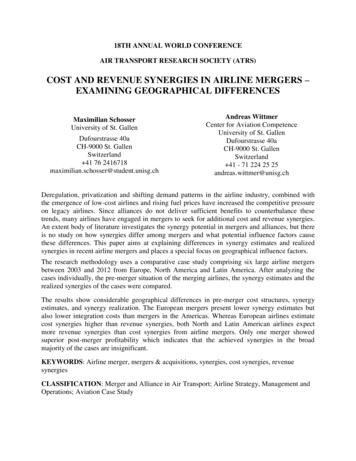
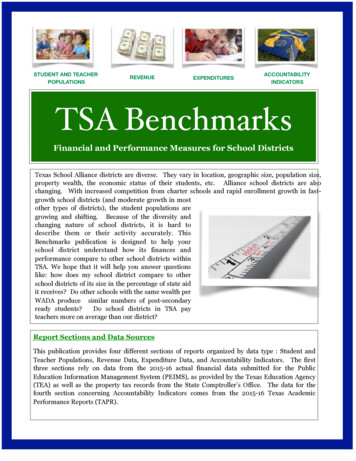
District TypeMajor UrbanMajorSuburbanOther Central O t h e r C e n t r a lCityCity SuburbanARLINGTON ISDALDINE ISDABILENE ISDAUSTIN ISDALIEF ISDAMARILLO ISDDALLAS ISDCYPRESS-FAIRBANKS ISDCORPUS CHRISTIISDEL PASO ISDFORT BEND ISDECTOR COUNTYISDFORT WORTH ISDGARLAND ISDKILLEEN ISDHOUSTON ISDHUMBLE ISDLUBBOCK ISDNORTH EAST ISDHURST-EULESSBEDFORD ISDDMCALLEN ISDNORTHSIDE ISDKATY ISDMIDLAND ISDSAN ANTONIO ISDMESQUITE ISDPHARR-SANJUAN-ALAMO ISDSOCORRO ISDRICHARDSON ISDSAN ANGELO ISDROUND ROCK ISDTYLER ISDSPRING BRANCH ISDUNITED ISDUNITED ISDWACO ISDSOURCE: 2015-16 PEIMS Actual and Budget Financial DataHARLINGEN CISD
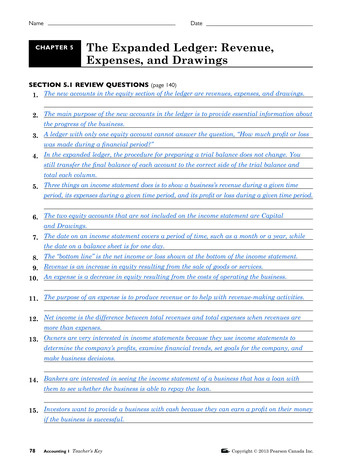
Wealth Per WADA 117,056 117,057 152,953PHARR-SAN JUAN-ALAMOHARLINGENISDCISDKILLEENCISD 152,954- 188,432 188,433- 217,214 217,215- 248,625NONEABILENE ISDALIEF ISDALDINE ISDIRVING ISDMESQUITEISDAMARILLO ISDSAN ANTONIO ISDSOCORROISDEL PASO ISDGARLAND ISD 248,626- 286,411 286,412- 346,099 346,100- 426,156 427,157- 605,533 605,534 and GreaterF O R TWORTH ISDARLINGTONISDC Y P R E S S FAIRBANKS ISDDALLAS ISDAUSTIN ISDHUMBLE ISDCORPUSCHRISTI ISDFORT BEND ISDNORTH EASTISDHOUSTON ISDLUBBOCKISDE C T O RCOUNTY ISDH U R S T- E U L E S S BEDFORD ISDROUND ROCKISDMIDLAND ISDMCALLENISDKATY ISDSAN ANGELOISDNORTHSIDE ISDUNITED ISDRICHARDSON ISDWACO ISDTYLER ISDSOURCE: 2015-16 PEIMS Actual and Budget Financial DataS P R I N GBRANCH ISD
Percent of Economically Disadvantaged StudentsUnder 10%10%-30%30%-50%NONEKATY ISDC Y P R E S S - FA I R B A N K SISDECTOR COUNTY ISDROUND ROCK ISDFORT BEND ISDHUMBLE ISDNORTH EAST ISDMIDLAND ISD50%-70%70%-90%more than 90%ABILENE ISDALDINE ISDSAN ANTONIO ISDAMARILLO ISDALIEF ISDARLINGTON ISDDALLAS ISDAUSTIN ISDFORT WORTH ISDCORPUS CHRISTI ISDHARLINGEN CISDEL PASO ISDHOUSTON ISDHURST-EULESS-BEDFORDISDGARLAND ISDIRVING ISDKILLEEN ISDMESQUITE ISDLUBBOCK ISDPHARR-SAN JUAN-ALAMO ISDNORTHSIDE ISDSOCORRO ISDRICHARDSON ISDTYLER ISDSAN ANGELO ISDUNITED ISDSPRING BRANCH ISDWACO ISDMCALLEN ISDAt the end of each section, there are full spreadsheets that displayeach district’s statistics for the section.SOURCE: 2015-16 PEIMS Actual and Budget Financial Data
Table of ContentsSection 1: Student and Staffing DataStudent Enrollmentp. 9Student to Teacher Ratiop. 10Student to Campus Administration Ratiop. 11Student to Central Administration Ratiop.12Central Administration Average Payp. 13Teacher Average Payp. 14Section 2: Revenue DataDebt Service Per Studentp. 16Taxable Value Per Student and Tax Ratesp. 17Percent State and Local Revenuep. 18Section 3: Expenditure DataInstruction Expenditures per Studentp. 20.Leadership Expenditures per Studentp. 21Payrollp. 22Basic Educational Expendituresp. 23Section IV: Accountability IndicatorsSTAAR Post-Secondary ReadinessCollege and Career Readinessp.25p . 26AppendixData Definitionsp. 28Benchmark Datap. 36
Student and Staffing DataStudent Enrollmentp. 9Student to Teacher Ratiop. 10Student to Campus Administration Ratiop. 11Student to Central Administration Ratiop. 12Central Administration Average Payp. 13Teacher Average Payp. 14!
TSA EnrollmentActual 2015-161414 TSA school districtshave more than50,000 students.53%TSA districts enrolled 2,021,057 students in 2015-16. 46% of TSA studentsattended schools were located in major urban districts, but less than a third ofTSA districts were located in major urban areas. Urban school enrollmentsshrunk from the previous year, while major suburban districts grew. Thedistricts with lower concentrations of economically disadvantaged grewconsiderably compared to those with higher concentrations.HOUSTON ISDTSA AVERAGEWACO ISD215,62754,62314,946SOURCE: 2015-16 PEIMS Actual and Budget Financial Data53% of TSA studentsattend schools with awealth per WADA ofeat least 346,100.42%42% of TSA studentsattend school in adistrict where70%-90% of itsstudentsarecharacterized ase c o no mi c a l l ydisadvantaged.
TSA Student-Teacher RatioBudget 2015-16-2%Harlingen CISD, thelone Central CitySuburban schooldistrict experienced adecrease in theirstudent-teacher ratiosby -2% between2014-15 and 2015-16,the largest decrease ofany school districttype.-1%TSA employed one teacher for every 15.8 students on average. This ratio wasslightly larger than the state’s average of 15.2 students per teacher. However,12 of TSA’s 38 school districts had a student-teacher ratio smaller than thestate average. While these districts tended to be smaller ones, both Dallas ISDand Austin ISD had student-teacher ratios that were smaller than the stateaverage (14.9 and 14.4 respectively).TSA student-toteacher ratiosdecreased from2014-15 to 2015-16 by1% on average. 605,534 HOUSTON ISDTSA AVERAGEALIEF ISD18.5: 115.8: 114.2: 1SOURCE: 2015-16 PEIMS Actual and Budget Financial DataDistricts with thehighest wealth perWADA increased theirstudent teacher ratioby 16.6% between2014-15 and 2015-16—the largest increase ofany wealth category.Interestingly, the 2ndhighest wealthcategory decreasedthis ratio by a similaramount.
TSA Student-Campus Admin. RatioBudget 2015-16-2.75%Suburban schoolsdecreased the ratio ofstudents to campusadministrators from2014-15 to 2015-16 bynearly 3%.-2.58%TSA employed 7,106.7 campus administration FTEs in 2015-16. Somedistricts are increased the number of administrators to students, some keptthe ratio somewhat steady, and others drastically reduced it. Major urbandistricts had the highest ratio of students to campus administrators of anydistrict type, but that ratio decreased by 3.4%. The largest fluctuationsoccurred in the wealthiest school districts—the top wealth category’sproportion of students to teachers has increased by 22%, whereas the secondhighest wealth category’s has decreased by 27% in the last year.HOUSTONISDTSAAVERAGE372.0:1284.4:1SOURCE: 2015-16 PEIMS Actual and Budget Financial DataCYPRESSFAIRBANKSISD205.3:1TSA student-tocampus administratorratios decreased from2014-14 to 2015-16 by2.58% on average.359:1The student-campusadministrator ratio in2015-16 of the secondhighest wealthcategory ( 427,157 to 605,533 per WADA)was 359: 1. This ratiois much larger thanthe top wealthcategory of 257.5:1.
TSA Student-Central Admin. RatioBudget 2015-16-3.08%TSA Districts in theTEA “Other CentralCity Suburbanschools” categoryincreased the ratio ofstudents to centraladministrators from2014-15 to 2015-16 bya little over 3% (allother district typesdecreased)—theseschools employed thefewest centraladministrators of anygroup in 2014-15.TSA districts employed 1,876.17 central administration FTEs in 2015-16—that’s 68.2 teacher FTEs and a whopping 1,078 students for each centraladministrative staff person. By contrast, the state overall averages 49.2teachers and 746.9 students per central administration FTE. Smaller districtsin TSA increased this ratio some (2.26% in districts of 10,000 to 24,999students). District wealth did not seem to be connected to whether this ratioincreased or decreased from 2014-15 to 2015-16.NORTHSIDEISD3,003.1: 1TSAAVERAGE1,078: 1SOURCE: 2015-16 PEIMS Actual and Budget Financial DataCYPRESSFAIRBANKSISD493.7: 1121.39The 217,215 248,625 wealth perWADA categorydecreased the numberofcentraladministration FTEsby 121.39 FTEs—thelargest one-year drop(43.79%) of any wealthcategory in 2015-16.62Central City schoolsemploy only 62 fewercentral admin FTEsthan major urbanschools, who havemore than half of amillion more students.
TSA Central Administration PayBudget 2015-1617.4%Districts in the highestwealth per WADAcategory increasedthese administrators’base pay the most ofany wealth per WADAcategory. 107,651TSA centraladministrators inurban districts earnthe most money at 107, 651; by contrastcentral city centraladministrators earn 92, 334 on average.The 1,875 central administrators employed in TSA school districts earnedabout 104,152 each in 2015-16. All of the money which TSA spent on thebase pay of central administrators equals about 1% of the funds from the stategeneral fund and local funds.District wealth did seem to have someconnection to the average central administrator’s base pay. The poorest 121,231school districts pay on average about 16,000 less than the TSA average,wealthier schools come much closer to the average (or exceed it).The second-largestSPRINGBRANCHISD 139,640TSAAVERAGE 104,152SOURCE: 2015-16 PEIMS Actual and Budget Financial DataPHARR-SANJUAN ALAMOISD 85,229wealth per WADAcategory pays thecentral administratorsthe most money onaverage (22% morethan the TSA average).By contrast, thewealthiest schooldistricts in TSA payonly 1% higher thanthe TSA average.
TSA Teacher Base PayBudget 2015-1612.5%The highest wealth perWADA category sawteacher base payincrease by 12.5% from2014-2015 to 2015-16—in 2014-15 they werethe only wealthcategory to payteachers less than 50,000 on average. 4,445.26Despite having 12,440 fewer students enrolled in TSA schools, TSA employed127,960 teacher FTEs in 2015-16—an increase of over 500 teachers from2014-15 (in 2014-15 there were 127,441 teacher FTEs). On average, theseteachers earned 54,022, higher than both the TSA average of 52,744 in2014-15 and the state average of 52,119 in 2015-16. Teachers in the districtswith enrollments greater than 50,000 students earned more than 4,000more on average than teachers in districts with 10,000-24,999 students.HURSTEULESSBEDFORDISDTSAAVERAGESAN ANGELOISD 58,542 54,022 45,669SOURCE: 2015-16 PEIMS Actual and Budget Financial DataThe 346,100 to 427,156 wealthcategory paid theirteachers on average 4,445.26 more thanthe lowest wealthcategory. This was thelargest spread in paybetween wealthcategories in 2015-16.5Five out of the top tenhighest payingdistricts in TSA arelocated in HarrisCounty.
Revenue DataDebt Service Per Studentp. 16Taxable Value Per Student and Tax Ratesp. 17Local Revenuep. 18!
TSA Debt Service Per StudentBudget 2015-16 2.5BTSA owed nearly 2.5billion in debt servicein 2015-16. 1,331On average, wealthy districts, those with large enrollments or those in urbanareas had higher amounts of debt service per student in 2015-16. The amountof debt service decreased from 2014-15; however, districts of varying levels ofwealth experienced very different changes in the amount of debt service perstudent they had from the year before. Districts with 217,215- 248,625wealth per WADA increased their debt service per student by over 50%,whereas the 188,433- 217,214 category decreased.SPRINGBRANCH ISDTSAAVERAGEKILLEEN ISD 355 2,344 1,216AMARILLOISD 277SOURCE: 2015-16 PEIMS Actual and Budget Financial DataMajor Suburbandistricts had anaverage of 1,331 ofdebt service perstudent. 231MCollectively, TSA owed 231 million more indebt service in 2015-16than in 2014-15,despite having 12,440fewer students.
TSA Taxable Value PerStudent and Tax RatesBudget 2015-16 1.17 v. 1.05The average M&O taxrate for the lowestwealth category is 1.17; 1.05 is theaverage for the topwealth category.4TSA districts varied widely in the amount of taxable value per student, andnot surprisingly, their tax rates were equally diverse in 2015-16. The topquarter of TSA districts ranked by property wealth per WADA had at least 450,000 of taxable value per student, the middle 50% had between 250,000 and 450,000 of taxable value per student and the bottom quarterhad less than 250,000 of taxable value per student.AUSTIN ISD 1,032,217TSAAVERAGEHUMBLE ISD 434,605 1.52 1.29SOURCE: 2015-16 PEIMS Actual and Budget Financial DataPHARR-SANJUAN ALAMOISD 119,848KILLEEN ISD 1.12Four school districtshad M&O tax rates at 1.17—Harlingen,Humble, Pharr-SanJuan-Alamo and WacoISD. Only 2 districtstaxed below 1.04—Houston ISD andSocorro ISD . 286,412 346,099TSA districts in the 286,412- 346,099wealth category hadthe highest overall taxrate on average— 1.40.
TSA Local RevenueBudget 2015-1618Eighteen TSA districtsreceived over 50% oftheir revenue fromlocal taxes. Nineteenschool districtsreceived under 50% oftheir revenue fromlocal taxes.91.88%TSA districts differed greatly in how much they planned to rely on local taxrevenue to run their schools. Not surprisingly, wealthier districts and urbandistricts planned to rely on local revenue, more than those that were lesswealthy or were located outside of the major urban core. The school districtswith closer to the “average” enrollment for TSA relied on local revenues theleast—those with higher or smaller enrollments tended to have greater localshares.MIDLAND ISD 97.1%AVERAGEPHARR-SANJUAN ALAMOISD558.2%17.7%TSASOURCE: 2015-16 PEIMS Actual and Budget Financial DataThe highest wealthcategory ( 605,534 per WADA) received91.88% of its fundsfrom local sources—with an average M&Otax rate of 1.07.17.72%The lowest wealthcategory (less than 117,056 per WADA)planned to fund itsschools with 17.72% ofits funds coming from
Expenditure DataInstruction Expenditures per Studentp. 20Leadership Expenditures per Studentp, 21Payrollp. 22Basic Educational Expendituresp. 23!
TSA Instruction Per StudentActual 2015-20163.8%TSA spent 3.8% moreon instruction than itdid in 2014-15.10%Districts with 217-215- 248,625wealth per WADAspent 10% more thanthe TSA average oninstruction perstudent.TSA districts spent 11.6 billion on instruction in 2015-16, which made upabout 62% of basic educational expenditures.Instruction per studentexpenditures went up on average, regardless of a district’s wealth per WADAor concentration of economically disadvantaged students from 2014-15 to2015-16. Those with higher concentrations of economically disadvantagedstudents spent more than those with smaller concentrations, and urbanschools on the whole spent slightly less than districts in other geographicareas. 1,744 per student separated the district that spent the most on D i s t r i c t s w i t h t h ehighest concentrationsinstruction per student and the one that spent the least. 876ALIEF ISDTSA AVERAGE 6,609 5,745SOURCE: 2015-16 PEIMS Actual and Budget Financial DataSAN ANGELOISD 4,8651of economicallydisadvantagedstudents (90% ) spentabout 876 more oninstruction per studentthan districts thatspent the least oninstruction perstudent. (This grouphad only 30%-50% ofitsstudentscharacterized ase c o no mi c a l l ydisadvantaged).
TSA Leadership ExpendituresPer StudentActual 2015-20167.42%Schools in the lowestwealth per WADAcategory spent 7.42%more on centralleadership costs thanthey did in 2014-15. 102TSA spent 408 million on central leadership expenditures in 2015-16. Thissum equals only 3.5% of what TSA districts spent on instruction; however,districts spent 4% more on these expenses in 2015-16 than they did in2015-15. Districts with higher concentrations of economically disadvantagedstudents spent more, as did schools outside of the urban core. Those schoolswith the largest enrollments spent less per student on average. In addition,there does not appear to be a direct correlation between a district’s level ofwealth and the amount of money it spends on central leadership.DALLAS ISDTSA AVERAGENORTHSIDEISD 331 202 120SOURCE: 2015-16 PEIMS Actual and Budget Financial Data1The wealth group thatspent the most perstudent on centralleadership per studentspent 102 on averagemore than the wealthcategory that spent theleast on average.2Two of Dallas County’sschool districts areamong the ten districtsthat spend the most oncentral leadership perstudent.
TSA Payroll Per StudentActual 2015-20164%TSA spent more onpayroll per student onaverage in 2015-16than it did in 2014-15.1TSA public schools spent 15.1 billion on payroll in 2015-16—up from 14.5billion in 2014-15. Districts with larger concentrations of economicallydisadvantaged students tended to spend more on payroll than districts oflower concentrations of these students
MCALLEN ISD NORTHSIDE ISD KATY ISD MIDLAND ISD SAN ANTONIO ISD MESQUITE ISD PHARR-SAN JUAN-ALAMO ISD SOCORRO ISD RICHARDSON ISD SAN ANGELO ISD . Payroll p. 22 Basic Educational Expenditures p. 23 Section IV: Accountability Indicators STAAR Post-Sec