Transcription
Analysis of Skills Demand in IndonesiaMarch 2015Leader with Associate (LWA) Cooperative Agreement No. EEM-A-00-06-00001-00
Analysis of Skills Demand in IndonesiaThis publication was prepared by John Lindsay, Lara Goldmark, Alec Hansen, Caroline Fawcett, andEleanor Wang through FHI 360’s Workforce Connections project. This work is in response to a requestfrom USAID/Indonesia to support the Mission to better understand the drivers of skills needs inIndonesia. This publication is not a complete labor market analysis, but is intended to be a roadmaphighlighting trends for future in-depth study. It is the result of a literature review, web research, andconversations with key actors and would not be possible without input and contributions from USAIDand donors, implementers, Government of Indonesia officials, and the many stakeholders who tooktheir time to share their experiences and materials with the team. This work was supported by the FHI360 Workforce Connections team and by Jona Lai of USAID/Indonesia. We thank them for theirguidance, planning, and inputs throughout the process.This publication was made possible with the generous support of the American People through theUnited States Agency for International Development (USAID). The contents of which are theresponsibility of the authors and do not necessarily reflect the views of FHI 360, USAID or the UnitedStates Government. Updated as of February 2016.Workforce Connections@wf connectionsLara Goldmark Project Director FHI 360lgoldmark@fhi360.org 1.202.884.8392Obed Diener Technical Advisor FHI 360odiener@fhi360.org 1.202.464.3913John Lindsay Technical Advisor FHI 360jlindsay@fhi360.org 1.202.464.3960Eleanor Sohnen Technical Advisor FHI 360esohnen@fhi360.org 1.202.884.8521www.wfconnections.orgWorkforce Connections is funded by the USAIDOffice of Education and managed by FHI 360, inpartnership with Child Trends, Making CentsInternational, and RTI International.Aaron Miles AOR USAIDamiles@usaid.gov 1.202.712.0016Analysis of Skills Demand in Indonesia FHI 360 Page 2
Table of ContentsI. Introduction to the Assessment4This Assessment4Labor Market patterns4Framework for Understanding Skill Demand in Indonesia5The Indonesian Labor Market System7II. Background – Indonesia9Overall Economic Trends in Indonesia9Education and Skills11Pre- and Post-Employment Training14III. Priority Sectors for Investment15Key Sectors in West Java and South Sulawesi16West Java17South Sulawesi18IV. Understanding Demand Means Understanding the Value ChainsIndicative Skill Needs1922V. Typologies (or patterns) of Economic Activity in Indonesia23VI. Conclusion and Recommendations27Conclusion27Recommendations28VII. Annexes32VIII. Bibliography38Analysis of Skills Demand in Indonesia FHI 360 Page 3
I. Introduction to the AssessmentThis AssessmentTo effectively design and deliver Workforce Developmentprograms requires an understanding of the trends in skilldemand, skill supply, and the economic and policy driversimpacting those trends. It is especially important tounderstand private sector skill demand, otherwiseeducational, service, and policy interventions are likely tofall short of their target. It is the concern that skills needs forprivate sector employment in Indonesia are not fullyunderstood, which led to the request for this assessment.This assessment takes a systems-based approach tounderstanding how economic activity in Indonesia drives thedemand for skilled labor. It takes the reader through theissues associated with identifying skill needs to provide anunderstanding of how to assess these needs in acomprehensive manner that includes both desk and fieldresearch. It then examines specific Indonesian markets, ondifferent levels (province, district, sector, value chain), toprovide examples of the different types of analyses that caninform effective and targeted program design.Labor Market PatternsHow can education and traininginstitutions in Indonesia betterprepare the poor and vulnerable foremployment?The purpose of this desk assessmentis to assist USAID/Indonesia inaddressing this question by utilizing ademand led approach with specificexamples to better understand thedrivers of skill needs in Indonesia.The assessment uses systems, skills,and value chain frameworks toidentify a set of economic patternsthat workforce developmentactivities can be structured around tosupport employment growth that isinclusive of poor and vulnerablepopulations. This is not a completelabor market analysis, but is intendedto be a roadmap highlighting trendsfor future in-depth research.Taking a systems approach is necessary for understandinglabor markets, including those in Indonesia, as labor marketsThe Workforce Connections projectare not driven by any single actor or skill need but arepromotes evidence based learningcomprised of interconnected institutions embedded inand peer-to-peer knowledgepatterns of economic activity. In Indonesia these patternsexchange in international workforcerepeat themselves across geographical areas. In response todevelopment. Funded by the USAIDthese patterns the assessment analyzed economic data fromOffice of Education and managed byaround the country and ascertained that there is a set ofFHI 360, Workforce Connectionsfour economic patterns (more or less) occurring repeatedlybrings together thinking acrossin each province. The assessment then focuses on privaterelevant disciplines to develop asector skill demand within those patterns, with the goal oftechnically sound and accessible bodyidentifying the skills requirements that are embedded in theof knowledge, and build the capacityproducts and services produced by high-growth valueof practitioners.chains. Using this framework and working backwards thenhighlights the appropriate role for Indonesian educationalinstitutions/service providers and district1 or other government actors.1Throughout this assessment the term ‘district’ refers to the Kabupaten/Kota administrative level in Indonesia.Analysis of Skills Demand in Indonesia FHI 360 Page 4
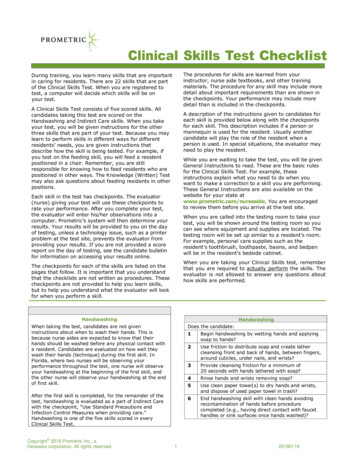
Framework for Understanding Skill Demand in IndonesiaIn many places where there is high unemployment, where educational institutions are not seen to beresponding to private sector demand for skills, or where specific groups are excluded from theworkforce, the term “skills gap” is used to describe the problem. Though this may be the case at times 2,the characterization is unfortunate because it overly simplifies the issues as there are a wide variety offactors influencing employment. . If it was just a ‘skills-gap’ simple training programs should be able tosolve the problem by closing the gap, but his has not worked. This is especially true in Indonesia whichhas a diverse and dynamic economy, labor force, and geography. At any given time there will always bea number of skills needed by industry, and a set of actors who are/should be taking action to addressthese needs. Often the real problem lies in the inability of the two sets of actors to work togethereffectively: employers on the one hand, who are demanding skills; and on the other hand education andother service providers as well as policymakers and civil society groups who must draw on theirstrengths and assets, and use those collectively within the labor market system to maximize thecontribution a region’s workforce can make to its economic development.In order to fully address the disparity between the simplistic way the problem is often viewed, theproblem’s actual intrinsic complexity and dynamic nature, a common language and set of approachesare needed. This assessment provides a framework which can be employed in Indonesia and elsewhereto “translate” industry skill needs into concrete actions for public and private regional actors. In order toensure the framework is not simply theoretical, we have embedded real data on the skills needs in theaftermarket automotive component manufacturing value chain in West Java province into the analysis.The same framework and analytical steps can be used again - in any industry or province in whichUSAID/Indonesia chooses to work.The graphic below, Stages of Skill Acquisition (Figure 1), presents a generalizable version of the firstframework showing in general the role of public versus private providers of education and training inmaking sure the workforce is equipped with the right skills. It shows that skill deliver and funding rolesvary depending on the type of skill that is needed, who the target group is, and how the training is likelyto be funded. In addition it also shows how skills build upon each other, from foundational to workreadiness, and how employers generally engage, or don’t, in the various types of skill development.The methodology behind the Stages of Skill Acquisition framework is further explained below. Later onin this report it is used in the Indonesia aftermarket automotive component value chain example.2“Think about what we would expect to find if there really were a skills shortage. Above all, we should see workerswith the right skills doing well, while only those without those skills are doing badly. We don’t. If employers arereally crying out for certain skills, they should be willing to offer higher wages to attract workers with those skills.In reality, however, it’s very hard to find groups of workers getting big wage increases” Paul Krugman. Jobs andSkills and Zombies. jobs-and-skills-andzombies.html? r 0Analysis of Skills Demand in Indonesia FHI 360 Page 5
Figure 1. Stages of Skill AcquisitionThe first level of the framework shows, Foundational Skills, this is where school-aged children learn basicskills including reading, writing, math, and other skills that relate to their ability to learn. At this level,the private sector expects that education will be publicly funded, but may be engaged in dialogue orother coordinated efforts to ensure labor market relevance. The second level, Work-Readiness Skills, iswhere young people who have completed their schooling and are entering the labor market acquirethose skills that help them get and succeed in a job. These can include skills (commonly referred to as“soft skills”) such as leadership, time management, persuasiveness, and initiative taking. At this level theprivate sector may be willing to support training in community or other organizations, to ensure theirnew hires arrive with these skills. There are some soft skills that may be delivered through the publiceducation system (OECD countries have been building soft skills into basic education curricula for over adecade), and soft skills, just like academic skills, build on each other. The third level, On-the-Job Training,depicts the types of training employers are typically willing to both fund and deliver. In the frameworkskills have been building upon each other, but that does not mean third-level training is only for higherlevel occupations. The on-the-job training an employer is providing could be for line workers, or formanagers, or both. What matters is that employers are willing to invest in those skills. In this mannerthe pyramid can be expanded and customized to contain a set of stacked skills, however the threecategories above are broad and indicative and the content may vary depending on industry sector,region, etc.Later on in the assessment, this framework, Stages of Skill Acquisition, will be combined with a secondframework, a value chain map with a skills overlay (shown in Section 3c), to better understand skillneeds. The value chain map is meant to be immediately understandable (and verifiable) by industryplayers. Using the value chain map, demand for skills is then identified, working backwards from markettrends and end-market demand. In this way channels, or distribution relationships with certain types ofAnalysis of Skills Demand in Indonesia FHI 360 Page 6
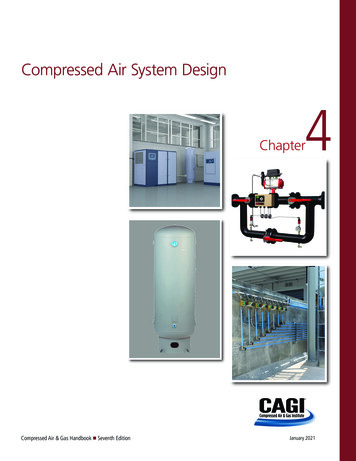
clients (export versus domestic, formal versus informal) are directly linked to different levels and typesof needed skills.3Utilizing these frameworks the Indonesia labor market assessment then looks at a specific example, theWest Java aftermarket automotive component manufacturing sector, utilizing both frameworks andtheir two key visuals to help the viewer to quickly understand how economic activity drives the demandfor skills in Indonesia and what the implications are for local actors interested in workforcestrengthening.4The Indonesian Labor Market SystemIt’s not just about skills, it’s about labor market systems. Indonesia’s labor market needs are challengingbecause they’re not just about skills, or a skills gap – they are about local labor markets. The mostsuccessful countries have organized their workforce development system within the larger framework oftheir economic system. There are several pre-requisites for Indonesia towards building an inclusive,well-functioning labor market. The nation or a region needs to: (1) have an economic vision aroundwhich players are aligned, (2) have mechanisms for translating employer demand to educationalinstruction and for educational institutions to respond to that demand, and (3) offer a range of services(to prepare people for jobs and help them find them, etc.) which can be accessed by all segments of thepopulation.Labor market systems that work well do so because of the effectiveness of the connective tissue.Conversely, labor markets such as those in Indonesia that do not work well in terms of adapting to newskills, or preparing labor for even basic skills needed, have very limited or poor connectivity. In almost alllabor market systems, the most fundamental causes for lack of connectivity are related to the skewedincentives that link the private and public sectors (such as, dysfunctional public resource flows, rentseeking behavior on the part of business owners, “turf” battles between ministries that should becollaborating, etc.) Other causes for lack of connectivity include the immaturity of specialty servicemarkets like employment services, sector specific skills development services, labor market informationsystems (LMIS), mentoring programs, research, etc.More conventional workforce development approaches have tended to overlook the importance ofunderstanding, analyzing, and designing interventions around improving the connectedness of thesesystems; this is a mistake any approach in Indonesia must not make. Figure 2 below is an example of atypical formal labor market system, with slight customization, i.e. the abbreviated names of the relevantIndonesian organizations at the national level have been inserted where relevant. Typically this is doneat the national level, however as will be explained later in this assessment, the economic landscape andthus the labor market and policy environment in Indonesia is geographically very diverse, and to get ahandle on the labor market would require this type of system mapping on the provincial/district or valuechain level for the target growth areas.3Value Chain analysis has a well established methodology. To learn about value chains and the steps of a typicalanalysis please see USAID Microlinks. lue-chain-wiki/32-valuechain-analysis4The illustrative examples used in this report and based primarily on desk research. A full analysis would requirefield research and additional analysis.Analysis of Skills Demand in Indonesia FHI 360 Page 7
Figure 2. Stylized Depiction of the Indonesian Labor Market SystemThe advantage of initially mapping the system is that this information can be used as a baseline, withkey variables that include “connective tissue” measurable through techniques such as Social NetworkAnalysis (SNA). In addition, the map can be used as a conversation piece during stakeholder meetings –why, for example, aren’t the existing mechanisms for communication about skills supply and demandworking as effectively as they could be? And finally, how to best draw on the system’s assets to catalyzeskills-led growth? For example, a positive feedback loop would begin with investment in skills for whichthere is market demand, lead to increased investments in growing value chains, resulting in continuedinvestment in skills, and continued growth. A negative feedback loop would begin with a case wheregrowth is constrained by lack of skills, and the education system is not producing skilled graduates. Thiswould result in lower investment overall (including in skills) by private sector actors, and lead to evenslower (or negative) growth. A mapping and understanding Indonesian labor market systems will help toavoid these pitfalls.Analysis of Skills Demand in Indonesia FHI 360 Page 8
II. Background – IndonesiaOverall Economic Trends in IndonesiaIndonesia has been a growth success story with GDP increasing to five times its size since 2000 - from165 billion USD in 2000 to 868 billion USD in 2013 5; however this growth is now hitting the followinglimits: (a) geography – Jakarta, the Capitol of Indonesia and driver of regional growth, has become amega city, and is now tripping over itself as investments in infrastructure and services have not kept upwith growth; (b) reforms - top-down interventions in fiscal/monetary policy have been accomplishedand growth mileage has been gotten out of them whereas the next level of needed reforms is morecomplex and decentralized; and (c) skilled workforce - the rapid economic growth has put the existingskilled people to work, and Indonesia needs a new and increasing crop of skilled people. Increases areneeded in the numbers of skilled workers, the types of skills they have, and the level of complexity ofthose skills. On the public sector side, to continue Indonesia’s pace of growth the next level of neededreforms are deeper, requiring institutional change, and will take more time. Likewise, further privatesector growth will require not only improved skills, but adaptation in focus, incentives, and businessculture6.Overall, Southeast Asia’s economic success has been linked to export growth. For Indonesia, exportgrowth has been primarily in low value-added, low technology-intensive sectors, with investors takingadvantage Indonesia’s low wage rates and low cost environment in areas such as apparel and footwear.Export growth if it is to come needs to be in higher value-added products and services and this will bringhigher skills requirements.Indonesia’s primary export drivers have been natural resource-based industries and light manufacturing,as the economy has grown this has not yet changed. Recently there has been significant growth indomestic markets and what we are seeing now is a diversified (aka more modern) economydomestically. The next logical step for Indonesia’s economic development (the most efficient way toexpand Indonesia’s slice of the global trade pie) is to enter and be competitive in a greater number ofhigher value added sectors for export. For example it would make sense to move out of naturalresources and light manufacturing, and move in to the export of advanced manufacturing products andservices.By definition, GDP growth comes from two sources: increases in labor input (population growth andlabor force participation rates) and increases in labor productivity. Over the past 20 years, 39% of GDPgrowth in Indonesia has come from labor input, with the remaining 61% coming from productivitygrowth. In many countries, productivity grows primarily through a shift of workers from relatively lowproductivity agriculture to other higher productivity sectors. While this phenomenon explains about18% of the growth in Indonesia, an in-depth analysis by McKinsey7 found that “the majority ofIndonesia’s productivity gain has come not from a shift of workers from lower-productivity agricultureinto more productive sectors, but from productivity improvements within sectors.” This is Y.GDP.MKTP.CD/countries/ID?page 2&display defaultFor example, home accessories buyers have, despite Indonesia’s excellent designs, become frustrated withrepeated failure to deliver high quality on time. Production has been shifting to nearby countries such as Vietnam.USAID SENADA. End Market Analysis. Furniture Industry Value Chain. 2007 DAI.7“The Archipelago Economy: Unleashing Indonesia’s Potential,” McKinsey Global Institute, September, 2012.6Analysis of Skills Demand in Indonesia FHI 360 Page 9
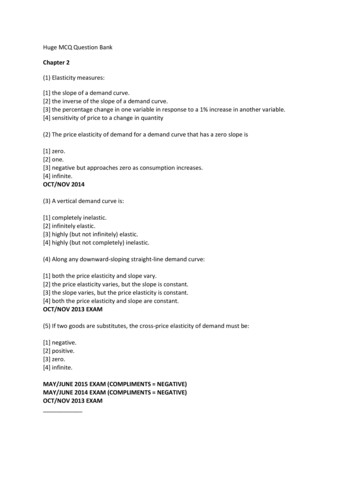
since increased competitiveness is ultimately derived from an economy’s ability to upgrade its intrinsicproductivity.8Productivity gains in all sectors, and employment shifts across sectors explain much of the recenteconomic growth in Indonesia. These gains have not been focused on any single area as the majoreconomic sectors of: agriculture, resources, manufacturing, and most importantly services—have allcontributed productivity gains, boosting GDP. The Indonesian productivity pattern is unique to ASEANcountries (the Asian Tiger’s success model was one of export led growth), in that Indonesia with a highlevel of consumption, has grown a robust domestic service sector that has become the most significantdriver for the economic growth.Each Indonesian worker is now contributing on average more to GDP than ever before. Concurrent withproductivity increases, employment in Indonesia has also been increasing, showing that productivityincreases do not have to lead to job losses. Despite these significant gains, Indonesian labor productivityhas been growing from a relatively low level and the labor productivity of each Indonesian worker is stillbelow that of most Southeast Asian peers. The 1997-1998 Asian Financial Crisis pushed productivity inIndonesia downward relative to the other countries. Since that time Indonesia and its neighboringcountries of Malaysia and Singapore have witnessed similar labor productivity growth rates (slope of theline), yet Indonesia still finds itself well below these other countries labor productivity. Table 1 belowpresents national labor productivity rates for South East Asian countries, including Indonesia.9Table 1. National Labor Productivity Rates for South East Asian CountriesThe long-term comparisons in Table 1. above provide an excellent snapshot of the productivity of theoverall Indonesian economy growing relative to its peers, and the estimates are useful when analyzing8“On Competition,” Michael Porter, Harvard Business Review Press, 2008.Productivity is an average measure of the efficiency of production. For ease of comparison, the countryproductivity estimates are indexed to 1980. See Annex 2 for a detailed description of what productivity measures,represents and means.9Analysis of Skills Demand in Indonesia FHI 360 Page 10
country competitiveness across the ASEAN region.10 Ensuring the continuation of this pattern ofproductivity increases coupled with job growth will be key, as Indonesia still needs significantproductivity gains to catch up with regional competitors; of which skills development is a keycomponent.Education and SkillsEducation providers in Indonesia consist of public education, non-formal education, and the privatesector. Public education in primary, lower secondary, and upper secondary focus on the foundationalskills of math and literacy. The Ministry of Education also provides vocational education and highereducation curricula that focus on preparing students for the labor market through work-readiness skills.Table 2 below shows improving educational attainment at all income levels in Indonesia. From 1997 to2012, there has been a steady increase in the average years of schooling. However, there is a ‘floor’below which formal sector employers are generally not willing to train and hire, that floor is completinglower secondary, i.e. 9th grade.11 Figure 1 shows that the poorest 20%, Quintile 1, on average do not yetmeet that minimum employment threshold.Table 2: Average Years of Schooling in Indonesia, Individuals Age 15-19 by Income Quintile 1997-2012Note: Quintile 1 represents the poorest 20%, quintile 5 represents the richest 20%.Source: World Bank EdStats.Despite increasing educational attainment across all levels and The Ministry of Education’s (MoEC) pushto increase vocational education, the quality of institutions remain a concern with many firms reportingthat these graduates, despite going further in education, are still not well-prepared for the labor market.Individuals, particularly poor and vulnerable populations, may also acquire work-readiness skills throughnon-formal education. These education and training programs are mainly provided by MoEC, TheMinistry of Labor (MoMT), non-governmental organizations, and the private sector. These programs areoften a source of second chance education for disadvantaged groups; however, there is much variation1011For a sector specific look at productivity in Indonesia see Annex 3.USAID HELM Firms Perceptions of Graduates CompetenciesAnalysis of Skills Demand in Indonesia FHI 360 Page 11
in the quality of these programs with firms often unaware of these programs’ existence andcertifications.In 2014, The Ministry of Education increased compulsory education to 12 years of schooling. This willallow more students from the lower quintiles to meet firms’ minimum education requirements, andtrends in Table 2 are promising, suggesting average schooling across individuals from all quintile levelswill increase. Nonetheless, school fees, the need for immediate employment, and other barriers toeducation remain, and many of the poor and vulnerable from the poorest 20% are not able to completelower secondary education. Individuals in this group will not be able to meet the firms’ minimumrequirements and thus become excluded from Indonesia’s future working-class. To reach the poor andvulnerable will require a complementary set of interventions including support for home-basedenterprises, building bridges for cyclical informal sector activity12, and offering a more diverse set ofservices beyond skills interventions. (To better map out these activities requires fieldwork.)These challenges around education ultimately impact how skilled workforce enters the employmentmarket. Indonesia’s growing economy will require ever greater levels and numbers of skilled workers.Yet, while economic growth in Indonesia has been accompanied by significant public investment ineducation, challenges noted above undermine this investment resulting in fewer and lower qualitygraduates. Demand for skilled labor will require sustained increases in the bandwidth (quantity/quality)of supply coming out of secondary and tertiary institutions over time. We are seeing increasing numbersof young people achieve higher levels of qualifications, though not at the scale demanded by thegrowing economy.12Much informal sector business growth is counter-cyclical, i.e. during times of economic hardship many peopleuse self-employment options as a fallback. In the economy, we often see a set of low-productivity, low-growthpotential enterprises expand, essentially serving as a social safety net. This was clearly the case in Indonesia afterthe 2008 global financial crisis. Some informal sector enterprise activity, however, is cyclical – grows with theeconomy – due to business relationships (for example, informal suppliers or distributors in a growing value chain).For individuals working in these types of informal enterprises, there may be opportunities to build a career paththat crosses over into the formal sector. For those who choose to remain in the informal sector, services can helpowners and workers achieve more stable income patterns.Analysis of Skills Demand in Indonesia FHI 360 Page 12
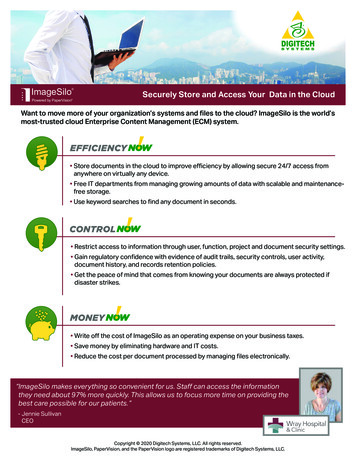
Figure 3. Stocks and Flows: Indonesia’s Education to the Labor MarketThe above diagram is a representation of Indonesia’s formal education system as of 2012 (the educationflows), as well as the stock of the youth workforce, aged 15 to 30, by level of educational attainment.The top level of the diagram is a snapshot of the formal education system, based on gross enrollmentrates for 2012. While the bottom half of the diagram shows four stocks of the youth workforce: thosewith less than a primary education, those with a primary education but less that a secondary education,those with a secondary education, and those with a tertiary education. These stocks were based on the2010 population census, and updated for each year between 2010 and 2012 based on a “stock-andflow”’ methodology developed by Workforce Connections. The dotted lines between the education flowand youth workforce stocks represent the youth, aged 15, that are exiting the formal education systemin 2013 to enter into the workforce. The numbers next to the bottom four dashed arrows represent theoutflow from these “stocks” of workforce – our best estimate of the number in each category who turn30 and are no longer counted as “youth”.Analysis of Skills Demand in Indonesia FHI 360 Page 13
The largest proportion of youth are those thathave completed primary school but have notattained a secondary education, making up 53percent of the total youth workforce. This isfollowed by those with a secondary education (34percent of the youth workforce). Tertiaryeducated youth is the fastest growing populationwith an average 18 percent growth rate from2010 to 2012. This shows that the majority ofyouth in the Indonesian workforce do not meetthe basic educational requirements for formalsector employment. Furthermore, despite thegains in basic education, those gains are notkeeping up with population growth as the stockof young people in the labor force with less thanprimary education is growing at a rate of 7% peryear. While the number of young people in thelabor market with only a secondary education isdecreasing, this is probably due to the significa
new hires arrive with these skills. There are some soft skills that may be delivered through the public education system (OECD countries have been building soft skills into basic education curricula for over a decade), and soft skills, just like academic skills, build on each othe