Transcription
Introduction toCost of Service Studiesand Rate DesignJim LazarRAP Senior AdvisorOctober 18, 2011The Regulatory Assistance Project50 State Street, Suite 3Montpelier, VT 05602Phone: 802-223-8199web: www.raponline.org
Topics For Discussion What is a Cost of Service Study– Types of Studies– Key controversial elements– Policy Decisions for the Board Rate Design– Major Issues– Principal Goals– Policy Decisions for the Board2
Many Ways To Calculate“Cost of Service”Categories of Studies Marginal Cost Embedded CostApproaches Within EachCategory Production /Transmission– Peak Responsibility– Base – Intermediate– Peak– Peak Credit Distribution Costs– Minimum System– Basic CustomerAll Of These Rates AreBased On The “Cost of Service”PedernalesCustomer ChargeEnergy ChargeAll kWh 22.50 0.102First 500 kWhOver 500 kWhFirst 500 kWhOver 500 kWh 6.000.0670.0910.0670.109Minimum 5/monthFirst 350 kwh Next 150 kWh Next 500 kWh Over 1,000 kWh 0.1220.1390.2940.404AustinCustomer ChargeWinterSummerPacific Gas and ElectricCustomer ChargeEnergy Charge3
Types of Cost of Service StudiesEmbedded CostMarginal Cost Divide up actual currentcosts of the utility system Backward-looking Require extreme detail ofhistorical costs Most common type forcoops; most stateregulators use for IOUs Dozens of differentmethods Measure the cost of buildingand operating a new utilitysystem. Forward-looking Base cost allocation on thereplacement cost of thesystem Require less data Used by many of the states,including California, Oregon,MontanaVintaging: Assigning certain older, usually cheaper resources to specificcustomers. Seldom used, but sometimes applicable.4
Some of the Basic Theories andPrinciples for Cost Analysis There are as many ways to calculate “costof service” as there are analysts doingstudies. No method is “correct” Many regulators require multiple studies,and consider the results of multiplemethods. Some are based on engineeringprinciples, some on economic principles.5
Determining the CustomerClasses Residential Commercial Industrial AgriculturalOr Secondary Voltage Primary Voltage Transmission Voltage Biggest issue forPEC is probablywhether to separaterural customers intoa separate sub-class Line extensionpayment credits Lower system density Different usagecharacteristics6
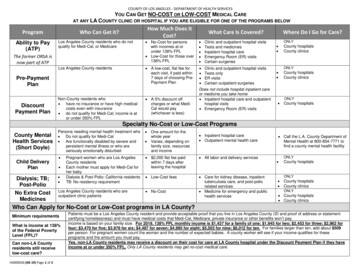
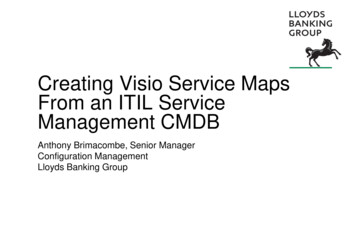
ThePowerGrid7
Dividing Up the RevenueRequirement Costs are FUNCTIONALIZEDbetween Electric and Water, andbetween Production,Transmission, Distribution, andCommon Costs are CLASSIFIEDbetween Energy, Demand, andCustomer related. Costs are ALLOCATEDbetween customer classes. In general, we try to track coststhrough to rates on the samebasis that they are classified andallocated.8
WhyWhyDoesDoes ItIt Matter?Matter? On a typical utilitysystem, residentialclass is 90% ofcustomers, 60% ofpeak demand, 50% ofkWh sales.– Costs classified as“customer-related” fallheavily on this class.– Industrial customersadvocate for higherclassification tocustomer and demand.CustomersResidentialCommercialIndustrialkWh SalesResidentialCommercialIndustrial9
WhyWhyDoesDoes ItIt Matter?Matter? Costs classified as“customer-related” often(not always) flow throughto the fixed monthlycharge. This lowers the kWhcharge against whichconsumption decisionsare made. The marginal cost ofadding a customer is low;the marginal cost ofadding energy supply isnot.CustomersResidentialCommercialIndustrialkWh SalesResidentialCommercialIndustrial10
Classification of Costs BetweenDifferent Usage Elements Classification of costs means deciding whetherthey are related to “demand”, “energy”, or“customer” functions so they can be assigned tothe classes based on usage characteristics. Many costs have dual purposes, and must be split.11
Classification: Not so easy. Some are easy:– Substation capacity is „demand‟ related– Fuel is „energy‟ related– Billing is „customer‟ related. Some are less clear– Baseload power plants are not built to meet “peakdemand” but to serve energy needs all year.– Long-distance transmission lines are sized based oncapacity, but built to avoid fuel costs.– 14 kv distribution upgrades reduce energy losses Important to always ask: “Why is this costbeing incurred?”12
Allocation: Assigning Costs ToCustomer Classes The allocation step assigns all of the utility‟s coststo the different customer classes, based on theirnumber of customers, peak demand, and energyusage.13
Basic Principles of Cost AllocationWhat? Why? How? What’s Next? Cost Causation: What costs are caused by the usage of a customer group?Why Was It Built? Just because it‟s “engineered”based on a certain demand does not mean it was builtbecause of that particular demand.Shared Usage: Different customers use the systemat different times of day or seasons of year. All shouldshare in the system costs.– Even a 100% off-peak customer should help pay for the utilityinfrastructure. What Will It Cost To Replace:Looking ahead,will the replacement cost be vastly different than the costincurred in the past?14
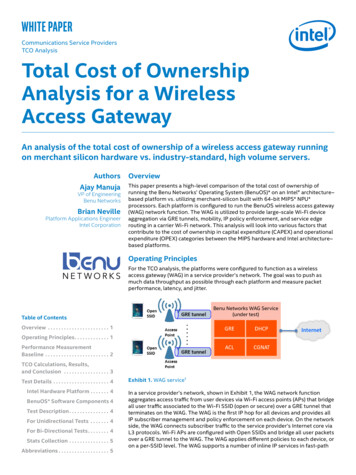
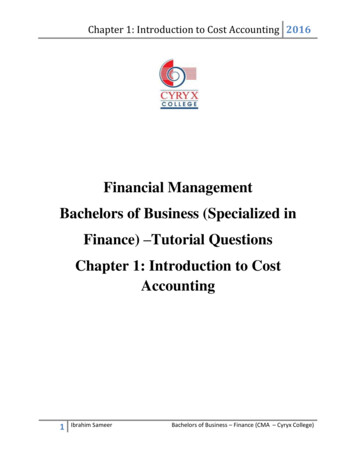
The Result:Cost of Service By ClassCosts By CategoryRevenue Requirement By Class3% 3%7% 3%14%70%8%10%4%10%68%Purchased PowerLaborDepreciationInterest expMaterialsMarginResidentialSmall PowerOther ClassesLarge PowerIndustrial15
SustainabilitySustainabilityIssuesIssues The more costs classified to energy, the higherthe cost-based energy charges are, and thegreater the incentive to conserve energy. The more costs classified to demand, the higherthe demand charges are, and the greater theincentive to control peak demand. The more costs classified to customer, thehigher the monthly service charges, and thelower the costs for energy and demand,reducing price incentives for efficiency.16
ecisionsTheseDecisions Several days of expert testimony beforethe Commission.– Utilities– Industrial intervenors– Consumer intervenors– Environmental intervenors– Commission staff analysis Written Decision On Specifics17
Spectrum of MethodsProduction CostsConsumer ersState Regulatory AgenciesEnergyWeighted12 le PeakIssue: Should the LCRA wholesale rate designbe flowed through to the PEC retail rate design?18
Spectrum of MethodsDistribution CostsConsumer AdvocatesEnvironmentalGroupsEnergyIndustrial CustomersState Regulatory AgenciesEnergyWeighted12 MonthlyPeaksSingle PeakMinimumSystemCustomerIssue: How should PEC classify and allocatethe distribution infrastructure costs?19
Production Costs Fixed Costs: Investment in power plants,maintenance, depreciation, interest.– Peak Responsibility Method: Classify these as“demand” related, allocate based on peak demand– Energy-Weighted Method: Classify only the cost ofpeaking units as demand related; baseload unitsmostly classified as energy-related. Variable Costs: Fuel, and Operations– Nearly all studies classify these as energy-related PEC: Embedded in LCRA Rate Design20
Transmission Costs Fixed Costs: Investment in transmissionlines, maintenance, depreciation.– Peak Responsibility Method: Classify these as“demand” related, allocate based on peak demand– Energy-Weighted Method: Classify only the cost oftransmission associated with peaking units asdemand related; transmission for baseload unitsmostly classified as energy-related. PEC: Very small portion of expense21
Distribution Backbone CostsMinimum System Method: The cost of a hypothetical“minimum distribution infrastructure” is driven by thenumber of customers, and should be recovered in thecustomer charge. (Minimum system method) Used by most (not all) consultants to coops. Last PEC Consultant used a variation of this. Rejected by most state regulatory commissions.Basic Customer Method: Only meters, meter reading,and billing are considered “customer-related.” All otherdistribution costs are Demand or Energy Used by most state regulatory commissions,including TX22
Customer-Related CostsMeters, Meter Reading, BillingNearly all studies consider the meters,meter reading, and billing costs to becustomer-related.Usually “weighted” according to thecomplexity of the rate design –industrial customers are assigned aweighting of 5 – 10.23
SustainabilityIssuesTime of Use Issues Should the study differentiate customerusage by time of day?– Residential usage spreads into evenings– Office building usage peaks during day– Lighting is mostly off-peak Direct power costs are lower off-peak Environmental impacts may differ by timeof day.24
Marginal Cost Studies Marginal cost studies measure theCHANGE in costs as the number ofcustomers, the peak demand, or thekWh sales changes.– Look at cost of new power resources, notolder, depreciated low-cost units.– Generally ignore system backbone costs,because these do not change.25
Marginal Cost Studies Measure cost of a peaking resource (demandresponse) as the cost of peaking capacity Measure marginal cost of a baseload powerplant as the marginal cost of energy; Measure marginal cost of an additionalmeter, meter read, and bill as the marginalcost of an additional consumer. Multiply each by the relevant usagequantities for each class. Must reconcile to the revenue requirement.26
Controversy OverLong-Run Marginal Cost Methods Production:– Full replacement costs, or only variablerunning costs until a capacity deficiencyoccurs? Distribution:– Use the full cost of rebuilding thedistribution system, or only the cost ofconnecting additional customers to anexisting system27
Benefit of Marginal Cost Study Looks at the changes in cost going forward.Can guide rates that are forward looking. Full recognition of new power supply costs,including environmental costs. Communicates to the utility and tocustomers the long-run costs imposed (orsaved) by additional (decremental) usage. Most studies find that power supply costshave risen more than distribution costs, soweight power supply more heavily.28
Cost of ServicePolicy DecisionsFor the BoardPolicy Issues for the Board Type of study: Embedded, marginal, or both. Customer sub-classes: Differentiate largeresidential from small, urban from rural, etc. Include time-of-use analysis? Single methodology or multiple methodologies.– Treatment of baseload resource costs (demand vs.energy; as-billed or cause-causation?)– Distribution infrastructure: per consumer, per kW, orper kWh?– Option: Ask Texas Office of Public Utility Counsel fora set of assumptions appropriate for Texas.29
Rate Design30
Rate Design Principles of Rate Design Methods need not be identical to COS Determining the monthly serviceavailability charge Determining rate blocks and demandcharge levels Advanced Rate Design Revenue Stability31
Principles of Rate Design– Simplicity, understandability, public acceptability, andfeasibility of application– Freedom from controversy as to interpretation– Effectiveness at recovering the revenue requirement– Revenue stability from year to year– Gradual change over time– Fairness in apportionment of costs– Avoid “undue discrimination”– Encourage efficient use of service– Discourage inefficient use of service32
Elements of Electric Rates Service Availability Charge (or “Basic” chargeof “Customer” Charge– Fee for being connected to the system, without anyusage included. Energy Charge– Price per kilowatt-hour May be differentiated by block, by time of day, or by season Demand Charge (Schedule D and larger)– Price per kW or kVA of peak demand May be differentiated by time of day or season33
Rate Classes and Complexity Smaller customers are less sophisticated, andneed simpler rate design. The largest customers have full-time purchasingmanagers who understand extreme details. But 8-year olds understand the Baskin-Robbinsrate design.– 1 scoop 1.50– 2 scoops 2.50– 3 scoops 3.00 And almost every cellphone user understands “free nightsand weekends.”34
Achieving Clean Energy Goals Achieving ambitious clean energygoals requires dramatic changes inthe production and utilization ofelectricity.––––Renewable ResourcesEnergy EfficiencySmart TechnologiesCoal retirement Three principal toolsPrograms– Policies: IRP, RPS, EEPSPricing– Programs: EE Funding, Smart Grid Policies– Pricing: This topic35
Many Rate Philosophies CPUC: Reflect marginal costs for usage; muchlower rates for basic level of service. Electric Cooperatives: Recover a large part offixed costs in fixed charges. Set energy ratesbased on power supply cost only Washington State: Baseline approach: hydroat hydro rates, thermal at thermal rates Municipal Utilities: Low basic charges, withincentives for conservation ALL of these are based on “cost of service.”36
A Few Important Rate Design Terms Load Factor– The ratio of average usage to peak usage. A 100 kW demand customer, using 36,000 kWh/month has a 50% load factor.– 100 kW x 720 hours /month 72,000– 36,000 / 72,000 50%– Customers and loads with low load factors cost more to serve per kWh. Load Shape– The relative amount of usage during on-peak hours versus off-peak hours. Street lights have a 50% load factor, but it‟s all off-peak. Office buildings have a 50% load factor, but it‟s almost all during the business dayMonday – Friday Residential customers have a 50% load factor, but about 35% of their usage is onweekends.– Customers and loads with on-peak load shapes cost more to serve per kWh Power Factor– Power factor is the cosine of the angle between the active power (kW) andapparent power (kVA) in a circuit. Yeah, right. Power Factor is a measure of the stability between usage and generation It‟s like the foam on the head of the beer – fills the glass, but doesn‟t do any good.– Customers and loads with low power factors cost more to serve per kWh.37
Methods Need Not Be Identical tothe Cost of Service Method Cost of service studies apportion costsbetween classes. They are focused onONE ELEMENT of a fair rate design. Rate design sets rates within classes, andinfluence consumption decisions. Allocation can be retrospective (embeddedcost study) with rate design forwardlooking (marginal).38
Determining the Rate Classes Currently, all residential customers in asingle class: large, small, urban, rural– Usage patterns (Load shape) may be different– Distribution costs per customer are different Not clear why water wells are a separateclass. Small Power is all customers under 75kW; many utilities cut this off at 20 kW.39
Determining the Monthly ServiceAvailability Charge Current charge recovers about 35% of thedistribution system costs. “Basic Customer” method sets this basedon metering and billing costs alone – morelike 10% of total distribution costs. Gradualism principle may guide a policy tohold the current level, and apply futureincreases to the usage charges.40
Determining the Rate Blocks PEC currently has a “flat” rate: same price for allkWh. In residential and small power, this recoverssome distribution costs that are classified as“demand” related in the COS studies. May be useful to study load shape by usagelevel, to see if (as on most utilities), load shapeand load factor are worse for larger (i.e., waterheat and space conditioning) customers. Example: Introduce a higher cost block forusage in excess of 1,000 kWh (about wherespace heating and cooling begin).41
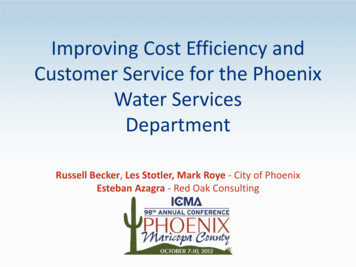
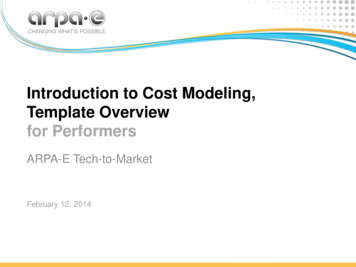
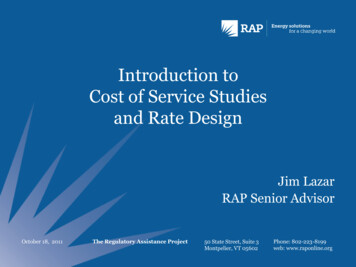
Example: Gradually Implement aRate Like Arizona Public Service’s42
Inverted Block Rate for PEC4-Year Phase-In%IncreaseBill ImpactUsage5001,0001,5002,0002,5003,000 74.60126.70178.80230.90283.00335.10 74.60130.87187.14243.40299.67355.94 74.60135.37196.14256.91317.68378.45 0%43
Advanced Rate Design Topics Time of Use Rates– Fixed period TOU– Critical Peak Pricing– Peak-Time Rebates– Real-Time Pricing kVA Demand Charges Feed-In Tariffs Net Metering44
Time-Of-Use Pricing (TOU) Increasingly common as advancedmetering becomes less expensive. Typically two or three-period. Would require new MDMS for PECOff-PeakMid-PeakOn-Peak 0.08 0.10 0.1245
Time-Of-Use Pricing (TOU)Combined With Inverted Block Increasingly common as advancedmetering becomes less expensive. Typically two or three-period. Would require new MDMS for PECOff-PeakMid-PeakOn-PeakFirst 500 kWh 0.08 0.10 0.12( 0.03)46
Critical Peak Pricing (CPP) Starts with a “normal” TOU rate, slightly lower than itwould otherwise be. Adds an element of uncertainty: on extreme peakdays, for defined hours, the price jumps sharply. Customers get notice of critical peak events,maximum 100 hours per year. Would require new MDMS for PECOff-Peak 0.07Mid-Peak 0.10On-Peak 0.13Critical Hours 0.5047
Peak Time Rebates (PTR) A credit for reduced load at times ofsystem extreme peaks.– /kW, or /kWh, for either utility control ofload, or calculated load reductions.48
Real-Time Pricing Customer rate is tied to real-time marketclearing price for power. Only for sophisticated consumers Georgia Power program has a coststabilization feature that makes it moreacceptable to industrial customers.49
Feed-In Tariffs and Net Metering Rates designed to compensate customers withon-site generation for their power production. Feed-In Tariffs pay a price (usually a premiumprice) for power delivered to the grid. Net Metering charges customers only for the“net” power flow through their meters, effectivelypaying them the retail rate for the power theydeliver to the grid. PEC currently has an energy-cost only netmetering program. A TOU net-metering program will recognize theon-peak nature of solar power.50
kVA Demand Charges PEC Demand charges are /kW; there areno charges or credits for low or high powerfactor. Distribution system capacity is rated inkVA, which accounts for the power factor(kW / Power Factor kVA) kVA demand charges more appropriatelycollect for the costs imposed on thesystem.51
Revenue Stability Measures Decoupling is the most commonlydiscussed way to stabilize the utility netincome. High service availability charges do this aswell, but mute consumer price signals. High levels of financial reserves, togetherwith the ability to adjust rates if needed,gives PEC a “simple” option.52
Rate DesignPolicy Issues for the Board Rate Classes– Single residential class, or multiple subclasses– Water wells as separate class– Intermediate demand-metered general service 20kW Residential Rate Design– Phase in inverted block kW or kVA demand chargesAdvanced Pricing: TOU or CPPFeed-In Tariff or Net MeteringRevenue stabilization options53
About RAPThe Regulatory Assistance Project (RAP) is a global, non-profit team of experts thatfocuses on the long-term economic and environmental sustainability of the powerand natural gas sectors. RAP has deep expertise in regulatory and market policiesthat: Promote economic efficiency Protect the environment Ensure system reliability Allocate system benefits fairly among all consumersLearn more about RAP at www.raponline.orgJim Lazar: jlazar@raponline.org
Oct 18, 2011 · All Of These Rates Are Based On The “Cost of Service” Pedernales Customer Charge 22.50 Energy Charge All kWh 0.102 Austin Customer Charge 6.00 Winter First 500 kWh 0.067 Over 500 kWh 0.091 Summer First 500 kWh 0.067 Over 500 kWh 0.109 Pacific Gas and