Transcription
Introduction to Cost Modeling,Template Overviewfor PerformersARPA-E Tech-to-MarketFebruary 12, 2014
Outline‣ Context for Cost Modeling– Motivation, Definitions, and Examples‣ Template Description– Scope, Overview, Worksheet Details‣ Final RemarksFebruary 18, 2016Cost Modeling1
Part I‣ Context for Cost Modeling– Motivation, Definitions, and Examples‣ Template Description– Scope, Overview, Worksheet Details‣ Final RemarksFebruary 18, 2016Cost Modeling2
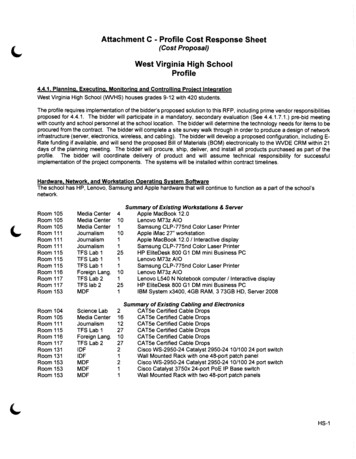
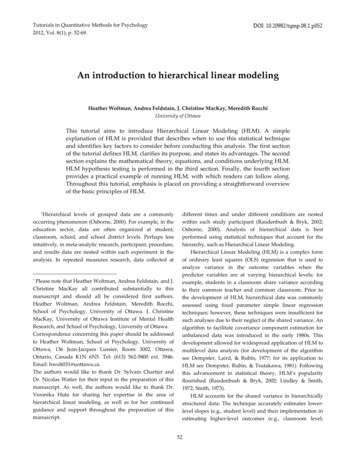
Cost & Value‣ Production cost (necessary but not sufficient by itself) Willingness to pay (customer value) Value creation potential of productConsumerSurplusWTP ValueCreatedPriceProducerSurplus (Profit)CostFebruary 18, 2016Cost Modeling3
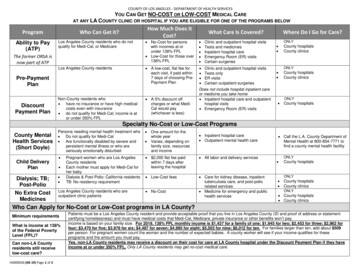
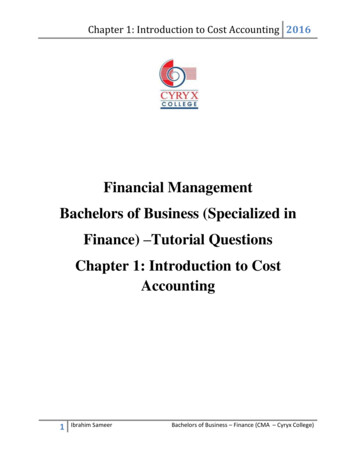
Economic Modeling for TechnologyFull Business Financial ModelCash flow,dynamics oframping productionand varying sales,investments timingSimilar informationfor other projectscompeting forresources decision-makingProduction / Operation Cost ModelDetermine resources(and ) required forat-scaleproduction/operationBasic Materials & ProcessTabulatematerial/componentflow, labor & energyuse, equipment, etcBill of Materials(BOM) – list of“ingredients”Simple blockdiagram ofproduction stepsMost performers aim for basicform of “Production Cost Model”February 18, 2016Cost Modeling4
Cost Modeling Enables Research &Development‣ Integrates calculations together forholistic consideration‣ Identify cost drivers steerresearch‣ Communicate results withstakeholders– Internal: R&D, Management, Marketing– External: Industry Advisors, Investors,Customers, Licensing PartnersFebruary 18, 2016Cost Modeling5
Modeling Benefits, Despite Uncertainty‣ Possible concern:“It’s too early—there is too muchuncertainty to calculate exactly howprofitable this company/productwould be.” ‣ Modeling still beneficial:– Make uncertainties explicit– Identify most valuableimprovements– Develop targets, metrics– Bound with theoretical limits– Create thought framework forreducing uncertaintiesFebruary 18, 2016WTP CostCost Modeling6
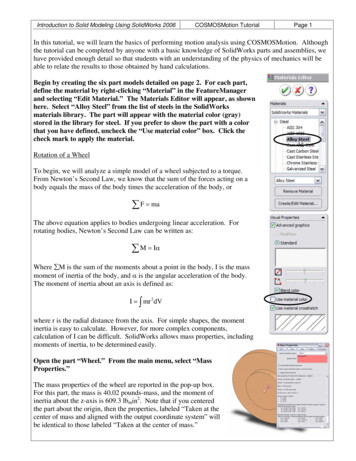
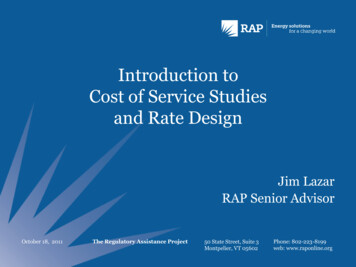
Example Techno-Economic Analysis‣ Wave Energy Converters0.50Cost ( /kWh)‣0.45Proposal0.400.350.09– Reduce buoy cost by order of magnitude0.120.300.25‣0.20Discovery0.170.15– Buoy contributes small portion of overall0.10cost0.050.00‣ Opportunity– Enhance wave sensing boost output,achieve competitive cost of electricity(Courtesy of Sea Engineering, Inc.)February 18, 2016Cost Modeling7
Outline‣ Context for Cost Modeling– Motivation, Definitions, and Examples‣ Template Description– Scope, Overview, Worksheet Details‣ Final RemarksFebruary 18, 2016Cost Modeling8
Template ScopeMODEL INCLUDESAll major cost factors for production of saleable productProduction model for bottom-up calculation of labor, material,and capital requirements to meet production volumeCost sensitivity and scaling analysesEstimated value of production project using sale priceMODEL DOES NOT INCLUDEOperational details (e.g. schedule of work shifts)Minute product detailsGrowth dynamics of business, production, or salesCompany financial model (debt, equity, taxes, etc.)February 18, 2016Cost Modeling9
Template Worksheets#Sheet Name1Process Diagram“Hand-drawn” block diagram2Results SummaryDisplays key model inputs, outputs, essential analysis3Production Model &OpEx4CapEx5ProductPerformancePerformance metrics, tied to production model if possible,supporting product value to customer6Financial“Fully loaded” product cost, price, margin, payback period7Cost Analysis8Mass & EnergyFebruary 18, 2016DescriptionStep-by-step calculations: materials, labor, and productionrequirements (core of whole spreadsheet)Building, equipment, tools, etc.Sensitivity analysis, step-by-step breakdown, scalingSupporting calculations regarding materials and processesCost Modeling10
Sheet 1: Process Diagram‣ Capture the entire production process in easily understood format– Descriptive step names and step-wise material inputs and outputs– Establish modeling level of detail: each step to receive its own treatment in productionmodel– Overall inputs and output define position in value chainFebruary 18, 2016Cost Modeling11
Sheet 2: Results Summary‣ Provides a quick-look at key model inputs and outputs– May choose to link inputs from this page to quickly run and show multiplescenariosFebruary 18, 2016Cost Modeling12
Sheet 3: Production Model & OpEx (1/3)‣ Builds up quantitative operating requirements forreaching desired production volume– Calculate backwards: [production volume] [throughput of last step] [throughput of second-to-last step] [throughput of first step]– Requires definition of: Process-Step Properties: Batch Size; Cycle Time; Usage of Labor,Materials, Utilities; Yield, etc. Operational Availability: Days per Year, etc.‣ Tabulates consumption and production– Materials/Components, Labor, Utilities, Product– Calculates and implements required parallel production stations, step-wise– Using cost rates, calculates all operating expensesFebruary 18, 2016Cost Modeling13
Sheet 3: Production Model & OpEx (2/3)‣ Batch definition grants flexibility– Allows realistic, convenient units and conversion of units during steps Units must match between steps; convert units from input to output within a step– For continuous process: maintain proportions, absolute values of materials andtime can be arbitrarily small as neededFebruary 18, 2016Cost Modeling14
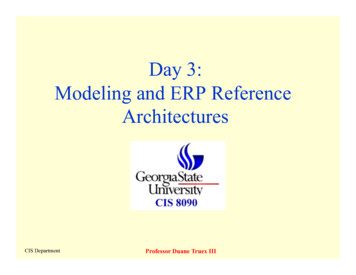
Sheet 3: Production Model & OpEx (3/3)(1) Step-wiseRequired GrossProduction Volume1 (Batch Input Quantity )i 1 GPVi GPVi 1 Yi (Batch Output Quantity )i batches per day(step i)batches per day(step i 1)(2) ParallelProductionRequired(Min Req' d Prod Lines)i batches perday per line(3) LaborRequiredDirect Labor Y: Yield(e.g. 98%)GPVibatch size conversion factor(must be same units)1 Operating Hours UtilMAX OperatingDay maximum allowed Hours utilization (e.g. 85%) Batch i WorkersOperating Hours # Lines UtilizationLineOperating Day(person-hrs/day)February 18, 2016Cost Modeling15
Sheet 4: CapEx‣ Calculate capital expenditures– Equipment/machinery/tooling totals from per item price and number ofstations– Estimated floor space needed from equipment sizes (rent is in OpEx)February 18, 2016Cost Modeling16
Sheet 5: Product Performance‣ Calculate/capture quantitative performance metrics– Tied to production model if possible– Metrics selected based on customer needs and segmentation of market supports target price and production volume– May expand sheet to model product operation estimate value, willingnessto payFebruary 18, 2016Cost Modeling17
Sheet 6: Financial‣ Production project value calculation– Capital Depreciation OpEx “Fully Loaded” Unit Production Cost– Price, Margin Revenue Profit Payback PeriodFebruary 18, 2016Cost Modeling18
Sheet 7: Cost Analysis‣ A closer look at cost factors and uncertainties– Single-variable sensitivity analysis: automatically calculate and display changes infully loaded cost due to variation in model input variables– Scaling of unit cost with production volume (including automatic re-calculation ofOpEx and CapEx based on production requirements)– Cost breakdown by production step and resource categoryFebruary 18, 2016Cost Modeling19
Sheet 8: Mass & Energy‣ Calculations to provide or support values used inproduction model or product performance– e.g. balancing chemical equations, thermodynamics, part count/massderivation– Housing calculations here maintains focus and clarity in other sheets– (not populated in template)February 18, 2016Cost Modeling20
Outline‣ Context for Cost Modeling– Motivation, Definitions, and Examples‣ Template Description– Scope, Overview, Worksheet Details‣ Final RemarksFebruary 18, 2016Cost Modeling21
Final Remarks‣ Get started modeling cost early, and refine as knowledge advances– guess as placeholder to get framework in place (and make note of it)– work on larger factors first (getting first significant digit right is a challenge)‣ Use, manipulate, and adapt the template spreadsheet to suit yourneeds, but– be guided by its scope (deliberate)– don’t dodge necessary considerations because of difficulty to validateor seemingly unfavorable results‣ Full business financial model (cash flow, debt, timing, etc.) alsoneeded before pitching for external financing (not shown here)‣ Send any cost modeling questions & comments to your ARPA-ETech-to-Market AdvisorFebruary 18, 2016Cost Modeling22
ENDFebruary 18, 2016Cost Modeling23
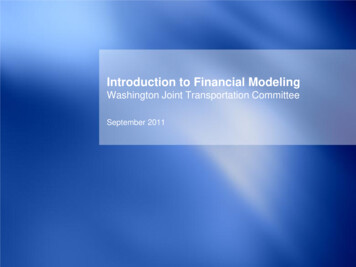
Appendix: Matching Uncertainties (old)Increasing Technology Readiness LevelSmall-scale process unitSmall-scale experimentaldata / "Minimum Viabledata / conceptual prototypeProduct"Pilot plant data / ScaleProductDemonstration scale data /For Sale ProductionProcess ModelBlock Flow Diagram / Bill ofMaterialsProcess Flow Diagram /BOM rough scematicProcess Simulation /Computer Aided DesignSimulation verified withoperating data / DetailedCADPrice InputsPublished prices, estimatesbased on similar products /processesVendor discussions toinform major costs,estimates on othersEstimates of majority ofoperating costs andcapital equipmentVendor quotes for mostequipmentNegotiated contract dataData Inputs90% of equipment and 98% included and verifiedoperating costs included by an independent 3rdas a line itempartyDiscount rate based onFull Weighted Averagevariability of free cash Cost of Capital with all Taxflow with marketShields includedLevel of DetailMajor cost drivers onlyCapital CostingRecognizing that it will havea required return"Rule of 72" - 10%discount rateApproximateeffort40 man-hours200 man-hours2,000 man-hours5,000 man-hoursReview/InputCo-Worker ReviewSeveral co-workers fromvarying disciplinesInput from a potentialinvestor under a NDAFully shared with EPC andbank, open tomodification/scrutinyCost Model UseFocusing Research andDevelopment EffortDeveloping researchtargets/goalsFebruary 18, 2016Understanding long-term Securing Bank Financing,viability of theprojecting earnings,technology, pitching VC'sactivity-based costingCost Modeling24
(BOM) – list of “ingredients” Simple block diagram of . Use, manipulate, and adapt the template spreadsheet to suit your needs, but – be guided by its scope (deliberate) – don’t dodge necessary considerations because of difficulty to validate or seemingly unfavorable results ‣ Full business financial model (cash flow, debt, timing, etc.) also needed before pitching for external .