Transcription
IBM Software GroupJVM Performance Tuning with respect toGarbage Collection(GC) policies forWebSphere Application Server V6.1 - Part 1Giribabu ParamkushamAjay BhalodiaWebSphere Support Technical Exchange
IBM Software GroupObjectives Understand Java5 Garbage Collection for IBM JVMs Selecting the Correct GC Policy Analyze GC output and provide suggestions Tuning Java heap for performance Questions/AnswersWebSphere Support Technical Exchange2
IBM Software GroupWhat is Garbage Collection Responsible for allocation and freeing of memory Allocates objects using a contiguous section ofJava heap Ensures the object remains on the heap as long asit is in use Reclaims objects that are no longer referencedWebSphere Support Technical Exchange3
IBM Software GroupUnderstanding Garbage Collection Two main technologies used to remove the garbage: Mark Sweep Collector Copy Collector IBM uses a mark sweep collector or a combination for generational (gencon) Garbage Collection can be broken down into 3 steps Mark: Find all live objects in the system Sweep: Reclaim objects that are no longer referenced Compact: Converts many small holes into fewer large ones toavoid fragmentation All steps are in a single stop-the-world (STW) phase Application “pauses” while garbage collection is runningWebSphere Support Technical Exchange4
IBM Software GroupWhy different GC policies? GC performance issues can take many forms Definition of a performance problem is user centric User requirement may be for: Very short GC “pause” times Maximum throughput A balance of both First step is to ensure that the correct GC policy has beenselected for the workload type Second step is to ensure heap sizing is correct Third step is to look for specific performance issuesWebSphere Support Technical Exchange5
IBM Software GroupFew but simple GC policies in IBMIBM provides four simple GC “Policies”, optimized for scenarios1. -Xgcpolicy:optthruput optimized for throughput (defaultgc policy)2. -Xgcpolicy:gencon optimized for short lived objects toreduce pause times while maintaining good throughput3. -Xgcpolicy:optavgpause optimized for applications withresponsiveness criteria by greatly reducing STW times.Reduction usually between 90% to 95%. Eg. Portalapplications4. -Xgcpolicy:subpools optimized for multi processorsystems (recommended for 16 or more processors)WebSphere Support Technical Exchange6
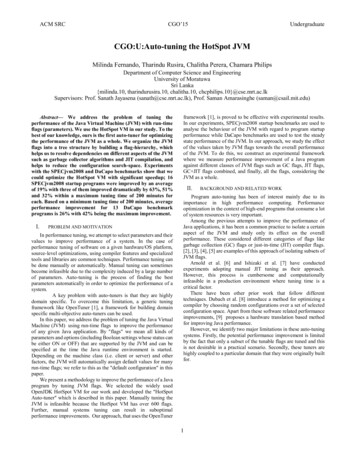
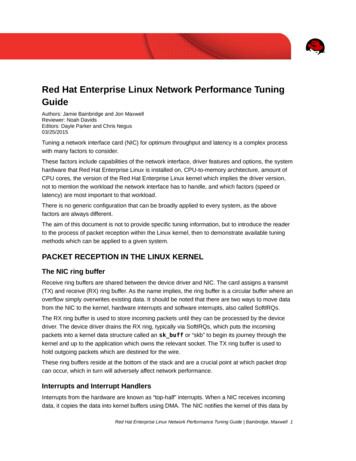
IBM Software GroupGenerational and Concurrent GC (gencon)WebSphere Support Technical Exchange7
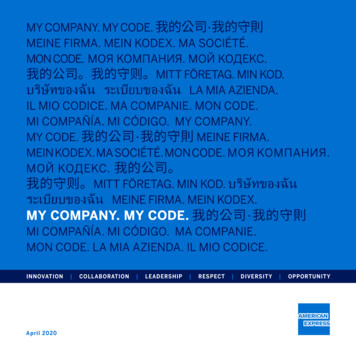
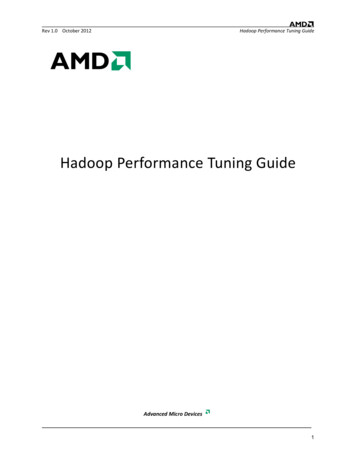
IBM Software GroupComparing IBM gencon policy to SUN JVM GC collectorJVM HeapNursery/Young GenerationOld GenerationIBM J9:IBM J9:-Xmo (-Xmos/-Xmox)Sun:-XX:NewRatio n-Xmn (-Xmns/-Xmnx)Sun:-XX:NewSize nn-XX:MaxNewSize nn-Xmn size Minor Collection:Major Collection:Permanent SpaceSun JVM Only:-XX:MaxPermSize nntakes place only in the young generation, normally done throughdirect copying very efficienttakes place in the new and old generation and uses the normalmark/sweep ( compact) algorithmWebSphere Support Technical Exchange8
IBM Software GroupWebSphere Support Technical Exchange9
IBM Software GroupSample verbosegc for optthroughput (default) af type "tenured" id "1" timestamp "Sun Mar 12 19:12:55 2006" intervalms "0.000" minimum requested bytes "16" / time exclusiveaccessms "0.025" / tenured freebytes "23592960" totalbytes "471859200" percent "5" soa freebytes "0" totalbytes "448266240" percent "0" / loa freebytes "23592960" totalbytes "23592960" percent "100" / /tenured gc type "global" id "3" totalid "3" intervalms "11620.259" refs cleared soft "0" weak "72" phantom "0" / finalization objectsqueued "9" / timesms mark "74.734" sweep "7.611" compact "0.000" total "82.420" / tenured freebytes "409273392" totalbytes "471859200" percent "86" soa freebytes "385680432" totalbytes "448266240" percent "86" / loa freebytes "23592960" totalbytes "23592960" percent "100" / /tenured /gc tenured freebytes "409272720" totalbytes "471859200" percent "86" soa freebytes "385679760" totalbytes "448266240" percent "86" / loa freebytes "23592960" totalbytes "23592960" percent "100" / /tenured Allocation requestdetails. And state ofheap beforecollectionHeap occupancydetails afterrunning GCHeap occupancydetails after therequest thattriggered theallocation wassatisfied. time totalms "83.227" / /af WebSphere Support Technical Exchange10
IBM Software GroupSample verbosegc for gencon af type "nursery" id "35" timestamp "Thu Aug 11 21:47:11 2005" intervalms "10730.361" minimum requested bytes "144" / time exclusiveaccessms "1.193" / nursery freebytes "0" totalbytes "1226833920" percent "0" / tenured freebytes "68687704" totalbytes "209715200" percent "32" soa freebytes "58201944" totalbytes "199229440" percent "29" / loa freebytes "10485760" totalbytes "10485760" percent "100" / /tenured gc type "scavenger" id "35" totalid "35" intervalms "10731.054" flipped objectcount "1059594" bytes "56898904" / tenured objectcount "12580" bytes "677620" / refs cleared soft "0" weak "691" phantom "39" / finalization objectsqueued "1216" / scavenger tiltratio "90" / nursery freebytes "1167543760" totalbytes "1226833920" percent "95" tenureage "14" / tenured freebytes "67508056" totalbytes "209715200" percent "32" soa freebytes "57022296" totalbytes "199229440" percent "28" / loa freebytes "10485760" totalbytes "10485760" percent "100" / /tenured time totalms "368.309" / /gc nursery freebytes "1167541712" totalbytes "1226833920" percent "95" / tenured freebytes "67508056" totalbytes "209715200" percent "32" soa freebytes "57022296" totalbytes "199229440" percent "28" / loa freebytes "10485760" totalbytes "10485760" percent "100" / /tenured time totalms "377.634" / /af WebSphere Support Technical ExchangeAllocation requestdetails, time it tookto stop all mutatorthreads.Heap occupancydetails beforeGC.Details about thescavenge.Heap occupancydetails after GC.11
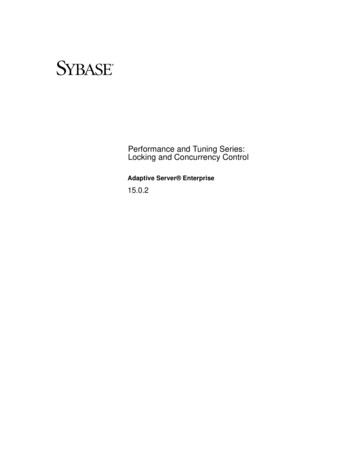
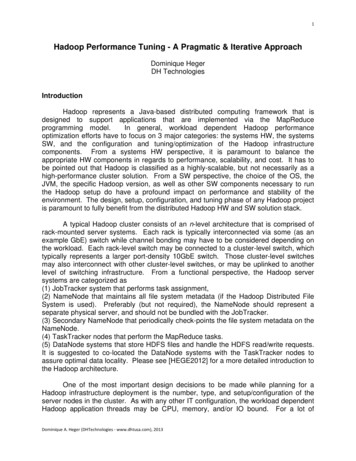
IBM Software GroupBenchmarking two GC policiesoptavgpaseWebSphere Support Technical Exchangegencon12
IBM Software GroupBenchmarking (cont )WebSphere Support Technical Exchange13
IBM Software GroupTuning Java heap for performance Maximum possible Java heap sizes The “correct” Java heap size Fixed heap sizes vs. Variable heap sizes Heap Sizing for Generational GC 32 bit Java processes have maximum possible heap size 32 bit architecture has addressable space of 2 32 Which is 4GigaBytes Determined by the process memory layout 64 bit processes do not have this limit Limit exists, but is so large it can be effectively ignored Addressability usually between 2 44 and 2 64 Which is 16 TeraBytesWebSphere Support Technical Exchange14
IBM Software GroupTheoretical and Advised Max Heap SizesWebSphere Support Technical Exchange15
IBM Software GroupThings to consider when moving to 64 bit Moving to 64bit removes the Java heap size constraint However, ability to use more memory is not “free” 64bit applications perform slower More data has to be manipulated Cache performance is reduced 64bit applications require more memory Java Object references are larger Internal pointers are larger Major improvements to this in Java 6.0 due to compressedpointersWebSphere Support Technical Exchange16
IBM Software GroupThe “correct” Java heap size GC will adapt heap size to keep occupancy between 40% and 70% Heap occupancy over 70% causes frequent GC cycles Which generally means reduced performance Heap occupancy below 40% means infrequent GC cycles, butcycles longer than they need to be Which means longer pause times than necessary Which generally means reduced performance The maximum heap size setting should therefore be above 40%larger than the maximum occupancy of the application. For example43%: Maximum occupancy 43% means occupancy at 70% of totalheap Eg. For 70MB occupancy, 100MB Max heap required,which is 70MB 43% of 70MBWebSphere Support Technical Exchange17
IBM Software GroupTrade-off: Heap Size vs. PerformanceHeap sizeOccupancyGC overheadTime takenOut Of Memory crash100 MB110 MB89%77%30s120 MB82%37%9s130 MB75%20%9s140 MB69%14%8s200 MB49%9%7s400 MB24%4%7s800 MB12%4%7sWebSphere Support Technical Exchange18
IBM Software GroupFixed heap sizes vs. Variable heap sizes Should the heap size be “fixed”? i.e. Minimum heap size (-Xms) Maximum heap size (-Xmx)? Dependent on application For “flat” memory usage, use fixed For widely varying memory usage, consider variable Variable provides more flexibility and ability to avoidOutOfMemoryErrors Variable Heap Sizes GC will adapt heap size to keep occupancy between 40% and 70%WebSphere Support Technical Exchange19
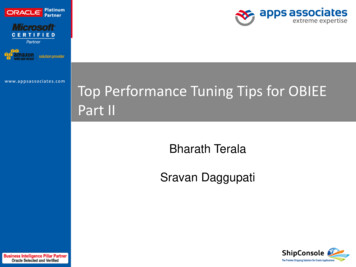
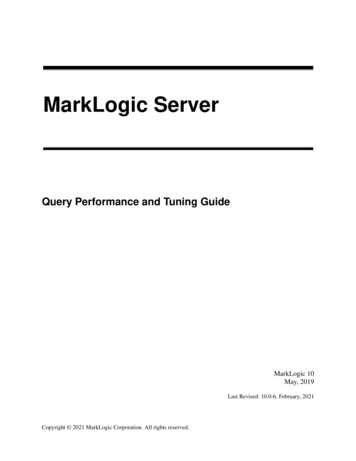
IBM Software GroupHeap Sizing for Generational GCWebSphere Support Technical Exchange20
IBM Software GroupSizing the Nursery “Copying” from Allocate to Survivor or to Tenured space isexpensive Physical data is copied (similar to compaction which is alsoexpensive Ideally “survival” rates should be as low as possible Less data needs to be copied Less tenured/global collects that will occur The larger the nursery: the greater the time between collects the less objects that should survive Recommendation is to have a nursery as large as possible Whilst not being so large that nursery collect times affect theapplication responsivenessWebSphere Support Technical Exchange21
IBM Software GroupTools - GCMV Features Parse and plot IBM verbose GC logs Analyses heap usage, heap size, pause times, and many other properties Compare multiple logs in the same plots and reports Handles optthruput, optavgpause, and gencon GC modes. Many views on data Reports Graphs Tables Can save data to HTML reports JPEG pictures CSV filesWebSphere Support Technical Exchange22
IBM Software GroupGarbage collection and Memory Visualizer (GCMV)WebSphere Support Technical Exchange23
IBM Software GroupTools – PMAT Features The following features are included: GC analysis GC table view Allocation failure summary GC usage summary GC duration summary GC graph view GC pattern analysis Zoom in/out/selection/center of chart view Option of changing chart color. The tool can also parse IBM, SUN and HP JVM Handles optthruput, optavgpause, and gencon GC modes.WebSphere Support Technical Exchange24
IBM Software GroupWebSphere Support Technical Exchange25
IBM Software GroupSummary How the GC works and various GC policies in 1.5 IBM JDK. How to select the right GC Policy based on applicationscenario How to interpret verbose GC output Tuning Java Heap for performance Available Tools to parse gc data and providerecommendationsWebSphere Support Technical Exchange26
IBM Software GroupReferences IBM JDK 5.0: Java Diagnostics sdk/v5r0/index.jsp Analyzing Verbose GC Outputhttp://www-1.ibm.com/support/docview.wss?uid swg21222488 GCMV - GC and Memory Visualizer (GCMV) from reLogin.do?source isa IBM Pattern Modeling and Analysis Tool for Java Garbage Collector (PMAT):http://www.alphaworks.ibm.com/tech/pmat Garbage Collection policies (Part -ibmjava2/ Garbage Collection policies ary/j-ibmjava3/WebSphere Support Technical Exchange27
IBM Software GroupAdditional WebSphere Product Resources Discover the latest trends in WebSphere Technology and implementation, participate intechnically-focused briefings, webcasts and podcasts munity/ Learn about other upcoming webcasts, conferences and s 1.html Join the Global WebSphere User Group Community: http://www.websphere.org Access key product show-me demos and tutorials by visiting IBM Education on/assistant View a Flash replay with step-by-step instructions for using the Electronic ServiceRequest (ESR) tool for submitting problems re/support/d2w.html Sign up to receive weekly technical My support tmlWebSphere Support Technical Exchange28
IBM Software GroupQuestions and AnswersWebSphere Support Technical Exchange29
IBM Software Group WebSphere Support Technical Exchange 6 Few but simple GC policies in IBM IBM provides four simple GC “Policies”, optimized for scenarios 1