Transcription
ACM SRCCGO’15UndergraduateCGO:U:Auto-tuning the HotSpot JVMMilinda Fernando, Tharindu Rusira, Chalitha Perera, Chamara PhilipsDepartment of Computer Science and EngineeringUniversity of MoratuwaSri Lanka{milinda.10, tharindurusira.10, chalitha.10, chcphilips.10}@cse.mrt.ac.lkSupervisors: Prof. Sanath Jayasena (sanath@cse.mrt.ac.lk), Prof. Saman Amarasinghe (saman@csail.mit.edu)Abstract— We address the problem of tuning theperformance of the Java Virtual Machine (JVM) with run-timeflags (parameters). We use the HotSpot VM in our study. To thebest of our knowledge, ours is the first auto-tuner for optimizingthe performance of the JVM as a whole. We organize the JVMflags into a tree structure by building a flag-hierarchy, whichhelps us to resolve dependencies on different aspects of the JVMsuch as garbage collector algorithms and JIT compilation, andhelps to reduce the configuration search-space. Experimentswith the SPECjvm2008 and DaCapo benchmarks show that wecould optimize the HotSpot VM with significant speedup; 16SPECjvm2008 startup programs were improved by an averageof 19% with three of them improved dramatically by 63%, 51%and 32% within a maximum tuning time of 200 minutes foreach. Based on a minimum tuning time of 200 minutes, averageperformance improvement for 13 DaCapo benchmarkprograms is 26% with 42% being the maximum improvement.I.PROBLEM AND MOTIVATIONIn performance tuning, we attempt to select parameters and theirvalues to improve performance of a system. In the case ofperformance tuning of software on a given hardware/OS platform,source-level optimizations, using compiler features and specializedtools and libraries are common techniques. Performance tuning canbe done manually or automatically. Manual tuning can sometimesbecome infeasible due to the complexity induced by a large numberof parameters. Auto-tuning is the process of finding the bestparameters automatically in order to optimize the performance of asystem.A key problem with auto-tuners is that they are highlydomain specific. To overcome this limitation, a generic tuningframework like OpenTuner [1], a framework for building domainspecific multi-objective auto-tuners can be used.In this paper, we address the problem of tuning the Java VirtualMachine (JVM) using run-time flags to improve the performanceof any given Java application. By "flags" we mean all kinds ofparameters and options (including Boolean settings whose status canbe either ON or OFF) that are supported by the JVM and can bespecified at the time the Java runtime environment is started.Depending on the machine class (i.e. client or server) and otherfactors, the JVM will automatically assign default values for manyrun-time flags; we refer to this as the "default configuration" in thispaper.We present a methodology to improve the performance of a Javaprogram by tuning JVM flags. We selected the widely usedOpenJDK HotSpot VM for our work and developed the "HotSpotAuto-tuner" which is described in this paper. Manually tuning theJVM is infeasible because the HotSpot VM has over 600 flags.Further, manual systems tuning can result in suboptimalperformance improvements. Our approach, that uses the OpenTunerframework [1], is proved to be effective with experimental results.In our experiments, SPECjvm2008 startup benchmarks are used toanalyse the behaviour of the JVM with regard to program startupperformance while DaCapo benchmarks are used to test the steadystate performance of the JVM. In our approach, we study the effectof the values taken by JVM flags towards the overall performanceof the JVM. To do this, we construct an experimental frameworkwhere we measure performance improvement of a Java programagainst different classes of JVM flags such as GC flags, JIT flags,GC JIT flags combined, and finally, all the flags, considering theJVM as a whole.II.BACKGROUND AND RELATED WORKProgram auto-tuning has been of interest mainly due to itsimportance in high performance computing. Performanceoptimization in the context of high-end programs that consume a lotof system resources is very important.Among the previous attempts to improve the performance ofJava applications, it has been a common practice to isolate a certainaspect of the JVM and study only its effect on the overallperformance. These considered different categories of flags likegarbage collection (GC) flags or just-in-time (JIT) compiler flags.[2], [3], [4], [5] are examples of this approach of isolating subsets ofJVM flags.Arnold et al. [6] and Ishizaki et al. [7] have conductedexperiments adopting manual JIT tuning as their approach.However, this process is cumbersome and computationallyinfeasible in a production environment where tuning time is acritical factor.There have been other prior work that follow differenttechniques. Dubach et al. [8] introduce a method for optimizing acompiler by choosing random configurations over a set of selectedconfiguration space. Apart from these software related performanceimprovements, [9] proposes a hardware translation based methodfor improving Java performance.However, we identify two major limitations in these auto-tuningsystems. Firstly, the potential performance improvement is limitedby the fact that only a subset of the tunable flags are tuned and thisis not desirable in a practical scenario. Secondly, these tuners arehighly coupled to a particular domain that they were originally builtfor.1
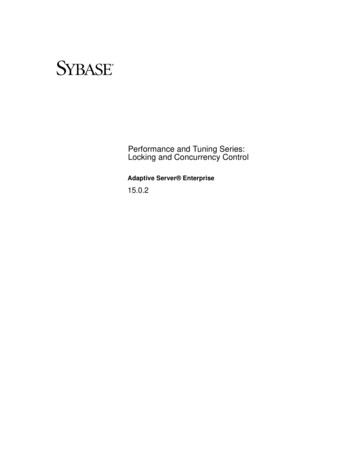
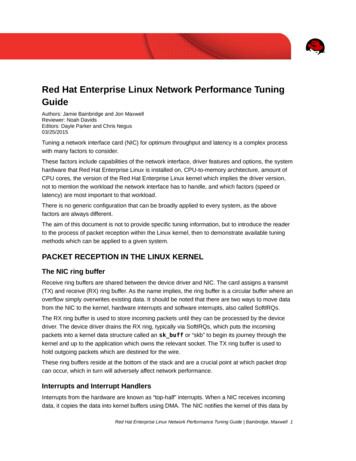
ACM SRCCGO’15UndergraduateFigure 1. JVM Flag HierarchyFigure 2. SPECjvm2008 percentage improvements (Architecture 1)III.UNIQUENESS OF THE APPROACHWe identify the following features as the unique components ofthis research.A. JVM Flag HierarchyInitial experiments were run with an unstructured set of JVM flags.That is, all JVM flags were fed to the auto-tuner with the same levelof significance. This approach however reduces the effectiveness ofthe tuning process. This is mainly because the auto-tuner isincapable of identifying invalid flag configurations. In this context,we define “invalid configuration” as any flag combination that failsto initialize a JVM instance.The auto-tuner may search over these invalid configurationsmaking the process inefficient. To overcome the issue, we modelledthe dependencies of JVM flags into a hierarchical structure thatwould enable the HotSpot auto-tuner to prune the theoreticalconfiguration space safely and focus only on the validconfigurations.The flag hierarchy was designed after analyzing HotSpot VMsource code (due to lack of documentation) which led us to therealization of how JVM flags are internally related. Later, we showthe impact of this improvement on the overall tuning time and theconvergence of the HotSpot auto-tuner. Fig. 1 shows the JVM flaghierarchy we developed. No such prior classification of JVM flagswere found in the previous literature.Figure 3. DaCapo percentage improvements (Architecture dsunflowtomcatxlanB. HotSpot Auto-tunerWe used OpenTuner as a framework to build an auto-tuner forHotSpot VM. Two important components of OpenTuner frameworkare configuration manipulator and the run function. Configurationmanipulator specifies the set of configuration parameters and theirpossible value ranges, which the HotSpot auto-tuner should searchover. The run function evaluates the quality of a specificconfiguration in configuration search space. Run function, F maps aconfiguration to a real number, which is a score representing thequality of the given configuration. (F: C ℝ where C is theconfiguration space). Output from the run function helps the tunerto compare two different configurations over configuration spaceand select the better configuration.As discussed in the previous subsection, we make use of the JVMFlag Hierarchy in order to reduce the configuration space thatHotSpot Auto-tuner would search over. We categorized the relatedGC flags together. This dramatically reduces the workload given tothe HotSpot auto-tuner because once a particular GC is selected, allparameters corresponding to other GC algorithms areTABLE 1. DaCapo improvements on Architecture 2DefaultTuned (ms)% 47,1763,48451.453,0321,68244.54TABLE 2. DaCapo improvements on Architecture alanDefault (ms)Tuned 5.789.6814.6110.6274.9045.8931.3578.10invalid in the selected context. The same rationale applies for JITflags as well. The effect of the flag hierarchy is discussed in detailin the next section with respect to the performance improvements ofbenchmark programs.The startup programs of SPECjvm2008 [10] suite were used toanalyze the auto-tuner’s effect on the JVM startup time and DaCapo2
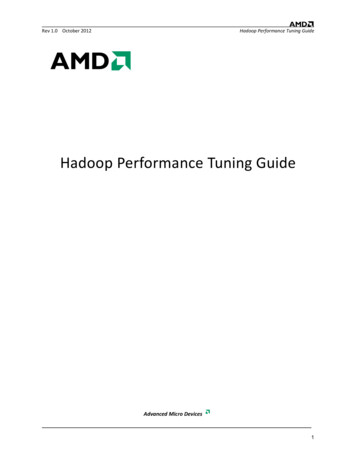
ACM SRCCGO’15Undergraduate[11] benchmarks were used to guarantee that achieved performanceimprovements sustain even after HotSpot VM reaches runtimestability.C. JVM Profiling DataRuntime statistics of the HotSpot VM are collected using jstatprofiler under both default and tuned configurations. With theseresults, we analyze the internal behavioral changes occurred in theJava Virtual Machine as a result of the tuning process. Eachbenchmark was run with jstat, using a profiling interval of 1 ms andthe changes in GC, JIT, and class loading behavior are analyzed forDaCapo benchmark programs.IV.EXPERIMENTAL RESULTSIn this section, we present experimental results obtained byrunning SPECjvm2008 and DaCapo benchmarks on HotSpot autotuner. We use following platforms to run experiments.Architecture 1Intel Core i7 CPU @3.40Ghz (4 cores), RAM: 16 GB, OS:Ubuntu 12.04 LTS, JVM: OpenJDK 7 (HotSpot VM) update55Architecture 2Intel Core i5-2400 CPU @ 3.10GHz (4 cores), RAM: 4 GB,OS: Ubuntu 14.04 LTS, JVM: OpenJDK 7 (HotSpot VM)update 55Architecture 3Intel Xeon E7-4820v2 CPU @2.00 GHz (32 cores), RAM: 64GB, OS: Ubuntu 14.04 LTS, JVM: OpenJDK 7 (HotSpot VM)update 55Experiments are run on Architecture 1 to demonstrate the autotuning process and other two architectures are used to validate theresults and show that the tuning process described here can beextended over different microarchitectures.In this study, we isolated flags into three different classes,Garbage Collector related flags (GC), Just-In-Time compilationrelated flags (JIT), and GC & JIT flags combined (GC JIT). Thisexperimental extension was developed to analyze the tuningbehavior of the HotSpot VM with respect to different areas of theJVM such as GC and JIT compilation. These results can be used todemonstrate how different aspects of the JVM affect performanceof different programs and how the auto-tuning process changed theinternal behavior of the JVM to produce better performance.Fig.2 and Fig.3 show SPECjvm2008 startup benchmark andDaCapo benchmark results respectively. They show that we couldoptimize the HotSpot VM with significant speedup; 16 SPECprograms improved with an average of 19.41%, maximum valuebeing 63.37%. Maximum tuning time for SPEC benchmarks was 3.5hours (210 minutes) for each program. DaCapo programs weretuned with a minimum tuning time of 200 minutes to obtain a tunedconfiguration. In the first round of experiments, performance ofeach benchmark program is first measured in their respectiveperformance metrics with the 'default' JVM configuration.In the second round of experiments, each program was run witha specific, tuned set of JVM flags; the flags and their values for eachprogram were determined by tuning the program with the HotSpotauto-tuner. Values for each performance metric is calculated as themean value of forty (40) iterations under each configuration with95% of statistical confidence.Same experiments were run on the other two architectures withDaCapo benchmarks and the results available as of this writing areshown in Table 1 and Table 2.Figure 4. fop tuning with and without the flag hierarchy(Architecture 1)From our results, it is seen that it is possible to obtain even betterperformance gains by considering all the tunable flags of the JVM.We discuss in detail the experimental results under followingsub-sections.A. Overall Performance ImprovementThe results in Fig 2 and Fig 3 show that, in general, the highestperformance improvement for a given benchmark program isobtained when all tunable JVM flags are fed to the HotSpot autotuner. Though there are certain exceptions for some programs, themajority of the programs conform to this observation.As we identified in the study, three most critical componentsthat affect performance of HotSpot VM are garbage collection, JITcompilation and class loading. HotSpot auto-tuner is capable oftuning all three aspects when all the JVM flags are given and theconfiguration space contains all possible configurations, includingthe point that generates best performance for a given architecture.We have proven in this study that the highest achievable JVMperformance improvement is obtained by tuning all JVM flags andHotSpot auto-tuner is capable of managing the computationalcomplexity. The potential of the HotSpot auto-tuner as a fast tuneris shown by the fact that most of the benchmark programs achievedtheir peak performance with a tuning time of 200 minutes.B. Flag Hierarchy and Tuning TimeIn most of the offline auto-tuning applications, dedicated tuningtime accounts for a considerable overhead. In our experiment, wepropose a methodology to reduce this tuning time with respect to theHotSpot VM. The organization of JVM flags into a hierarchicalstructure helps to prevent the HotSpot auto-tuner from generatinginvalid or spurious flag configurations. The results show thatenabling the HotSpot auto-tuner to search through the configurationspace with the support of the flag hierarchy helps it to converge to alocal optimum more aggressively. Without the flag hierarchy, thetuner takes more time to output the same level of performanceimprovement for a given benchmark.Due to the unmanaged computational complexity in the absenceof the flag hierarchy, HotSpot auto-tuner tend to test lots of bad3
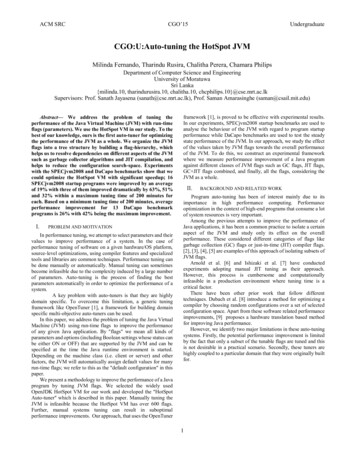
ACM SRCCGO’15UndergraduateFigure 5. h2 benchmark %HU (Architecture 1)Figure 8. pmd benchmark %HU (Architecture 1)Figure 6. h2 benchmark compilation rate (Architecture 1)Figure 9. pmd benchmark compilation rate (Architecture 1)Figure 10. pmd benchmark class loading rate (Architecture 1)Figure 7. h2 benchmark class load rate (Architecture 1)configurations initially, therefore producing performance valuesbelow the default performance value. This behavior is common forall the benchmarks and we demonstrate this phenomena usingDaCapo fop benchmark. (See Fig.4)C. Auto-tuning and JVM InternalsIn this section, we study what changes occur in the HotSpot VMas a result of the auto-tuning process. We conduct our analysis basedon the results obtained by DaCapo benchmarks as they representhow the HotSpot VM would behave in the steady state. We try tocompare our results with jstat profiling data in order to explain whythe auto-tuning process could improve JVM performance. Thisanalysis is based on recognizable patterns on empirical data.During our study, we analyze JVM components like GarbageCollection, JIT compilation and JVM class loading process. Wepicked particular jstat metrics in the analysis that provide the overallpicture of how GC threads JIT compiler and JVM Class loaderbehaved under each configuration, default and tuned. Selected JVMmeasurements are listed below. Overall Heap Usage Percentage (%HU)Number of Compilation Tasks per millisecond(Compilation Rate) Number of Classes Loaded per millisecond (ClassLoading Rate)Percentage Heap Usage can be seen as a measurement of thecapability of HotSpot VM to foresee the heap requirement for agiven program and allocate necessary heap memory so that theoverhead due to the GC threads are reduced. Percentage Heap Usageis calculated using Eq. 1.(1)where i {default, tuned}. We take summation of the heaputilization and allocation in KB for each heap generations S0(Survivor space 0), S1 (Survivor space 1), E (Eden space), O (Oldspace), and P (Permanent space).4
ACM SRCCGO’15The number of compilation tasks is directly taken from jstatoutputs. The measurements Compilation Rate and Class LoadingRate are calculated using Eq. 2 where f(t) is the number ofcompilation or class loading tasks performed between time t-1 andt.(2)The jstat profile data of tuned and default configurations of the 2selected programs on Architecture 1 are shown in Figs. 5-10 and arediscussed below.tuning process itself is optimized. We show the effect of thishierarchy by auto-tuning programs with and without the support ofthe flag hierarchy.JVM runtime is monitored under both default and tunedconfigurations to gain insight into the internal behavior of the JVM.With a comprehensive analysis of collected profiling data, we showwhat changes in the JVM are responsible for increased performanceof the JVM.Finally, we identify the significant internal changes occurred inthe HotSpot VM as a result of the auto-tuning process. Among them,overall heap usage, overall compilation rate and overall class loadingrate are the three most important factors.VI.1) H2 BenchmarkH2 benchmark executes a number of transactions against a modelof a banking application, replacing the HyperSQL database(HSQLDB) benchmark. According to experimental results H2benchmark depicts relatively low performance improvementcompared to other benchmarks.Considering the %HU shown in Fig.5, we can claim that the graphfor tuned %HU is more distorted than the default %HU. Tuned%HU shows more rapid fluctuation compared to defaultconfiguration which might be caused by unnecessary GC events.Even though tuned %HU contains more variation compared to thedefault configuration, Class Loading Rate of both tuned and defaultconfigurations varied in very similar manner (see Fig.7). Howeverthe Compilation Rate (see Fig.6) of the H2 benchmark is slightlyincreased compared to the default configuration. The fluctuated%HU and similar Class Loading Rate behavior in Tunedconfiguration might have decreased the performance while theimprovement in the Compilation Rate has managed to overcomethose decrements and improve the performance of the H2benchmark in a relatively low manner.REFERENCES[1][2][3][4][5]2) PMD Benchmark[6]PMD benchmark performs an analysis for a set of Java classes fora range of source code problems. As a result of auto-tuning processPMD benchmark has showed a high performance improvement (2ndhighest among the DaCapo benchmarks). The %HU and ClassLoading Rate of the both default and tuned configurations behave ina similar manner (see Fig.8, Fig.10). However, the Compilation Rateof the Tuned configuration shows a significant improvement (morethan 200%) over the default configuration (see Fig.9). We can claimthat this is a prominent reason for a high performance improvementof the PMD benchmark.From jstat profiling data, optimizations that took place in the JITcompiler are proven to be fundamental for majority of thebenchmark programs during their auto-tuning n this paper we present how to improve performance of HotSpotVM using HotSpot auto-tuner developed using the OpenTunerframework. To prove the tuner's capability, we demonstrated bysignificantly improving the performance of SPECjvm2008 (startup)and DaCapo benchmark programs after a short tuning period.The good configurations are not necessarily optimalconfigurations for a program and are decided based on the initialvalues of the parameters. This implies that there can be even betterconfigurations and we could potentially achieve them by continuingthe tuning process longer or initializing the tuning process withdifferent initial parameter values.A JVM Flag Hierarchy is introduced in this paper that can be usedto e
performance metrics with the 'default' JVM configuration. In the second round of experiments, each program was run with a specific, tuned set of JVM flags; the flags and their values for each program were determined by tuning the program with the HotSpot auto-tuner