Transcription
CoveredCallsQuick ReferenceGuide5Simple Steps for Identifying a Covered Call
Welcome to OptionsProThe sophisticated OptionsPro platform integrates seamlessly with the power andperformance of the VectorVest system to help you quickly and easily identify optimaloptions trades in real-time. This brand new money-making resource will not only saveyou tons of time, but also deliver a significant boost to your bottom line! Can’t wait toget started? This guide will show you how to combine the power of VectorVest and theunparalleled option analysis tools in OptionsPro to select and analyze the perfectcovered call.5Simple Steps for Identifying a Covered CallStep 1. Establish a Bullish Market BiasSuccessful options trades begin (and end) with accurate timing. The first thing you need toknow is whether the market’s trend is bullish, bearish or neutral. For the easiest way to get themost thorough and up-to-date market analysis, click the ‘Daily Color Guard Report’ video onthe VectorVest Home Tab. This short video ( 10 minutes) is updated nightly and will give youa comprehensive view of the market’s outlook, along with the types of strategies that offer thehighest probability of success for the current market .You can also check the Color Guard on the Home Tab for the following: A Green light in the Price column MTI 1.002
Step 2. U se the UniSearch tool to scan for good quality stocksto ownThe second critical step in making money with options is choosing the right underlying stockfor your options trade. With VectorVest’s powerful searches and indicators you’ll be able toquickly and easily find the best stocks for any type of options trade from aggressive to ultraconservative, whether it be a covered call or another option strategy of your choice.If you’re looking for the best of the best for your bullish options strategies, look no furtherthan VectorVest’s Stock Viewer where more than 8,000 stocks are automatically andcontinuously ranked for the best combinations of value, safety and timing or you can targetspecific investment goals using VectorVest’s UniSearch tool. In our covered call example,we’ll be using a VectorVest UniSearch favorite, “CC-S&P 500 Winners.”1. Click on ‘UniSearch’ tab in VectorVest 7.2. From the Searches directory on the left, click on the ‘Searches—Sure-Fire Success’group and double click on ‘CC-S&P500 Winners’ (or click on ‘Run Search’ button).3. Select the stocks found using your mouse and the CTRL SHIFT function on yourkeyboard.4. Click on ‘OptionPro’ on the top local tool bar. This will launch the Options Prosoftware and display a risk graph of the Covered call. Close or minimize the risk graph.13234
Step 3. U se the Options Pro software to scan for potentialCovered Call candidatesOptionsPro has proprietary analysis tools, graph studies and option scans to help youquickly and easily identify prime option candidates from any of your VectorVest selections.1. Along the right side of the OptionsPro Window you’ll find the ‘Symbol List’ importedfrom VectorVest. Click on ‘Send to;’ select ‘Matrix.’2. At the upper left of the window, under ‘Apply DT Scan,’ click on the drop down arrow,select ‘Advanced Scan’ and click on ‘Stocks w/Overpriced Options.Now continue your analysis on these filtered stocks using OptionsPro’s unique graph studies.OptionsPro has several of these studies that analyze the most critical factor in optionspricing —volatility. These studies compare historical and implied volatility so you can easilyspot overpriced options to sell and underpriced options to buy.3. Right click on the first stock in the scan results; select ‘Chart.’214. Click on the ‘Window’ menu option at the top of the OptionsPro; select ‘TileVertically.’ The Matrix window and the chart window will automatically be linked, or“grouped,” by color (see graph on next page).4
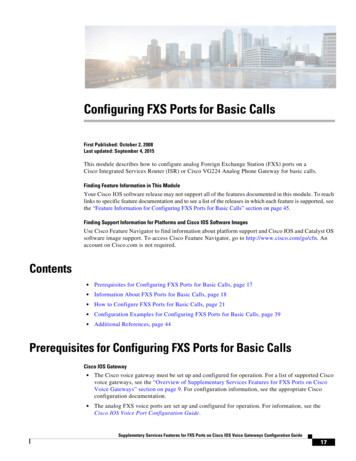
4grouped by colorOnce the windows are linked by group color, each stock that you click on in the Matrix will beloaded in the Chart window.5. Right click on the chart and select ‘Add Study;’ select ‘DT Volatility Comparison.’ Click‘OK’ to accept the default settings for this study.6. Right click on the chart again and select ‘Add Study’ and click on ‘DT Volatility Range.’7. A ‘DT Volatility Range’ window will appear. Change the Look back period to 45 andthe ‘Type’ to ‘Continuous Implied Calls.’ Click ‘OK.’(View step-by-step graphics on next page.)5
5676
8. Review the graphs to make your final selection. Click on each stock in the Matrix listto display the next chart. Look for the following:1. Price in an uptrend.2. Large separation between the CIV (Continuous Implied Volatility)Mean and HV (Historical Volatility).3. CIV Calls (Blue Line) above the 80 percentile of the average range.(Dotted lines represent 80th and 20th percentile).1237
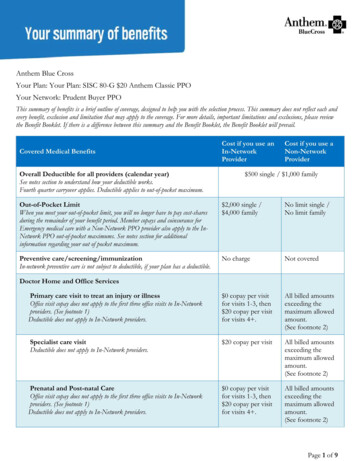
Step 4. U se the Decay feature to identify the ‘Sweet Spot’ for yourtrade (i.e., ideal entry, expiration and strike price).1. Click on ‘Decay’ in the menu on the left side of the OptionsPro window.This will open a Decay window. The default symbol is IBM.2. Enter the symbol of the stock you’ve selected for your covered call and press the enterkey on your keyboard. (Change the group color to gold if you would like to link the‘Decay’ study to the list of stocks in the Matrix.)The Theta Decay window allows you to forecast future values of Theta (Time Decay) onyour selected option (Time Decay) and to see the net result of the changes in value to theoption premium.It also creates a visual “Sweet Spot” to where options contracts should be executed to takemaximum advantage of pricing before a dramatic increase in Theta occurs resulting in theaccelerated decline of your options value.3. To add another option expiration date and strike price, click on the blue plus sign. Youwill now see another expiration date, strike price and option type (Call).321SweetSpotTheta “Sweet Spot”Option Value “Sweet Spot”The LLTC May option is in the “Sweet Spot” until 04/03/14 for the 50 Strike Price.8
Step 5. Check Volume and Open Interest1. Return to the Matrix window. Right click on the symbol in the Matrix and select‘Option Chain.’2. To modify the expiration date click on the expiration date field, place a check in thebox to the left of the desired date and then click ‘Close’ at the bottom of the menu.The selected dates will be applied to the chart as they are selected.2VolumeOpenInterest9
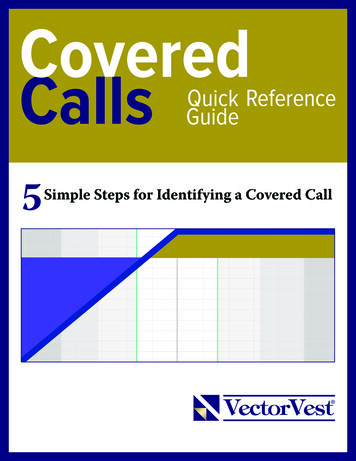
Finishing Touches —V iew Your Complete Trade Using theRisk Graph1. Maximize the original Risk Graph or launch another by clicking the ‘Risk’ button onthe left side menu panel. (If launching a new risk graph, type the symbol you wouldlike to analyze in the symbol box and change the color in the ‘Group’ window to goldto link this graph to your list of stocks in the Matrix.)2. To choose the expiration month left click on the arrow in the drop down menu; selectthe desired expiration.3. Strike Price can be chosen by left clicking on the arrow to the right of the drop downmenu, available strikes for the month chosen are identified by black text. (Strike pricesthat are available for the current expiration but are available for other expiration datesappear in light grey text. Moving your mouse over the light grey strike prices willalert you to which expirations have those strikes available to trade. The nearest to themoney strike will appear in bold colored text.4. Click ‘Apply.’5. Your Credit, Max Profit, Max Risk and Breakeven will appear at the upper right.23514Max profit occurs when stock pricereaches the strike price of the short callProbability lines designate onestandard deviation above andbelow the current stock price10
And there you have it! Start using these OptionsPro essentials today to elevate your optionstrading to a whole new level, and if you have time, make sure to take advantage of ourOptionsPro tutorial video at www.vectorvest.com/optionsprotutorial. Our expert staff isalso here to help you with any questions you have, just give our dedicated help line a call at1-888-658-7638.Here’s to bigger, better profits!VectorVest is comprised of reports embodying a unique system of stock analysis. All the contentsand recommendations are based on data and sources believed to be reliable, but accuracyand completeness cannot be guaranteed. Users should be aware of the risks involved in stockinvestments. It should not be assumed that future results will be profitable or will equal pastperformance, real, indicated or implied. VectorVest and/or its principals may purchase or sellany of the securities herein. VectorVest and the logo style, geometric design are, individuallyand collectively, service marks owned by VectorVest, Inc.VectorVest is published daily by VectorVest, Inc.20472 Chartwell Center Drive, Cornelius, NC 28031.US/Canada 1-888-658-7638 International 1 704-895-409511
for your options trade. With VectorVest’s powerful searches and indicators you’ll be able to . This will launch the Options Pro software and display a risk graph of the Covered call. Close or minimize the risk graph. 1 4 2 3. 4 Step 3. Use the