Transcription
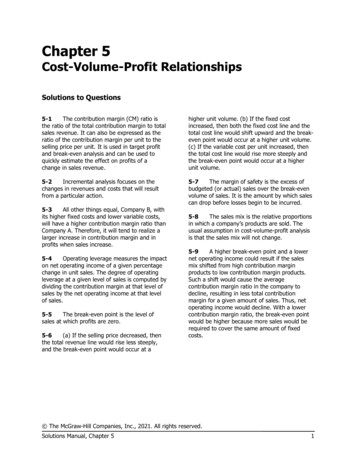
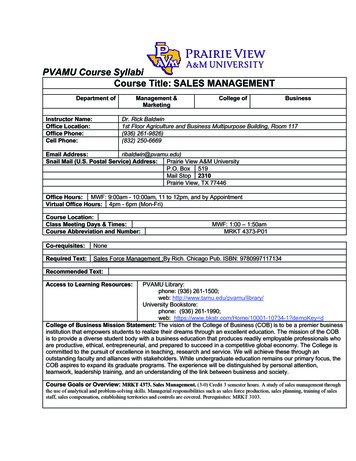
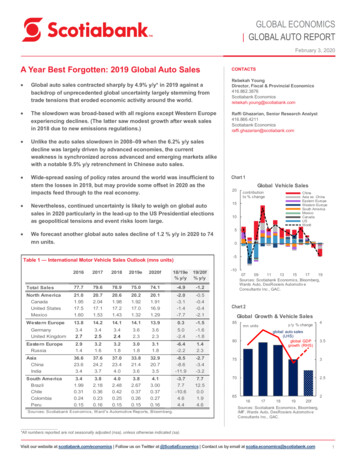
GLOBAL ECONOMICS GLOBAL AUTO REPORTFebruary 3, 2020A Year Best Forgotten: 2019 Global Auto SalesCONTACTS Global auto sales contracted sharply by 4.9% y/y* in 2019 against abackdrop of unprecedented global uncertainty largely stemming fromtrade tensions that eroded economic activity around the world.Rebekah YoungDirector, Fiscal & Provincial Economics416.862.3876Scotiabank Economicsrebekah.young@scotiabank.com The slowdown was broad-based with all regions except Western Europeexperiencing declines. (The latter saw modest growth after weak salesin 2018 due to new emissions regulations.)Raffi Ghazarian, Senior Research Analyst416.866.4211Scotiabank Economicsraffi.ghazarian@scotiabank.com Unlike the auto sales slowdown in 2008–09 when the 6.2% y/y salesdecline was largely driven by advanced economies, the currentweakness is synchronized across advanced and emerging markets alikewith a notable 9.5% y/y retrenchment in Chinese auto sales. Wide-spread easing of policy rates around the world was insufficient tostem the losses in 2019, but may provide some offset in 2020 as theimpacts feed through to the real economy.Chart 1Nevertheless, continued uncertainty is likely to weigh on global autosales in 2020 particularly in the lead-up to the US Presidential electionsas geopolitical tensions and event risks loom large.15 We forecast another global auto sales decline of 1.2 % y/y in 2020 to 74mn units.20Global Vehicle Salescontributionto % changeChinaAsia ex. ChinaEastern EuropeWestern EuropeSouth AmericaMexicoCanadaUSWorld1050-5Table 1 — International Motor Vehicle Sales Outlook (mns units)-102016201720182019e2020f18/19e% y/y19/20f% y/yTotal Sales77.779.678.975.074.1-4.9-1.2North AmericaCanadaUnited -1.4-7.7-0.5-0.4-0.4-2.1Chart 2Western 6-11.9-2.7-3.4-3.2753South 0.01.94.6702.5GermanyUnited KingdomEastern EuropeRussiaSources: Scotiabank Economics, W ard's Automotive Reports, Bloomberg.07091113151719Sources: Scotiabank Economics, Bloomberg,Wards Auto, DesRosiers Automotiv eConsultants Inc., GAC.Global Growth & Vehicle Salesy /y % changemn unitsglobal auto sales(LHS)global GDPgrowth (RHS)806543.521617181920fSources: Scotiabank Economics, Bloomberg,IMF, Wards Auto, DesRosiers Automotiv eConsultants Inc., GAC.*All numbers reported are not seasonally adjusted (nsa), unless otherwise indicated (sa).Visit our website at scotiabank.com/economics Follow us on Twitter at @ScotiaEconomics Contact us by email at scotia.economics@scotiabank.com1
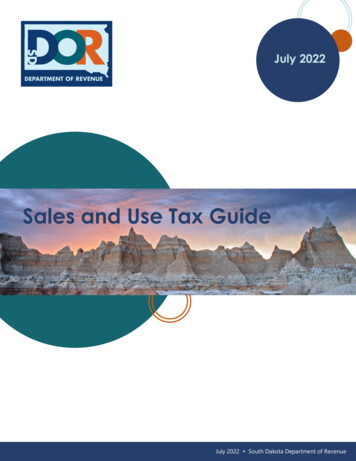
GLOBAL ECONOMICS GLOBAL AUTO REPORTFebruary 3, 2020A SYNCHRONIZED DOWNTURN IN GLOBAL AUTO SALESGlobal sales of light vehicles fell to 75 mn in 2019. The 4.9% y/y decline reflectsa synchronized slowdown in auto sales across nearly all regions in the world (chart 1).South Asian Pacific economies led the downturn with an 8.5% y/y decline (dominatedby China’s 9.5% y/y drop), followed by Eastern Europe (6.4 % y/y), South America(3.7 % y/y), and North America (2% y/y). Only Western Europe eked out a verymodest boost of 0.3% y/y (table 1). Unlike the last downturn in global auto sales in2008–09 when the global economy was in the midst of a recession, global auto saleshave weakened substantially despite positive, albeit slowing, global economic growth.The synchronization of sales declines across advanced and emerging economies hasamplified the dip.Global economic activity slowed in 2019. Global GDP growth for 2019 isestimated at 2.9 % following growth of 3.6% in 2018 (chart 2) with a substantialerosion of economic activity attributed to global uncertainty. Heightened tradetensions between the US and China had reverberating repercussions around theworld. Recessionary fears led global bond markets to seek safe haven assets givingrise to credit tightening and currency pressures in many emerging markets. A numberof markets also faced domestic instabilities.Weak global auto sales contributed to dampened economic activity in majorauto-producing countries. According to the IMF, the global auto sector’s grossoutput (i.e., its value added and intermediate consumption) was about 5.7% of globaloutput in 2018, while vehicle and vehicle parts represented about 8% of globalexports. Consequently, the IMF estimated that the 2018 decline in auto salessubtracted 0.04 percentage points from global growth relative to an overall 0.2percentage point decline in GDP in 2018. While production data is still pending for2019, the far more serious retrenchment in auto sales (almost a 5% decline in 2019versus 1% in 2018) would translate into a more substantial impact on global output in2019.Many central banks eased their monetary stance in response to waning growthin 2019. This included actions by central banks in the US, EU, and China.Absent this, global growth would have been even slower—by an estimated 0.5% ofGDP—according to the IMF. These policy actions take time to feed through to the realeconomy so some effects have yet to transpire. Risk-off sentiment for at least the firstthree quarters of the year may also have eroded some of the transmission into thereal economy in some emerging markets.We anticipate another decline in global auto sales to 74 mn units in 2020. Thislargely reflects another challenging sales year ahead for China which starts the yearalready facing a consumption shock with the coronavirus, while fading fiscal supportin the US will continue to dampen auto sales. European markets will confront moreregulatory headwinds, while other markets will face a ‘holding pattern’ as they awaitan abatement of global (and sometimes domestic) uncertainty before an anticipatedrecovery takes hold in 2021 for the most part.In the long run, there is still significant growth opportunity in emerging marketswhere per capita vehicle ownership is still very low (chart 3). However, the carthat will be driven by these future drivers will no doubt look much different than thosethat will be produced and sold in 2020.Chart 3Wealth Drives Auto OwnershipCANpassenger v ehiclesper 0CHLBRACHN100IDNIND0GDP per capita,CID thousandsCOLPER0204060*Latest comparable data from 2015.Sources: Scotiabank Economics, IMF, InternationalOrganization of Motor Vehicle Manufacturers.Chart 4Canadian Auto Sales FaceAnother Cyclical Downturnunit autosales, : Scotiabank Economics, DesRosiers AutomotiveConsultants Inc., Global Automakers of Canada.Chart 5US Auto Sales & GDP Diverging4y /y % changey /y % change31226100-1-2-6US real GDP, LHS-3-12-4-5Total US lightvehicle sales, RHS-6-18-2407 08 09 10 11 12 13 14 15 16 17 18 19Sources: Scotiabank Economics, BEA, IMF.Visit our website at scotiabank.com/economics Follow us on Twitter at @ScotiaEconomics Contact us by email at scotia.economics@scotiabank.com2
GLOBAL ECONOMICS GLOBAL AUTO REPORTFebruary 3, 2020CANADACanadian auto sales in 2019 disappointed with a 3.1% y/y decline. This marked asecond consecutive year of auto sales declines following the 2017 high that saw salessoar above 2 mn units with the Canadian economy firing on all cylinders (chart 4). Thecyclical slowdown in auto sales has been driven by affordability considerations, which inturn have been amplified through wealth and confidence channels. Canada has not yethit “peak car”, but a return to 2017 highs is not imminent. Meanwhile, auto sales areexpected to post another modest decline in 2020 to around 1.91 mn units. A morecomprehensive assessment of Canadian auto sales for 2019 can be found here.US AUTO SALESAmerican consumers purchased 17.0 mn light vehicles in 2019. This represents a1.4% y/y decline over 2018. US auto sales have been oscillating around the 17 mn markfor several years since the all-time peak of 17.5 mn units in 2016, but a downward trend isevident (chart 5). A cyclical downturn in fact began in 2016 as the Federal Reservestarted a rate tightening cycle that lasted through 2018. Unprecedented fiscal stimulus viathe 2017 Tax Cuts and Jobs Act temporarily boosted 2018 auto sales before fading again.As the positive output gap narrows with the withdrawal of this procyclical fiscal spending,auto sales can be expected to moderate further.Unprecedented trade uncertainty weighed on US output in 2019. ScotiabankEconomics estimates that trade tensions—notably between the US and China—led to anerosion of 0.4 ppts from US GDP levels over the course of the year. Businessinvestment and industrial production retracted sharply (chart 6), with real GDPconsequently contracting from 2.9% in 2018 to an estimated 2.3% in 2019. Waning fiscalstimulus also contributed to the slowdown.Chart 6Trade Policy UncertaintyKnocks US Manufacturing65value below 50indicatescontraction6014ISMManufacturingPMI (LHS)1210558506445Trade PolicyUncertaintyIndex (RHS)4020Sources: Scotiabank Economics, ISM,PolicyUncertainty.com.Chart 7High Quits Driving Higher Wagesy/y %change4.0% of totalunemployment3.54.03.53.03.0US Average HourlyEarnings (LHS)2.52.5The Federal Reserve began easing monetary policy in response. The Fedintroduced three consecutive rate cuts totalling 75 basis points between July andOctober. However, the average financing rate for new car loans still stood more than 40basis points (as of September, latest available data) above the 2018 average and morethan 1 1/4 ppts above the lowest quarterly rate in 2018 according to the Federal ReserveBoard. Policy rate cuts have yet to provide much tailwind to sales.2.02.0Consumer fundamentals remained relatively resilient in spite of a volatileenvironment. Private consumption has been a main driver of growth—growing at2.6% in 2019—supported by strong household balance sheets and robust labourmarkets. Wages continued to rise at rates near decade highs that are well aboveheadline inflation, driven up by relatively tight labour markets (chart 7). Household debtlevels as a share of disposable income were at the lowest in forty years last year, whilehousehold net worth as a share of disposable income continued to climb. Meanwhile,auto price inflation was softer than headline inflation, unlike many other countries thathave been importing auto price inflation through currency effects (chart 8).Chart 8The strike at General Motors introduced some volatility in sales but was not thefundamental driver in the 2019 decline. According to the company, the 40-day strikethat began in September resulted in an estimated 300,000 GM vehicles in lost productionincluding high-demand full-size SUVs and pickup trucks. GM’s US sales were down by14% y/y in October, they were flat in November, then saw another 6% y/y drop inDecember (a weak sales month for the industry). The supply shock was largely absorbedJob Quits,advanced 12months, SA, %(RHS)1.51.00709111315171.51.019Sources: Scotiabank Economics, BLS, Bloomberg.76Auto Price InflationBelow US Headliney/y % changeHeadline CPI543210-1-2-3Purchase ofnew vehicles-400 02 04 06 08 10 12 14 16 18Sources: Scotiabank Economics, BLS.Visit our website at scotiabank.com/economics Follow us on Twitter at @ScotiaEconomics Contact us by email at scotia.economics@scotiabank.com3
GLOBAL ECONOMICS GLOBAL AUTO REPORTFebruary 3, 2020by the market through a combination of inventory drawdown, purchase deferrals, and likely some brand-switching with minimal impacton annual sales in the US, though there may still be modest spillover to 2020 sales for General Motors.US auto sales will face another mediocre year in 2020. GDP is expected to slow once again to 1.7% this year. Our forecastsassume that the US-China Phase 1 agreement will provide a “truce” in the run-up to the US Presidential elections in November, butevent risk will remain high. American consumers will continue to demonstrate resilience, aided in part by easier financial conditionsas last year’s Fed cuts work their way into the real economy, but a drop in consumption from 2.6% in 2019 to 2.3% in 2020 isanticipated. This will likely translate into modestly lower auto sales. Furthermore, peak auto sales from 2015 and 2016 will startreturning to the used car market in 2020. We forecast sales of 16.9 mn units in 2020 representing a modest 0.4% y/y decline.MEXICAN AUTO SALES SUFFERED A PRONOUNCED DECLINE IN 2019Mexican auto sales dropped by 7.7% y/y in 2019 marking a third year of decline. Auto sales tallied only 1.32 mn units for2019, far short of the 2016 high when sales reached 1.6 mn units.Chart 9Economic growth stalled in 2019. Following real GDP growth of 2.1% in 2018,estimates indicate economic activity was flat for 2019 as the Mexican economy faced theMexico GDP and Auto Sales“perfect storm” (chart 9). Unprecedented global trade uncertainty—including the5y /y % changey /y % changeoutstanding ratification of USMCA—weakened growth through trade and business4Auto sales (RHS)channels, while confidence in the federal government’s policy agenda also waned over the3course of the year. In June, Fitch Ratings downgraded its sovereign debt rating forMexico, while Moody’s cut its outlook from stable to negative. Overly optimistic2assumptions in the fiscal plan, along with an unsustainable trajectory for the state-owned1oil company, PEMEX, suggest further spending cuts will be required to reach fiscaltargets. Meanwhile, chronic underinvestment in infrastructure has eroded growth potential, 0GDP (LHS)while high debt levels preclude any substantial fiscal support despite anaemic growth.-1Industrial (LHS)Serv ices (LHS)A modest, but still-weak recovery is anticipated in Mexico in 2020. Modest growth of -21.0% is forecast as negative shocks from last year are absorbed—largely on the externalForecast-312 13 14 15 16 17 18 19 20 21front related to trade uncertainty—but stronger growth will hinge on a significant increase inconsumer and business confidence. Domestic risks pose major downside to the outlookSources: Scotiabank Economics, INEGI.including security concerns in some regions, the sustainability of energy reform, andChart 10execution against fiscal targets as revenues decline. On the upside, inflation has beenVolatility in Mexican Autodeclining which opens the window for a policy rate cut early in the year. Nevertheless, firms12Price Inflationand households are expected to largely remain cautious with their spending. Ay /y % changesustainable strengthening of the peso could reverse some auto price inflation that had10risen above headline inflation over the course of last year. Needless to say, auto salesHeadline CPI8will continue to face headwinds in the interim. We expect that the decline in auto saleswill moderate with a 2% y/y contraction to 1.29 mn units in 2020.6A SYNCHRONIZED SLOWDOWN IN AUTO SALES ACROSS ASIA-PACIFIC2520151050-5-10-1542The sharper-than-anticipated decline in Chinese auto sales dominated headlines0through 2019 with sales down 9.5% y/y. Year-end sales of light vehicles totalling 21.4mn still make it the largest single auto market in the world. The pace of the descent let upAcquisition of-2automobilesmodestly in the final quarter of the year (with an average monthly decline around 1% y/y)-4versus an average monthly decline above 15% in the first three quarters of the year, in00 02 04 06 08 10 12 14 16 18part reflecting base effects as the decline began in the summer of 2018. Additionally, thereSources: Scotiabank Economics, INEGI.may have been some early-year purchase deferrals as consumers and market-observersalike expected the Chinese government to step in with purchase incentives to support the industry as it has done in the past. Mostrecently, the late-2015 sales tax cut sparked a 15% y/y jump in 2016 sales (chart 11). As 2019 advanced, it became evident that thegovernment was not going to step in to boost auto sales; in fact, it announced cuts to zero-emission vehicles in June that led to asharp contraction in that segment.Visit our website at scotiabank.com/economics Follow us on Twitter at @ScotiaEconomics Contact us by email at scotia.economics@scotiabank.com4
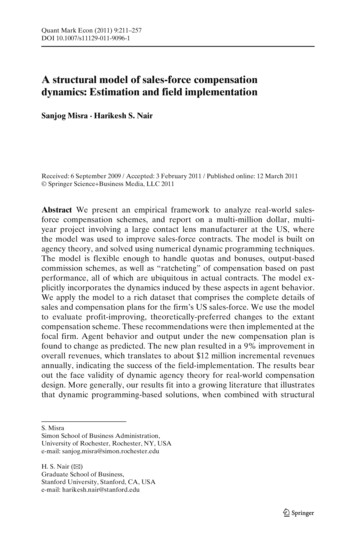
GLOBAL ECONOMICS GLOBAL AUTO REPORTFebruary 3, 2020Chart 11Chart 12Chinese Auto Sales Sensitive to Government Incentives30y /y % change. 3mma20sales tax cut from10% to 5% for1.6L or lowervehiclessales tax hikefrom 5% to 7.5%for 1.6L or lowervehiclesMonthly Chinese Auto RegistrationsDuring SARS Pandemic80y /y % change,NSA70605010403002010-100Engine capacity 1.6 LEngine capacity 1.6 L-20sales tax hike to10% for 1.6Lor lower vehicles-30111213-1014151617Sources: Scotiabank Economics, China Automotiv e Inf ormation Net.-200118190203Note: SARS outbreak period shaded.Sources: Scotiabank Economics, ChinaAutomotiv e Inf ormation Net.Slowing economic activity in China also weighed on 2019 auto sales. GDP declined from 6.6% in 2018 to an estimated 6.1%in 2019. The escalating tariff war with the US detracted from economic activity, as did the broader global slowdown, and theeconomy’s ongoing structural transition. A crack-down on shadow banking has also tightened credit conditions for auto financing.Chinese GDP growth is set to slow again in 2020, with the recent coronavirus outbreak putting risks firmly on thedownside for a potentially steeper slowdown. Prior to the coronavirus outbreak, forecasts for 2020 GDP hovered around6.0%. While it is early to predict the duration, magnitude or impact of this recent shock, first quarter growth will take a serious hit at aminimum, with a risk that this could bleed into the second quarter. Otherwise, the Phase 1 trade agreement with the US shouldtemporarily alleviate trade tensions. The government is expected to continue to support the economy with counter-cyclical fiscalpolicy that will complement more accommodative monetary conditions including a substantial injection of liquidity into marketsannounced this week as regional financial markets reopened after the Lunar holidays.In this context, we anticipate another decline in auto sales to 20.7 mn units in 2020 representing a 3.4% y/y drop. Thisreflects a more mature phase of the cyclical decline, but with some additional headwinds at least in the first quarter from thecoronavirus that will weigh on auto sales. While the phenomenal growth trajectory of Chinese auto sales in the early 2000s limitscomparisons of today’s coronavirus to the 2003 SARS pandemic with respect its potential impact on auto sales, a notable—butshort-lived—contraction in auto sales was observed at the peak of the 2003 outbreak. Needless to say, there is not likely a firmrecovery in sight for Chinese auto sales in 2020 absent direct government subsidies.Japanese auto sales ended the year on a low note with a 1.5% y/y decline attributed almost entirely to the final quarter. Theconsumption tax hike (from 8% to 10%) on October 1st skewed purchase patterns with an average monthly increase of 8% y/y inthe three months preceding the tax hike, followed by average declines of 16% y/y in the three months following. The decline in autosales comes in spite of a modest uptick in economic growth (albeit from a low 0.3% in 2018 to an estimated 0.9% in 2019). Weakglobal demand (including for global automobiles) against a backdrop of heightened trade tensions have weighed on Japan’sexternal sector, while the tax hike weakened domestic demand in 2019. The growth outlook for 2020 remains weak (forecast at0.6% of GDP) despite a number of tailwinds including the newly approved trade deal with the US, a new fiscal stimulus package(amounting to 2.4% of GDP) announced in December, and an accommodative monetary position. We anticipate a slightly steeperdecline in 2020 auto sales of around 2.8% to 5 mn units.Indian auto sales contracted sharply in 2019 with an 11.9% y/y decline with sales totalling 3.6 mn units. Indian auto saleshad benefited from a four-year run of strong growth averaging almost 8% y/y. A sharp deceleration in economic activity in 2019(from 7.4% in 2018 to an estimated 5.1% in 2019) contributed to the decline in auto sales. A combination of weak domestic demandand external sector challenges contributed to soft economic activity. For context, it is useful to recall that the last dip in Indian autosales occurred in 2013 (with a 7% y/y drop) as the economy swooned to 4.5% of GDP that year. A modest economic recovery in2020 is expected in the order of 6.2% of GDP, as policymakers implement shorter-term stimulus measures (including furtherVisit our website at scotiabank.com/economics Follow us on Twitter at @ScotiaEconomics Contact us by email at scotia.economics@scotiabank.com5
GLOBAL ECONOMICS GLOBAL AUTO REPORTFebruary 3, 2020monetary easing) and longer-term structural reforms. Nevertheless, weak confidence may hold back auto sales in 2020 until arecovery is firmly underway. We anticipate another decline, albeit more modest, of 3.2% in 2020 auto sales.All other major Asian-Pacific markets also saw auto sales declines in 2019. Notably, South Korean, Australian, andIndonesian auto sales were down by 9.1% y/y, 7.5% y/y, and 8.7% y/y respectively. These smaller markets made up about 10% ofregional auto sales in 2019.WESTERN EUROPEAN AUTO SALES CARRIED BY GERMANYWestern European auto sales were largely flat in 2019 with only a marginal 0.3% y/y uptick. Sales growth is slightlyhigher (at 0.9%) once the UK sales figures are excluded given the unique toll of Brexit uncertainty on its economy. The year’ssales figures mask some base effects as tighter emissions regulations introduced in the Fall of 2018 led to universally steepcontractions in sales across the continent in the latter part of 2018. However, solid economic activity in 2018 (1.9% of GDP for theEurozone) otherwise offset headwinds from the new regulations. GDP slowed substantially in 2019 to an estimated 1.0% as theglobal economy slowed, trade tensions persisted, and the Brexit saga continued. Like many other major economies, weakness fedthrough manufacturing and export channels. European consumers otherwise were relatively resilient through 2019 with retailspending witnessing sustained growth over the last few months of the year in the four largest economies along with solidconsumer confidence readings at year-end. This provided an offset to broader economic headwinds that—along with baseeffects—put auto sales in slightly positive territory for 2019 with total sales of 14.1 mn units in Western Europe.The economic outlook for the Eurozone appears to have stabilized, but will remain relatively weak in 2020. We forecastGDP growth of 1.1% with reduced trade tensions. The European Central Bank is expected to maintain its recent package ofexceptional monetary easing, but more emphasis is being placed on the greater use of fiscal stimulus among members with thespace in the year ahead. The auto sector will face additional headwinds in 2020 including a further tightening of emissionsregulations, along with the risk of re-ignited auto tariff threats from the US. In this context, we anticipate a modest decline in 2020auto sales for the region. We forecast total sales of 13.9 mn units for Western Europe, a 1.5% decline over 2019 levels.German auto sales posted a healthy boost of 5% y/y in 2019 after its slightly negative sales performance in 2018. Withannual light vehicle sales of 3.6 mn units in 2019, it represents about 25% of the regional market. Economic growth faced majorchallenges in 2019, in fact it teetered on the brink of a technical recession mid-year as plummeting trade and manufacturing activitystalled. A late-year deceleration in the pace of this decline, along with a modest rebound in exports, and—importantly for autosales—continued strength in household, spending means the German economy has avoided a recession but its estimated GDPgrowth for the year is meagre at around 0.5%. An economic recovery is expected in 2020 (with GDP growth of 1.1% estimated), butthe recovery largely reflects an improvement in business conditions whereas household consumption will hold steady.Consequently, with additional headwinds from tighter emissions regulations, we expect a modest sales decline of 1.6% in 2020.Brexit uncertainty continued to weigh on UK auto sales in 2019, posting a third year of decline. UK auto sales totalled 2.3 mnunits in 2019, a 2.4% y/y drop relative to 2018 sales. This follows sharper drops of almost 7% y/y and 6% y/y in years prior. Althoughthe December general election delivered a clear mandate to the Johnson Government to “get Brexit done”, related uncertainty is likelyto remain elevated in 2020 and beyond until a comprehensive UK-EU agreement is worked out. Economic activity is expected to bearound 1.2% in 2020 following last year’s estimated 1.1% growth. Needless to say, UK auto sales will face continued headwinds in2020 though we expect a deceleration in the decline as replacement pressures mount the longer the descent continues.The next two largest auto sales markets—France and Italy— also saw modest sales gains in 2019. French consumerspurchased 2.2 mn units in 2019, a 1.9% y/y increase, while Italy posted a marginal 0.2% y/y gain with 1.9 mn unit sales.Eastern European auto sales suffered a 6.4% y/y decline in 2019, dominated by deteriorating sales in Russia. Russianauto sales dropped by 2.3% following two years of double-digit growth. Russian auto sales represent over 40% of the EasternEuropean regional 3 mn unit market. This masked a 4.4% y/y increase in Polish auto sales, marking a seventh year of growth,averaging over 10% annually. Poland now represents the second largest auto market in Eastern Europe, having unseated Turkey,which experienced a serious 28% y/y contraction in 2019 auto sales. For the Eastern European market as a whole, we forecastmodest growth in the order of 1.4% largely based on a recovery in Russia as its economy picks up in 2020 by almost a fullpercentage point of GDP.Visit our website at scotiabank.com/economics Follow us on Twitter at @ScotiaEconomics Contact us by email at scotia.economics@scotiabank.com6
GLOBAL ECONOMICS GLOBAL AUTO REPORTFebruary 3, 2020DIVERGING FORTUNES ACROSS SOUTH AMERICAThe South American auto sales market shrank by 3.7% y/y in 2019 to 3.8 mn units. The steep declines in Argentina and Chilein light of domestic instabilities mask otherwise positive sales performance in Brazil, Colombia, and Peru.Brazilian auto sales grew for a third year in a row by 7.7% y/y in 2019. The continued strength in Brazilian auto salesreflects a recovering market versus a booming one. Total 2019 sales at 2.7 mn units still sit well-below the all-time high of 3.6 mnunits in 2012 and 2013 before bottoming out at 2.0 mn units in 2017. Economic activity slowed modestly from 1.3% of GDP in2018 to an estimated 1.1% in 2019. As a relatively closed economy, Brazil was somewhat buffered from global trade tensions,however a recession in neighbouring Argentina, a key export market for Brazil, weighed on growth. While businesses andconsumers entered 2019 on a cautious foot in light of uncertainty surrounding the new government’s policy agenda, activity pickedup across the board—including manufacturing activity, retail sales, and confidence levels—towards the end of the year as thegovernment set out on a pro-business policy agenda, made substantial progress on pension reform, and monetary policy remainedhighly accommodative. Growth is expected to pick up sizably to 2.1% in 2020, though further fiscal and structural reforms will beneeded while the depreciated Brazilian real represents a vulnerability. Auto sales should continue their recovery with ananticipated 12.5% growth in 2020 (in a market notable for high year-over-year sales volatility). This would in part reflect continuedreplacement demand pent up from the four-year decline between 2013 and 2016.Colombian auto sales picked up by a robust 4.6% y/y in 2019 on the heels of an 8.7% y/y increase in 2018. Total sales at260 k units in 2019 still sit below the 300 k peak in 2014, but a steady recovery has mirrored a growing economy. Colombia in factled Latin American peers with estimated GDP growth of 3.2% in 2019 following 2.6% growth in 2018. Strong foreign directinvestment has been fueled by relative political stability, regulatory reform, and infrastructure investment. Double-digit growth inretail sales and consumer loans has also boosted domestic consumption, aided in part by tax reform, accommodative monetarypolicy, and stable inflation. Migration flows from neighbouring Venezuela also contributed to demand. Protests in the Fall have putpressure on additional fiscal spending, but the fallout is largely considered to be contained as the government has demonstratedsome willingness towards concessions. Growth is expected to pickup to 3.6% in 2020, but with some key downside risks includinga potential deepening of social unrest, along with vulnerabilities related to its wide trade deficit and weak peso. Persistently highunemployment also creates headwinds for consumption though levels should come down modestly in 2020. Auto sales shouldcontinue to strengthen in 2020 but at a more moderate pace of 1.9%.Peruvian auto sales are another regional bright spot with 4.4% y/y growth albeit from low levels of around 150 k units in 2019.The growth in auto sales occurred despite a slowdown in economic growth from 4.0% of GDP in 2018 to an estimated 2.3% in 2019.Heightened domestic political uncertainty compounded global uncertainty as the President dissolved Congress last year, calling for newelections in early 2020. This took a toll on business confidence, though there are signs of political stabilization and resumption of b
Unlike the auto sales slowdown in 2008-09 when the 6.2% y/y sales decline was largely driven by advanced economies, the current . We forecast another global auto sales decline of 1.2 % y/y in 2020 to 74 mn units. *All numbers reported are not seasonally adjusted (nsa), unless otherwise indicated (sa).-10-5 0 5 10 15 20 07 09 11 13 15 17 19