Transcription
Internal MeasurementthroughInformed Visibility PRC Technical ConferenceSteve DearingManager, MailingInformation SystemsMarch 18, 20151
Agenda Informed Visibility OverviewExternal First-Class Mail OverviewInternal Measurement OverviewComparison of Current and Future States2
Informed Visibility (IV)3
Informed Visibility IV is an enterprise system that will be a real-time singlesource of mail and mail aggregate information.IV will leverage data to provide businessintelligence for USPS functional groupsand the mailing industry, providing: Mail Inventory Management of Mail andPackages Predictive Workloads on Mail and Packages End-to-End Tracking of Mail Event-Driven Internal Measurement of all Mail Real-Time Service Performance Diagnostics Ease of Use4
Value of Informed Visibilityfor Mail Processing Mail Inventory Management and Predictive Workloads Inbound, On-hand, and Ready to Process Inventory (volumes,location in process, mail make-up and service window) Inventory based Run Plans (resources needed, run start time,expected throughput, expected end of run) Real-Time Processing Status (throughput, cycle-time, mail at risk,service performance, and alerts) Outbound Inventory (maximizing transportation) IV will automatically create an optimized Run Plan for the day’sworkload, based on actual mail volume, allowing improvedutilization and efficiency IV’s forecasting capability will enable the planning of resourcesdays in advance5
Value of Informed Visibilityfor Transportation Real-time monitoring of inventory Alerts for missing containers at unload or load Arrival profile and Dispatch ready profile Real-time monitoring of transportation status and locations Real-time simplified data capture for mail aggregates(handling units, containers and transportation) IV will optimize transportation utilization by coordinatingschedules to align with dispatch ready volumes IV will provide alerting mechanisms for transportationvariances allowing operations to proactively adjust6
Value of Informed Visibilityfor Delivery Mail Inventory Management and Predictive Workloads Real-time Volume Arrival ProfileInbound, On-hand, and Out for Delivery Inventory by routeFacilitates Optimized Dynamic routing and workload balancingFacilitates automated volume recordingGenerates Carrier Manifest by route (accountables, trays,bundles, etc.) IV forecasting capability will enable the planning of resourcesin advance IV mail volume data for all routes can assist in replacement ofcurrent legacy systems7
ExistingExternal First-Class Mail (EXFC)Overview8
EXFC System Overview The External First-Class Mail measurement system (EXFC) is anexternal system maintained by a contracted third party vendor EXFC measures the transit time from deposit of mail into acollection box or lobby chute until its delivery to a home orbusiness for single-piece First-Class Mail letters/cards and flats EXFC uses test mail pieces designed to representcharacteristics and flow of single-piece First-Class Mail Roughly 1,200 independent contractors called “droppers”seed pieces into randomly selected collection boxes andnearly 14,000 “reporters” receive EXFC test mail and report thereceipt date The EXFC system covers 892 3-Digit ZIP Code areas9
EXFC System Overview The EXFC sample design for single-piece First-Class Mail isbased on destinating mail volume targets by district andservice standard Average mail volume calculated from 12 prior months ODISdata is used to determine the origin-destination EXFC testpieces The minimum destinating mail volume targets for most districtsare currently Two-Day – 3,735 pieces Three-To-Five-Day – 4,185 pieces In FY15 Q2 approximately 580,000 pieces will be used for EXFCreporting (out of the 6 Billion single-piece FCM pieces)10
EXFC System Overview Service performance scores are determined by theextrapolation of the EXFC test/sample pieces Scores are calculated as weighted averages where each testpiece is weighted by ODIS volumes to represent the populationof single-piece First-Class Mail Margins of error for performance estimates are based on a 95%confidence interval National level error margins for FY15 Q1 quarterly score were /- 0.13% for Two-Day /- 0.21% for Three-To-Five-Day Margins of error vary more greatly at the Area and Districtlevels for origin/destination composite scoresFY15 Q1 PrecisionTwo-DayThree-To-Five-DayArea Average /- Range0.32%0.38%Area Maximum /- Range0.43%0.46%District Average /- Range0.81%1.09%District Maximum /- Range1.59%2.28%11
Internal MeasurementOverview12
Value of Informed Visibilityfor Service Performance Measurement End-to-End Measurement One Consolidated Mail Measurement System (single-piece andpresort) Measuring Nearly All Mail Event-driven Service Scores IV leverages Mail Visibility providing a more comprehensiveview of USPS service performance measurement13
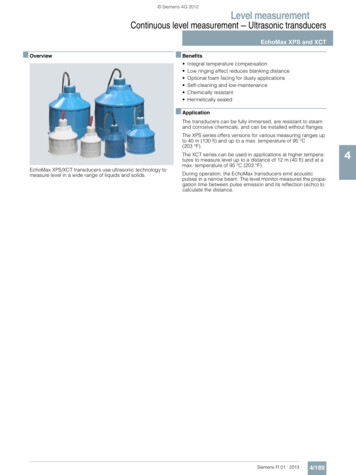
Internal Service Performance MeasurementFIRST MILEP&DCPROCESSING(SAMPLING)LAST MILE(SAMPLING)MPE Scan rates in the high 90sMPEMDD*ExistingIV*EncryptedSamplingRequest(GPS based)Not scanningevery piecewith MDDEncryptedSamplingRequest(GPS based)System polls 3-digit combos to ensurestatistical precision.14
Internal SPM –First Mile for Single-PieceTwo Stage Approach1. Scans of the collection box will be used to estimate the percent of mailcollected on time. Boxes collected at or after the last pickup time for the day will have 100% of theestimated density counted as on-time collection.Boxes collected before the last pickup time will have a portion, x, of the estimateddensity counted as collected on time and 100-x counted as missed collection.If no scheduled collection is made, 100% of the estimated density would becounted as missed collection.2. Carrier scans of mail pieces at randomly selected collection points will beused to determine the profile of mail from collection to first processingoperation. Carriers will scan barcodes (IBI and IMb).The barcodes will be matched with scan data in IV to determine the first milefactor.15
Internal SPM –First Mile for Single-Piece Collection Point Management System (CPMS) data CPMS data store has all collection box locations, to include: Unique CPMS barcode Pickup Times USPS is capturing latitude and longitude for each collection box. USPS will compare CPMS scan location to collection box location,to validate scan integrity.16
Internal SPM –First Mile for Single-Piece The estimates for collection timeliness and time from collection to firstprocessing operation will be combined with collection box density data tocalculate the first mile profile for each origin plant, representing thepercentage of mail spending x days in first mile by first processing operationtype:First Mile Profile for Single-Piece FCM Letters/CardsOriginPlantFPO TypePlant 1Days in First Mile0 Days1 Day2 Days3 DaysType 1xx.xx%xx.xx%xx.xx%xx.xx%Plant 1Type 2xx.xx%xx.xx%xx.xx%xx.xx%Plant 1Type 3xx.xx%xx.xx%xx.xx%xx.xx%17
Internal SPM –First Mile for Single-PieceHow challenging will it be to locate barcoded pieces at collection points? A study conducted in May 2012 in Northern Virginia yielded these results 92% of collection boxes contained at least one piece with IMb; 75% ofboxes contained more than three pieces with IMb Of boxes sampled, the average total pieces per box was 25, withapproximately 30% of pieces having an IMb18
Internal SPM –Processing Duration Processing Duration Profiles for single-piece FCM letters/cards and single-pieceFCM flats measured through MPE scans will be developed to estimate transittime from first processing operation through final automated processingoperationProcessing Duration Profile – Single-Piece FCM Letters/CardsOriginPlantDestination3-Digit ZIPServiceStandardFPOTypeLPOTypeMail Volume with Processing Duration1 Day2 Days3 DaysX DaysPlant 1006211nnnnnnnnnnnnPlant 1006221nnnnnnnnnnnnPlant 1006231nnnnnnnnnnnnPlant 1006212nnnnnnnnnnnnPlant 1006222nnnnnnnnnnnnPlant 1006232nnnnnnnnnnnn19
Internal SPM –Last Mile Every delivery day, delivery points will be randomly selected within eachdistrict by 3-digit ZIP Code, in proportion to the delivery points in the district. Carriers will be prompted to scan the barcode on mail pieces for the deliverypoint when he/she is within close proximity to the delivery point. The barcodes will be matched with scan data in IV to determine a last milefactor. The transit time between the anticipated delivery date based on finalprocessing operation and actual delivery will be calculated for each piece todevelop last mile profiles for the destination 3-Digit ZIP Code.Last Mile Profile for Single-Piece FCM Letters/CardsDestination3-Digit ZIPCodeLPO TypeDays in Last Mile-1 Days0 Days1 Day2 DaysX Days006Type 1xx.xx%xx.xx%xx.xx%xx.xx%xx.xx%006Type 2xx.xx%xx.xx%xx.xx%xx.xx%xx.xx%006Type 3xx.xx%xx.xx%xx.xx%xx.xx%xx.xx%20
Internal SPM –Overall Score Calculations To calculate the overall transit time for Single-Piece FCM, First Mile, ProcessingDuration and Last Mile profiles will be combined together, using the followingapproach: Take all combinations of First Mile and Processing Duration for the origin plant and firstprocessing operation type by multiplying the First Mile percentage estimates by themail volumes, and adding together days in First Mile and Processing Duration time foreach combination Next, match the results with the Last Mile profile by destination 3-Digit ZIP Code andlast processing operation type in the same manner to compute the volume of mailestimated to have total transit days as represented by:Total Transit Days Days in First Mile Processing Duration Days in Last Mile The On Time Performance score is the total estimated volume of mail with TotalTransit Days less than or equal to the service standard divided by the totalmeasured pieces The calculation methodology assumes that transit time in First Mile, ProcessingDuration, and Last Mile are independent.21
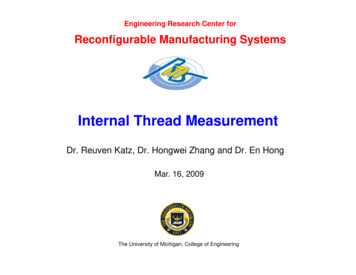
BARCODE EXAMPLESFIRST MILEP&DCPROCESSINGLAST MILEMPE Scan rates in the high 90sMPEMPEMPEMDDMDD263,386 MDD devices are expected to be deployed by end of FY15IMbIBIIMbIMbIBIFICS ID TagID TagIMpbLEGACYEXTRA SERVICELEGACYEXTRA SERVICEFICS ID TagIMpbLEGACYEXTRA SERVICE22
Comparison ofCurrent and Future States23
Comparison of Current and Future StateFirst-Class Mail – Single-PieceLettersFlatsParcelsStart:Acceptance ScanCurrent StateEXFCEXFCFirst Mile:CPMS Scan and CarrierScan of SampleMailpieces from RandomlySelected Collection PointsFuture StateStop:USPS Tracking deliveryscanStart:Acceptance ScanFirst Mile:CPMS Scan and CarrierScan of SampleMailpieces from Randomly Stop:Selected Collection Points USPS Tracking deliveryscanProcessing Duration:Processing Duration:First processing scan to last First processing scan to lastprocessing scanprocessing scanLast Mile:Carrier Scan of Mailpiecesfrom Randomly SelectedDelivery PointsLast Mile:Carrier Scan of Mailpiecesfrom Randomly SelectedDelivery Points24
Comparison of Current and Future StateFirst-Class Mail – PresortLettersCurrent StateFuture StateFlatsStart:Documented Arrival Timeat Postal facilityStart:Documented Arrival Timeat Postal facilityStop:External ReportingProcessing Duration:Start-the-Clock to lastprocessing scanStop:External ReportingProcessing Duration:Start-the-Clock to lastprocessing scanLast Mile:Carrier Scan of Mailpiecesfrom Randomly SelectedDelivery PointsLast Mile:Carrier Scan of Mailpiecesfrom Randomly SelectedDelivery PointsParcelsN/AN/A25
Comparison of Current and Future StateFirst-Class Mail – Single-Piece InternationalLettersCurrent StateFuture StateFlatsParcelsIMMSEXFC as proxySingle-Piece First-Class Mailparcels as proxy forInbound InternationalSame as Current StateSame as Current StateSame as Current State26
Comparison of Current and Future StatePeriodicalsLettersCurrent StateFuture StateFlatsStart:Documented Arrival Timeat Postal facilityStart:Documented Arrival Timeat Postal facilityStop:External ReportingProcessing Duration:Start-the-Clock to lastprocessing scanStop:External ReportingProcessingDuration: Start-the-Clockto last processing scanLast Mile:Carrier Scan of Mailpiecesfrom Randomly SelectedDelivery PointsLast Mile:Carrier Scan of Mailpiecesfrom Randomly SelectedDelivery PointsParcelsN/AN/A27
Comparison of Current and Future StateStandard MailCurrent StateFuture StateLettersFlatsAutomation:Start: Documented ArrivalTime at Postal facilityStop: External ReportingAutomation:Start: Documented ArrivalTime at Postal facilityStop: External ReportingNon-automation:Start-the-Clock: Wallbarcode scanStop-the-Clock: Wallbarcode scanAutomation:Processing Duration: Startthe-Clock to lastprocessing scanLast Mile: Carrier Scan ofMailpieces from RandomlySelected Delivery PointsNon-automation:Start-the-Clock: Wallbarcode scanStop-the-Clock: Wallbarcode scanAutomation:Processing Duration: Startthe-Clock to lastprocessing scanLast Mile: Carrier Scan ofMailpieces from RandomlySelected Delivery PointsNon-automation:Start-the-Clock: Wallbarcode scanStop-the-Clock: Wallbarcode scanNon-automation:Start-the-Clock: Wallbarcode scanStop-the-Clock: Wallbarcode scanParcelsStart:Documented Arrival Timeat Postal facilityStop:USPS Tracking deliveryscanStart:Documented Arrival Timeat Postal facilityStop:Wall barcode scanLast Mile: Carrier Scan ofMailpieces from RandomlySelected Delivery Points28
Comparison of Current and Future StatePackage Services – Single-PieceLettersFlatsParcelsStart:Acceptance ScanCurrent StateN/AN/AFuture StateN/AN/AStop:USPS Tracking deliveryscanSame as Current State29
Comparison of Current and Future StatePackage Services – PresortLettersCurrent StateN/AFlatsStart:Documented Arrival Timeat Postal facilityStart:Documented Arrival Timeat Postal facilityStop:External ReportingStop:USPS Tracking deliveryscanProcessing Duration:Start-the-Clock to lastprocessing scanFuture StateN/AParcelsLast Mile:Carrier Scan of Mailpiecesfrom Randomly SelectedDelivery PointsSame as Current State30
USPS will compare CPMS scan location to collection box location, to validate scan integrity. . district by 3-digit ZIP Code, in proportion to the delivery points in the district. Carriers will be prompted to