Transcription
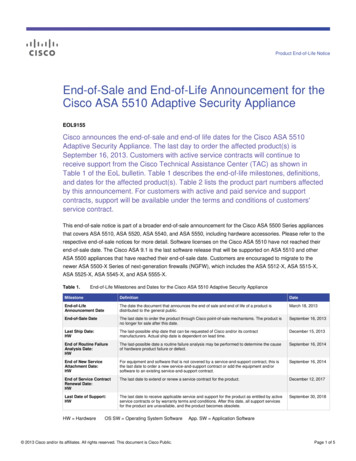
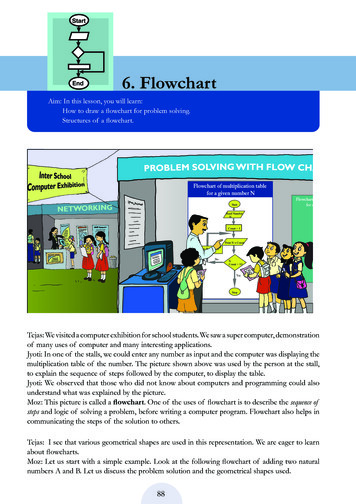
StartEnd6. FlowchartAim: In this lesson, you will learn:How to draw a flowchart for problem solving.Structures of a flowchart.Flowchart of multiplication tablefor a given number NStartNETWORKINGFlowchartfor aRead NumberNCount 1Print N x CountAdd 1 to the currentvalue of countNoIsCount 10YesStopTejas: We visited a computer exhibition for school students. We saw a super computer, demonstrationof many uses of computer and many interesting applications.Jyoti: In one of the stalls, we could enter any number as input and the computer was displaying themultiplication table of the number. The picture shown above was used by the person at the stall,to explain the sequence of steps followed by the computer, to display the table.Jyoti: We observed that those who did not know about computers and programming could alsounderstand what was explained by the picture.Moz: This picture is called a flowchart. One of the uses of flowchart is to describe the sequence ofsteps and logic of solving a problem, before writing a computer program. Flowchart also helps incommunicating the steps of the solution to others.Tejas: I see that various geometrical shapes are used in this representation. We are eager to learnabout flowcharts.Moz: Let us start with a simple example. Look at the following flowchart of adding two naturalnumbers A and B. Let us discuss the problem solution and the geometrical shapes used.88
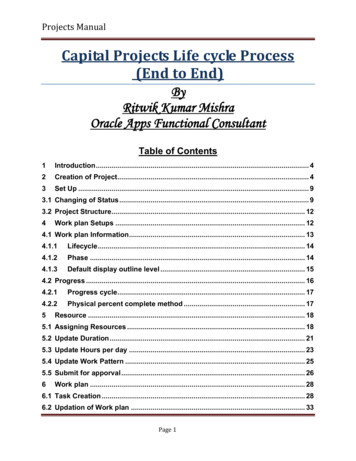
Flowchart - How to find sum of two numbersFinding sum of 845 and 247StartStartRead AA 845Read BB 247Sum A BPrint SumEndSum 845 247Sum 1092EndJyoti: Start and also end of the flowchart are shown with an ellipse.Moz: A flowchart should give a clear indication as to where the problem solving flow starts andwhere it ends. The start of a problem solving process and the end are indicated using the ellipse.Tejas: Our goal is addition of two given numbers. So, first we identify the data that is given.In this problem we have the two numbers A and B. Reading the values are represented byparallelograms.Moz: Right. What would you call reading in values in computer terms?Jyoti: Input.Moz: The data or information that is available, (which is called input) is represented using a parallelogramin the flowchart.Moz: What is the next step?Tejas: The next step is to add the numbers, which is called processing in computer terms. Welearned this term in “Inside computer” lesson. The details of processing of data is represented in arectangle.Moz: Correct.Jyoti: The next step is to write the result of the addition, which is output in computer terms. Thisis also specified in a parallelogram.Moz: Right. A parallelogram is used to specify both input and output in a flowchart. What else doyou notice in the flowchart?Tejas: An arrow points from one step to the next step in the flowchart.Moz: In a flowchart arrows are used to connect the steps in a sequence and show the flow of theproblem solving process.Jyoti: We learnt step by step thinking to solve a problem in Level III. Using flowcharts we can showthe sequence of these steps.Moz: Yes. The step by step method of solving the problem is specified using a flowchart. Thishelps you to be clear about the input, procedure and output. It also helps you to communicate thesolution.89
GuidelinesConceptFlowchartWhat is a flowchart? A flowchart is a picture (graphical representation) of the problemsolving process. A flowchart gives a step-by-step procedure for solution of aproblem.Elements of a flowchart: Various geometrical shaped boxes represent the steps of thesolution. The boxes are connected by directional arrows to show theflow of the solution.Uses of a flowchart: To specify the method of solving a problem. To plan the sequence of a computer program. Communicate ideas, solutions.Drawing a flowchart Identify input and output. Apply reasoning skills to solve the problem. Draw the flowchart using the appropriate symbols and arrows to show thesequence of steps in solving the problem.Moz: Now consider the following problem and draw the flowchart for its solution.Savani bought a toy for Rs. 325 and sold the same for Rs. 458. Explain how we can find ifSavani has made a profit or a loss.Tejas: In this problem the goal is to find whether Savani makes a profit or loss.Jyoti: We know the Cost Price and the Selling Price. We can read them as input, so they arerepresented as parallelograms.Read Cost price (CP)Read Selling price (SP)Moz: You can also put both cost price and selling price in a single parallelogram.Read Cost price (CP)Read Selling price (SP)Tejas: Next we have to compare Selling Price and Cost Price to find which price is more. This willtell us whether Savani has made profit or loss. How do we show comparison in a flowchart?Moz: Can you phrase this step as a question with the two possible answers?Tejas: We can ask a question “Is selling price more than cost price?”Moz: Right. The answer to this question can be “Yes” or “No”. If, answer is “Yes” we have tocalculate profit. If, answer is “no” we have to calculate loss. This decision taking step is representedas a diamond in a flowchart.Question?YesNoNext Step to be takenwhen the answer is No.90Next Step to be takenwhen the answer is Yes.
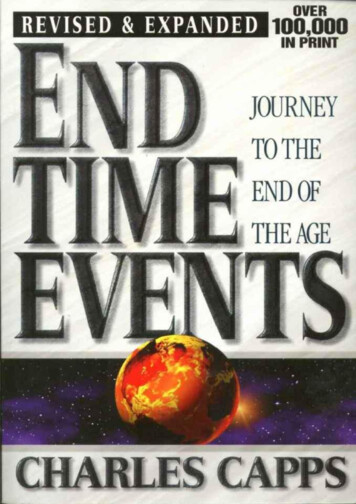
Jyoti: If the answer is “Yes”, it means that selling price is more than the cost price and Savani hasmade profit. Profit is calculated as Selling price – Cost price.IsSP CP ?YesProfit SP - CPNoTejas: If the answer is “No”, it means that cost price is less than selling price and Savani has madeloss. Loss is calculated as Cost price – Selling price.IsYesSP CP ?Profit SP - CPNoLoss CP - SPMoz: Good. You have used logical reasoning to solve this problem. Now complete the flowchart.Flowchart - How to find profit or loss.Finding profit or loss whenCP 325 and SP 458This is a sequence.StartRead Cost price (CP)Read Selling price (SP)IsSP CP ?YesStartThis is adecisionstructure.Read CP 325Read SP 458Condition: YesProfit 458-325Is 458 325?Profit SP - CPNoProfit Rs. 133Loss CP - SPPrint LossEndPrint ProfitEnd91
Flowchart symbols and their purposeFlowchart symbols Geometric ArrowsPurposeEllipse is used to indicate the start and end of a flowchart.Start written in the ellipse indicates the beginning ofa flowchart. End or Stop or Exit written in the ellipseindicates the end of the flowchart.A parallelogram is used to read data (input) or to printdata (output).A rectangle is used to show the processing that takes placein the flowchart.A diamond with two branches is used to show the decisionmaking step in a flowchart. A question is specified in thediamond. The next step in the sequence is based on theanswer to the question which is “Yes” or “No”.Arrows are used to connect the steps in a flowchart, toshow the flow or sequence of the problem solving processMoz: Suppose you have to write a Scratch program using the flowchart that you have just drawn.Can you do it now?Tejas: Yes. We can!Jyoti: This is great. We can also plan a computer program using flowcharts.Jyoti: Sometimes we need to repeat a sequence. How do we represent this in the flowchart?Moz: Let us consider the multiplication table flowchart that you saw at the exhibition. See howrepetition is represented in a flowchart. This is also called a loop.Flowchart of multiplication table for a given number NMultiplication table of 12Arrow connectsto the start ofthe sequence tobe repeatedStartStartRead number NCount 1N 12This is a loop.Start of thesequence tobe repeated.Multiple N x CountPrint counttimes N MultipleAdd 1 tothe currentvalue of countNoIsCount 10Count 112 * 1 12Count 1 1 212 * 2 24Count 2 1 3.Count 9 1 1012 * 10 120Count 10YesEndEnd92
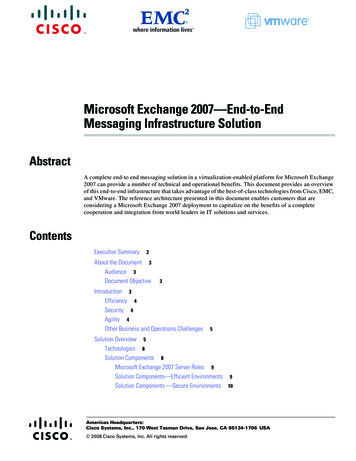
Jyoti: The repetition sequence starts with Count 1. N is multiplied with 1 and output is printed.Next since count is not equal to 10 we add 1 to count. N is multiplied with 2 and output is printed.The sequence is repeated next for 3, 4 and so on.Tejas: The repetition sequence stops when Count 10.Moz: Correct. A decision structure has been used to start and stop the repetition.Jyoti: In this flowchart output is not coming at the end and there are multiple outputs.Moz: Good observation. The output need not always come at the end of a flowchart. Similarly insome flowcharts input need not always be at the beginning of the flowchart.Moz: Try out another problem how do you find the factorial of a number?Jyoti: Suppose the number is 10. Then factorial of ten is calculated as10! 1*2*3*4*5*6*7*8*9*10Moz: Can you draw the flowchart for finding factorial of any given number?Jyoti: Yes. We can. We have to use both decision and loop in this flowchart.Find factorial of a given number NFinding factorial of 10StartStartRead NN 10Set M 1Set F 1M 1F 1Add 1 to thecurrent value of MF 1 * 1 1; M 10; M 1 1 2F 1 * 2 2; M 10; M 2 1 3F 2 * 3 6; M 10; M 3 1 4F 6 * 4 24; M 10; M 4 1 5New value of F Current valueof F multiplied by MNo.M 10; M 9 1 10F 362880 * 10 3628800; M 10IsM N?YesPrint FFactorial of 10 3628800EndEndMoz: Explain the logic that is used in the loop and specifically the following processing box ofthe flowchart.New value of F current valueof F multiplied by M93
Jyoti: N is the number for which we have to find the factorial.At the start of the loopWe start with F 1 and M 1.Since we have to start with 1 multiplied by 2 we add 1 to M.Current value of F which is equal to 1 is multiplied by 2.The result of this multiplication is equal to 2.Since M is less than N we enter the loop again with current value of F 2.Next we add 1 to M which becomes 3.Current value of F which is equal to 2 is multiplied by 3.The result of this multiplication is equal to 6.Since M is less than N we enter the loop again with current value of F 6.Moz: Good. Now let us consider a game. Do you know the game of snakes and ladders?Tejas: Yes.Moz: Ok. Draw a flowchart to show how the game is played.Tejas and Jyoti draw this flowchart.Flowchart - Snakes and Ladder gameStartGive dice tonext playerStartThrow the dice: the number indicated bydice is 3.Move the coin: through 3 blocks on theboard.Landed on snake head?: No.Landed on the bottom of the ladder?: Yes(See the snakes and ladders board given).Move up the ladder: reached block 14 onthe board.Reached the last block of the game?: No.Give dice to next player.Enter the loop till the last block of thegame is reached.EndThrow the diceMove the coinLanded onsnake head?Yes Slide down to thetail of the snakeNoLandedYeson the bottom ofthe ladder?Move upthe ladderNoReachedthe last blockof the game?Playing snakes and ladders betweentwo playersNoYesYou are the winnerEnd94
Uses of flowchart:Graphical representation of instructions- for example games, building models etc.Tejas: The flowchart itself can be put into the box of the game so that those who want to playknow the rules of the game and can easily understand how they win.Moz: We have seen some examples where flowcharts are used. There are many more uses offlowcharts and they can be used whenever you feel that you can communicate better with thisgraphical representation.InfoOther uses of flowchart Communicating ideas. Show the logic of classification of data. To teach and also to learn.Tejas: We are eager to learn another programming language.Moz: Sure. Next you will be learning BASIC where you can use some of the flowcharts that youhave drawn in this lesson. Chin son OutcomeAt the end of this lesson, you willbe able to: List some uses of flowchart. List the steps to be followedwhile drawing a flow chart andapply it to draw a flow chart. Recognise various structureslike sequence, selection andrepetition in a flowchart.
Level VIWORKSHEETSLesson 61. Which is not true about the arrows used in a flowchart?i. Direction of arrow shows the flow in a flowchart.ii. Arrows are used show the sequence of the problem solving.iii. Arrows are used to connect boxes in a flowchart.iv. Arrows can be used to represent an input.2. Match the elements of a flowchart and their purpose of use in the following:PurposeCalculate total of A, B, CIndicate that the problem has been solved.Find if a number is greater than the otherRead a number and calculate the factorial of the number.Read three numbersPrint the totalIndicate beginning of a problem solving flow.UseLoopStartProcessInputStopDecisionOutput3. Complete the crossword puzzle.12345Across1. I am a rectangle in a flowchart. What do I represent?.2. When you want to show a decision making step, you can use this box.4. You can use me to communicate ideas, graphically represent a problem solving process.5. I connect two geometrical boxes in a flowchart.Down1. In the flowchart, I represent data or information that is available.3. All flowcharts begin with me. I am elliptical in shape.96
Level VILesson 6WORKSHEETS4. The following flowchart classifies animals as herbivore or carnivore. Lion is a meat eatinganimal. Elephants eat only plants. Study the flowchart and answer the questions.StartRead the nameof the animal.Does it eatonly plants?NoYesPrint Herbivore.Print Carnivore.Enda. Indicate each element of the flowchart by putting ‘I’ for input, ‘O’ for output, ‘D’ for decision inthe circles provided next to the boxes.b. Put a rectangle around the decision structure.Hint: See page . in the lesson. (Page no to be put)c. What is the condition which classifies an animal as carnivore?d. Write the Execution steps if the input is a Lion.e. What is the condition which classifies an animal as herbivore?f. Write the execution steps if the input is an elephant.97
Level VILesson 6WORKSHEETS5. A, B, C are the marks scored by a student in Science, Mathematics and English. Refer theflowchart and answer the questions.a.a. Sweta, who scores 60 marks in Science, 70 marksin mathematics and 75 marks in English. Use theadjacent flowchart and provide the execution stepsin calculating the average marks of Sweta. The firststep is given.StartRead A, B, C60, 70, 75Sum A B CAverage Sum/3Print Averageb. A student whose average marks is above 75 is awardeda star. Fill in the following phrases in the flowchartfor finding if a student gets a star or not.YesNoAward a starDo better to get a starIs average greater than 75b.Endc. Is Sweta awarded a star? Yes or No?Ans:d. Marks of two more students are given below. Study it and fill in the blanks with the average marks ofeach student and whether the student is awarded a star or not.RiyaSumanScience7572i. Riya’s average isii. Suman’s average isMathematics8070English7282. So she is. So she isa star.a star.98
Level VILesson 6WORKSHEETSe. The three main steps in the given flowchart are:i.Read marks of three students.ii.iii.6. The following empty flowchart gives the steps to be followed while seeking admission tonew school. The phrases to be filled in the boxes are also given. Complete the flowchart byfilling in the number of the correponding phrase, inside each box. For example: the numbercorresponding to the first box in the flowchart is 7.71. Search for a school2. Prepare for the admission test andNo3.4.5.6.7.8.YesNoYesNoYes99write the test.Did you pass the exam?Submit necessary documents andget admission.EndAre seats available?StartIs there an admission test?
Level VILesson 6WORKSHEETS7. The following flowchart gives the steps followed while taking attendance in a class. Threearrows and a loop are missing. Complete the flowchart as follows: Draw the three missing arrows and loop at the correct place. Label the decision arrows with yes or no.StartCall out nameDid you hearpresent?Mark absent inthe registerMark present inthe registerIs it thelast name?End8. Frame a question. Hint: Try to make a question, which will have the answer given below.For example: The answer given is:Some of the boxes of different shapes used in a flowchart areThe question can be:Draw some of the symbols used in a flowchart?Now frame a question for each of the answers given below:a. The answer given is: In a flowchart, we use a rectangular box to represent a process .The question can be:b. The answer given is : In a repetition structure, the process is repeated till the condition is satisfied.The question can be:c. The answer given is : The decision structure has two branches, Yes or No.The question can be:100
Level VILesson 6WORKSHEETS9. There are four types of fruits Apples, Oranges, Bananas and Grapes. Each student can pickup two fruits. There are some conditions which have to be used to pick up the fruits. Draw aflow chart which can take the name of first fruit as an input and print the names of secondfruit or fruits that can be picked up. The conditions are: If you pick an apple you can pick banana. If you pick orange you can pick grapes. If you pick grapes you can pick banana.Hint: There will be one input box to read the firstfruit, three decision boxes and four output boxes in theflowchart.101
Level VIWORKSHEETSLesson 610. Lengths of three sides of a triangle a, b, c are given as input. The following flowchart findsif the triangle is isosceles, equilateral, or scalene. Some boxes in the flowchart are filled in foryou, fill in the rest of the details.Hint: In an equilateral triangle three sides are equal.In an isosceles triangle two sides are equal.In a scalene triangle three sides are not equal.StartRead side A, B & CIs A B ?YesNoIs B C ?NoPrint“Scalene Triangle”Ends5 cm5 cmsa. Use the above flowchart and provide the execution steps in finding whetherthe given triangle with sides 5 cms, 5 cms and 3 cms is scalene or isoscelesor equilateral triangle.3 cms102
ACTIVITYLevel VILesson 61. Select one of the games given below from GCompris and draw a flowchart to explain the rules of thegame. Memory games with images Image name (drag and drop each item above its name) Numbers with dice2. Use one of the following applications- open office draw or Kivio (available for Linux) or Diagram Ring(available for Windows)- to draw a flow chart for the above using the computer.Group Activity3. Play Computer Class:Divide the class into four teams- INPUT DATA, OPERATIONS, DECISION,and OUTPUT. Nominate one person from input and output team to play the roleof start and end box respectively. Each group has a set task to perform based oninstructions given to them by another team.For example: Let the situation be to purchase a birthdayfor your friend.StartYou are invited by friendto a birthday partyVisit a gift shopand select a giftIs the gift chosenwithin your budget?YesPurchase the giftEnd103
ACTIVITYLevel VILesson 6You can give one the following situations for students to work through the process of flow chart.i. A wired telephone in your house rings and you have to attend the call.ii. You visit a pediatrician for check up.iii. You go to a post office with a note of Rupees 10 to purchase stamps worth Rupees 5.Project4. a. Input, output and decision phrases are given in the table given below. Note that one input phrase correspondsto one flowchart. Draw three flow charts using the phrases in the table for the following:i. A flowchart which conveys the rules in AWARE.ii. A flowchart which conveys Accept rule of SMART.iii. A flowchart which conveys Meet rule of SMART.Input phrasesAn image to be used inpresentation.Decision phrasesIs permission given to use image?Is it from a resource with Creativecommons (CC)?Is the image copyrighted?Is the mail from a friend?Is it marked SPAM in Subject of mail?New Email in inboxOnline request to meetb.c.Is the Meet request from friend?Output phrasesTake permission.Acknowledge use of image.Do not use the image.Delete mail.Might have virus. Do not open.Read the mailMeet the person.Meet in the presence of anadult family member.There are three more rules of SMART which are Safety, R
steps and logic of solving a problem, before writing a computer program. Flowchart also helps in communicating the steps of the solution to others. Tejas: I see that various geometrical shapes are used in this representation. We are eager to learn a