Transcription
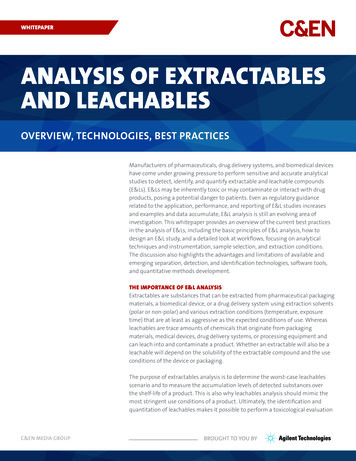
WHITEPAPERANALYSIS OF EXTRACTABLESAND LEACHABLESOVERVIEW, TECHNOLOGIES, BEST PRACTICESManufacturers of pharmaceuticals, drug delivery systems, and biomedical deviceshave come under growing pressure to perform sensitive and accurate analyticalstudies to detect, identify, and quantify extractable and leachable compounds(E&Ls). E&Ls may be inherently toxic or may contaminate or interact with drugproducts, posing a potential danger to patients. Even as regulatory guidancerelated to the application, performance, and reporting of E&L studies increasesand examples and data accumulate, E&L analysis is still an evolving area ofinvestigation. This whitepaper provides an overview of the current best practicesin the analysis of E&Ls, including the basic principles of E&L analysis, how todesign an E&L study, and a detailed look at workflows, focusing on analyticaltechniques and instrumentation, sample selection, and extraction conditions.The discussion also highlights the advantages and limitations of available andemerging separation, detection, and identification technologies, software tools,and quantitative methods development.THE IMPORTANCE OF E&L ANALYSISExtractables are substances that can be extracted from pharmaceutical packagingmaterials, a biomedical device, or a drug delivery system using extraction solvents(polar or non-polar) and various extraction conditions (temperature, exposuretime) that are at least as aggressive as the expected conditions of use. Whereasleachables are trace amounts of chemicals that originate from packagingmaterials, medical devices, drug delivery systems, or processing equipment andcan leach into and contaminate a product. Whether an extractable will also be aleachable will depend on the solubility of the extractable compound and the useconditions of the device or packaging.The purpose of extractables analysis is to determine the worst-case leachablesscenario and to measure the accumulation levels of detected substances overthe shelf-life of a product. This is also why leachables analysis should mimic themost stringent use conditions of a product. Ultimately, the identification andquantitation of leachables makes it possible to perform a toxicological evaluationC&EN MEDIA GROUPBROUGHT TO YOU BY
2and determine product safety. A typical E&L analysis might reveal commonplastics additives such as antioxidants, surfactants, slip agents, plasticizers, acidscavengers, and cross-linking agents, as well as residual monomers and oligomers,polymerization side products, and process impurities.“THE COMPLEXITIES INTHE ANALYSIS OF E&L IS ADIRECT RESULT OF ALL THEVARIOUS ROUTES OF DRUGADMINISTRATION THAT THENREQUIRE THE USE OF A LARGEVARIETY OF DRUG DELIVERYTECHNOLOGIES.”— SMRITI KHERAWhy is E&L analysis so important? Chemicals that can leach from medical devicesand packaging materials represent an enormous risk to modern drug delivery.“The complexities in the analysis of E&L is a direct result of all the various routesof drug administration that then require the use of a large variety of drug deliverytechnologies,” says Smriti Khera, Ph.D., Global Pharmaceutical Segment Managerat Agilent Technologies. “The risk increases as more components come in contactwith the drug product,” she adds, with risk rising as drug formulations becomemore complex, going from oral to topical, transdermal, injectable, and inhaled.The dose volume and frequency and duration of contact between the drug andpackaging also contribute to overall risk.Drug recalls have been on the rise in recent years and leached impurities havebeen a key factor responsible for many of these. In 2014 FDA recalls surged to836. Recalls affect patients, denying them access to approved medications, aswell as manufacturers of drugs, delivery systems, devices, and components, oftenimposing a significant financial burden.“The results of studies designed to detect extractables can support thedevelopment of safe and effective manufacturing and packaging of drugs anddevices,” says Mark Jordi, Ph.D., President, Jordi Labs. “This information can alsofacilitate investigations into the origin(s) of identified leachables whose presencecauses out-of-specification results for a marketed product.”Drug recalls have been on the rise in recentyears and leached impurities have been a keyfactor responsible for many of these. In 2014FDA recalls surged to 836. The U.S. Pharmacopeial Convention (USP) has issued regulationsfor the characterization of materials-of-construction, packaging systems, and pharmaceutical products that include E&L analysis.Regulations and standards governing E&L analysis have proliferated in recentyears, in particular related to pharmaceutical packaging and biomedical devices.The regulations often provide helpful guidance on a range of topics including thecharacterization of packaging materials and systems, toxicological assessment,and E&L testing specifications and experimental design. The primary FDA guidancedocument, U.S. FDA 21 CFR 211.94(a), states that, “Drug product containers andclosures shall not be reactive, additive or absorptive so as to alter the safety,identity, strength, quality, or purity of the drug beyond the official or establishedrequirements. Standards or specifications, methods of testing, and, whereindicated, methods of cleaning, sterilizing, and processing to remove pyrogenicproperties shall be written and followed for drug product containers and closures.”E&L STUDY DESIGNA well-designed E&L study is of utmost importance in evaluating the risk frompotential leachables. Due to the lack of universally applicable rules for E&L studydesign, any analytical methodology requires a great deal of thought so as not toomit any possible hazardous compounds that could be traced back to the drugpackaging components. In general, a well-designed E&L study has four main steps:1 Gather background information on the components and composition of thedevice, delivery system, and packaging materials, and on the use conditionsC&EN MEDIA GROUPANALYSIS OF EXTRACTABLES AND LEACHABLES
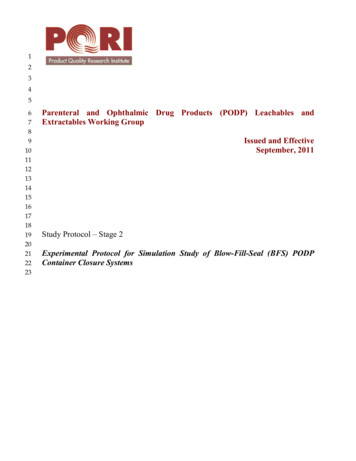
32 Develop a study protocol for profiling of extractables that specifies:a Sample selectionb Extraction protocolc Analytical evaluation3 Risk assessment: evaluate safety risk of extractables and leachables based onavailable toxicological data for known compounds or using structure-activityrelationship (SAR) data for new compounds4 Leachables detection, identification, quantitation, and determination oftoxicologic thresholdsGATHERING BACKGROUND INFORMATIONImportant background information includes facts about the materials ofconstruction (e.g., additives, multilayer films, printing inks) and whether anyprocessing aids were used in manufacturing. Also crucial is the make-up of thefinished packaging in relation to the product: which surface does the productcontact, and is it possible for non-product contact components to migrate?“This information helps you understand what components have the potential tointeract with the product,” says Kevin Rowland, Laboratory Manager, Jordi Labs.How a system will be used should be the basis for determining how it should beextracted, with variables such as temperature, solvent strength, and time used tosimulate the use conditions.SAMPLE SELECTION FOR PROFILING EXTRACTABLESThe sample to be tested should be representative of the final product, mimickingits intended use by a patient. In some cases, the extraction sample may be anentire device or packaging. When that is not practical or necessary, however,alternative strategies may include cut and cover, full fill, one-sided, flow through,or large volume dynamic headspace extraction.Figure 1. Solvent polarity affects which compounds will be extracted and which degradantsof those compounds may be observed, as shown in these spectra comparing extractionwith water, ethanol/water, or ethanol. Analysis was performed using an Agilent 1290Infinity UHPLC; Agilent 6520 QTOF-MS; Agilent Zorbax Eclipse Plus C8 column; elecrosprayionization, polarity: positive.C&EN MEDIA GROUPANALYSIS OF EXTRACTABLES AND LEACHABLES
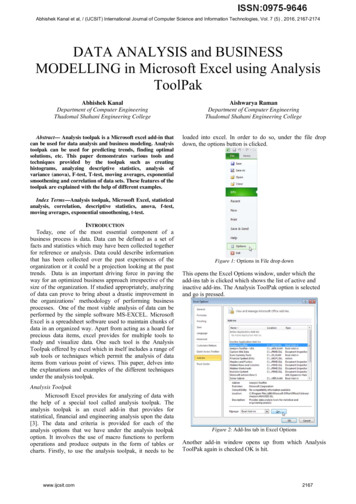
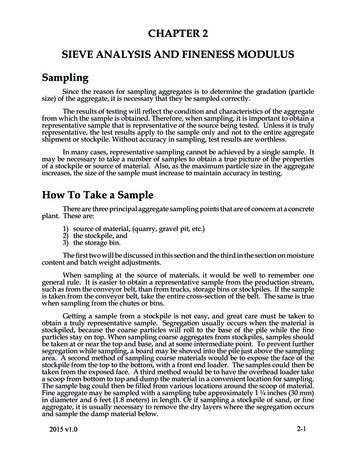
4GFCMolecular WeightSECHPLCEXTRACTION PROTOCOL FOR PROFILING EXTRACTABLESThe background information and probable extractables will guide solventselection. It is generally recommended to utilize three solvents spanning awide range of solvent polarity from polar to non-polar. “Solvent polarity choicedetermines which compounds you will extract and which degradants of thosecompounds (e.g., as a result of hydrolysis) you may observe,” says Kevin Rowland.CEGCICPolarityCE: Capillary electrophoresisGFC: Gel-filtration chromatographySEC: Size-exclusion chromatographyIC: Ion chromatographyFigure 2. Graph showing the types ofANALYTICAL EVALUATION OF EXTRACTABLES AND LEACHABLESThe E&L analytical workflow and the method of detection employed will dependon the physicochemical characteristics of the analytes. No universal analyticaltechnique exists to detect the range of known and unknown organic andinorganic compounds that may be present at risk assessment threshold levels inan E&L study. Typically, “the volatility of residues drives the selection of analyticaltechnique employed,” says David Weil, Ph.D., Senior Application Scientist, AgilentTechnologies. Thus, based on volatility of the fraction to be analyzed, the mostcommon analytical techniques employed for extractables profiling are:analytes detectable with variousanalytical technologies.THE ACCURACY ANDRELIABILITY OF AN E&L STUDYSHOULD BE CONFIRMEDUSING RIGOROUS QUALITYCONTROL MEASURES THATINCLUDE ANALYSIS BLANKS,NEGATIVE AND POSITIVECONTROLS, AND SPIKINGSTUDIES. Non-volatile residues: LC/MS, using a targeted triple quad approach (LC/QQQ)or an untargeted (LC/QTOF) mode or other high resolution system Volatile or semi-volatile residues: GC/MS (headspace GC/MS, GC/QTOF) Heavy metals: ICP/MS, ICP/OES, AAAnalytical innovations make it possible to identify more chemicals. LC/MSand GC/MS are currently the workhorse techniques for E&L analysis, but severalemerging technologies offer the potential to improve analytical efficiency, resolvecomplex mixtures, and enhance the sensitivity and expand the detection limits ofconventional methods. New analytical technologies that offer better performancefor analyzing non-volatile E&Ls include evaporative light scattering detection(ELSD), supercritical fluid chromatography (SFC), two-dimensional LC, and ionmobility MS (IMS).— MARK JORDIS/N increased significantly!Figure 3. Ion mobility provides greater selectivity, thereby lowering detection limits.C&EN MEDIA GROUPANALYSIS OF EXTRACTABLES AND LEACHABLES
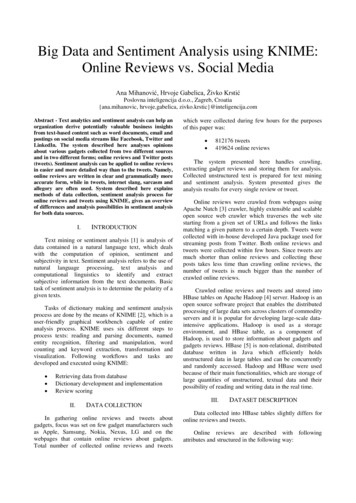
5ION MOBILITY ADDS VALUEAND ANOTHER DIMENSIONTO LC — A WAY TO REDUCECHEMICAL BACKGROUNDNOISE AND PROVIDEGREATER SELECTIVITY,LOWERING DETECTIONLIMITS.— DAVID WEILELSD, a technique that complements LC/MS, has a sensitivity in the low nanogramrange and provides a more uniform response. With sub-ambient evaporation at10oC, ELSD can enhance detection of semi-volatile compounds. The key advantagesof an SFC separation are its speed, with separation times 2-5 times faster thanLC orthogonality, and the flexibility to switch between SFC and UHPLC using the1260 SFC/UHPLC Hybrid system, which reduces the barrier to entry into the newtechnology. Other benefits of SFC are the ability to switch elution order comparedwith reverse-phase HPLC separations, and the ability to couple a “normal phase”separation mass spectrometry, unlike a traditional normal phase LC separation.Additionally, “2D LC with MS detection is gaining in importance in E&L analysis,”says David Weil. Two-dimensional chromatography separates compounds seriallyusing two of the same or complementary columns with different solvent gradients,thereby exponentially increasing peak capacity. Also attracting attention is ionmobility-MS, which separates and identifies ionized molecules in the gas phasebased on their mobility in a carrier buffer gas. Whereas MS separates moleculesbased on their mass alone, in IMS a molecule’s gas phase mobility (how fast itmoves through the drift tube) is a function of its size and conformation/shape.Instrument detection limits. The techniques and instruments used for E&L analysishave different limits of detection. “To reach the detection limits using the instrumentswe have today, it is often necessary to concentrate extracts,” says Kevin Rowland.Separation of 25 PAHsSeparation of 17 Phthalate EstersFigure 4. 2D LC and MS used to separate and detect polycyclic aromatic hydrocarbons(PAHs) and phthalate esters.Figure 5. Range of techniques for detecting unknowns in qualitative analysis and theirtypical limits of detection.C&EN MEDIA GROUPANALYSIS OF EXTRACTABLES AND LEACHABLES
6But, “extractables and leachables can be lost during the sample concentration process.Therefore, it is critical to minimize losses and to know what might be lost to avoid falsenegative results. Best practice for concentration is the use of relatively mild conditionsand to validate the methods used and know their capabilities.”For extractable and leachable compounds present at low concentrations, “betterseparations enhance detection” and “using the right column,” is critical, says DavidWeil. Thus, new and emerging separation techniques such as 2D LC or SFC offeradvantages, as do orthogonal detection strategies such as a combination of ELSDor UV together with MS. Choosing an optimum ionization technique can also havea big impact on mass spectrometric detection. Compared to ESI, APCI, or PPI, a JetStream ion source, which uses superheated nitrogen sheath gas, yields a 10-foldincrease in ions, lowering detection limits.SOLVING A DIFFICULT EXTRACTION WITH 2D UHPLCIn the quantitation method development for bis-phenol A, Kevin Rowland describes the difficulty encountered in resolvingthe compound from background components on a UHPLC system (Figure [a]). He developed a 2D UHPLC methodologyillustrated in Figure b, which included the use of a spiked extract and fluorescence detection.Figure a: 1o chromatograms from 2D UHPLC workflow; analysis was performed using an Agilent 1290 Infinity UHPLC, Zorbax SB-C18 column, H2O- ACN gradient as mobile phase. Top, 230 nm (DAD) detection. Bottom, 230nm (VWD) detection; collection mode: heart-cutting, 2.18-2.22 minutes.C&EN MEDIA GROUPFigure b: 2o chromatogram in 2D HPLC workflow; analysis was performed using an Agilent Eclipse Plus Phenyl-Hexyl column and H2O- ACN isocratic mobile phase. Top, 230 nm (DAD) detection; Bottom,225 nm excitation and 310 nm emission fluorescence detection.ANALYSIS OF EXTRACTABLES AND LEACHABLES
7CHEMICAL STRUCTURE IDENTIFICATION AND DIFFERENTIAL ANALYSIS“Extracted components are identified using a combination of analytical methodsincluding LC/MS, GC/MS, headspace MS, NMR, FTIR, and ICP/MS,” says Mark Jordi.Mainly because of its sensitivity, selectivity, and low sample requirement, massspectroscopy is the principle analytical method used for compound identification.For targeted identification to pinpoint known compounds, LC coupled with triplequadrupole MS with triggered multiple reaction monitoring (QQQ T-MRM) can beused. However, the best approach for non-targeted identification, when dealingwith unknown compounds, is to couple GC (for volatiles) or LC (for non-volatiles)with TOF/QTOF and generate high resolution accurate mass MS and MS/MS spectra.These can then be matched with public or private databases using databasesearching to obtain a match with known reference standards. If an exact matchcannot be found, then high resolution accurate mass QTOF data enable elementalformula generation, and software tools such as Molecular Structure Correlator canbe employed to aid assignment of possible structures for the unknowns. Togetherwith HR-MS and MS/MS experiments, spectral techniques such as NMR, and FTIRcan also be employed for more confident structure determination.“The qualitative analysis capabilities of MassHunter software can acceleratecompound identification,” says Smriti Khera. “The software is able to performsearches of large and diverse MS databases and libraries such as NIST 2014 LCMS/MS, NIST GC/MS SQ 2014, and Wiley GC/MS S 10th/NIST 2014. It is also easyto create a customized Personal Compound Database (PCD) for GC/MS or LC/MSdata or a Personal Compound Library (PCDL) for MS/MS spectra in MassHunter.This speeds up identification based on the cumulative knowledge your laboratoryhas gathered from prior E&L sample analysis.” The Molecular Structure Correlator(MSC) software tool can facilitate identification of an unknown compound bymeans of de novo structure prediction. The MSC workflow compares the LC or GCMS/MS spectra from E&L analyses to structure databases compiled from PCD/L,ChemSpider, PubChem, and other sources.LIBRARY SEARCHES Focused Databasesand Libraries NIST, Wiley, (E&L PCD)DIFFERENTIAL ANALYSIS MP Professional Statistical AnalysisUKNOWN ID MolecularStructure CorrelatorMASSHUNTER QUANT FORTARGETED QUANTITATIONThe addition of Mass Profiler software to MassHunter enables differentialanalysis through the comparison of sample sets and the identification of featuresthat are either similar or differ between multiple groups of samples. Figure 6shows an example of a differential sample analysis for extractables profilingthat compares foil versus rubber. This is extremely beneficial in the case of E&Lstudies, since each analyzed sample may contain hundreds of peaks, and whenC&EN MEDIA GROUPANALYSIS OF EXTRACTABLES AND LEACHABLES
8Figure 6: Differential analysis for extractables profiling comparing foil versus rubber, usingMassHunter Mass Profiler.making comparisons between sample and control, sample-to-sample or lot-to-lotdifferential analysis tools can bring a great deal of efficiency to the workflow andfocus efforts on resolving the differences between sample sets.QUANTITATIVE ANALYSIS OF E&LSQuantitation is a very important part of the E&L workflow because it is essentialto measure extractables and leachables down to the calculated AnalyticalEvaluation Threshold (AET). As Mark Jordi explains, “the AET is the threshold at orabove which a chemist should identify a particular leachable and/or extractableand report it for potential toxicological assessment.” The AET level for leachableswill depend on the route of exposure, treatment duration, and daily exposure.Following E&L identification, the concentration of each component must bedetermined. Chromatography and mass spectrometry are the main techniquesused in quantitative analysis. Currently, the most commonly applied quantitativemethods are GC-MS, UHPLC-UV, UHPLC-CAD, and QTOF-GCMS.Figure 7: Comparison of recovery between Formal Quantitation method development andRelative Quantitation using various surrogate standards.C&EN MEDIA GROUPANALYSIS OF EXTRACTABLES AND LEACHABLES
9The two approaches to E&L quantitative analysis are Formal and RelativeQuantitation. In Formal Quantitation, which is the preferred approach,compounds are quantified using high purity analytical standards (referencecompounds) at a series of concentrations. However, when standards are notavailable, Relative Quantitation is employed. In the case of Relative Quantitation,the compounds in a sample are compared against surrogate standards; theaccuracy of this method will depend on the surrogate standards used. Thepotential variability of the results obtained when using a Relative Quantitationstrategy compared to Formal Quantitation is illustrated in Figure 7. Comparison ofthis must be kept in mind when using surrogates for quantitation.CONCLUSIONSThe ability to perform accurate, sensitive qualitative and quantitative analysis ofextractables and leachables is an essential part of pharmaceutical manufacturingand product testing. The potential toxicity of leachables on patient exposureand their ability to migrate from packaging materials, biomedical devices,drug delivery systems, or process equipment demands thorough evaluationof extractable compou
and packaging materials represent an enormous risk to modern drug delivery. “The complexities in the analysis of E&L is a direct result of all the various routes of drug administration that then require the use of a large variety of drug delivery technologies,” says S