Transcription
Analytics Maturity:Industry Trends and Financial ImpactsBill FranksChief Analytics Officer, International Institute For AnalyticsSeptember 2018Copyright 2018 IIA All Rights Reserved1
Agenda1Defining Analytics Maturity2Research Results: How Do Industries Compare?3Research Results: Industry Drill Downs?4Is Analytics Maturity Associated With Company Performance?5Conclusions / Question & AnswerCopyright 2018 IIA All Rights Reserved2
How Can Analytics Capability Be Measured?How are wedoing?Compared towhat?What should wedo to improve?How do wemeasure howwe are doing?Where should we focusour time, energy andinvestment for thegreatest return?Copyright 2018 IIA All Rights Reserved3
Developing Enterprise Analytics CapabilityHow? Adopt an unbiased framework for determining how groupswithin an organization rate and prioritize analytics capabilitiesIIA Analytics Maturity Methodology Uses 5-Stage Analytics Maturity Model and DELTAFramework for assessing enterprise analytics capabilities2007Methodology Goals Assess enterprise analytics maturity with standard framework Assess enterprise analytics maturity against other industries Provide actionable insight for improving analytics capability20102017Copyright 2018 IIA All Rights Reserved4
5 Stages of Analytics yticalCompaniesGood ot Data-Driven Use ReportingSTAGE 1STAGE 2AnalyticalAspirationsSee the Valueof AnalyticsAdapted from Competing on AnalyticsDavenport and Harris, 2007STAGE 3STAGE 4Copyright 2018 IIA All Rights ReservedSTAGE 55
5 Stages of Analytics MaturitySTAGE 5: ANALYTICAL COMPETITORS:“Analytical Nirvana.” Use analytics across the enterpriseas a competitive differentiator and in strategySTAGE 4: ANALYTICAL COMPANIES:“Good at Analytics.” Highly data oriented, have analyticaltools, and make wide use of analytics. Lack commitment tofully compete or use strategicallySTAGE 3: ANALYTICAL ASPIRATIONS:“See the value of analytics.” Struggle to mobilize theorganization and become more analyticalSTAGE 2: LOCALIZED ANALYTICS:“Use reporting.” Use of analytics or reporting is infunctional or business silosSTAGE 1: ANALYTICAL IMPAIRED:“Not data-driven.” Rely on gut feel and plan to keep doing so. NotAdapted from Competing on AnalyticsDavenport and Harris, 2007asking analytics questions and/or lack the data to answer themSTAGE 1STAGE 2STAGE 3STAGE 4Copyright 2018 IIA All Rights ReservedSTAGE 56
DELTA FrameworkIIA’s analytics maturity methodology measures anorganization’s performance using the DELTA model frameworkDELTA BREADTH, INTEGRATION, QUALITYAPPROACH TO MANAGING ANALYTICSPASSION AND COMMITMENTFIRST DEEP THEN BROADPROFESSIONALS AND AMATEURSAdapted from Analytics at Work, Davenport, Morrison and Harris, 2010Copyright 2018 IIA All Rights Reserved7
DELTA CompetenciesD DATAüData captureüData qualityüData integrationüUse of external dataüData consistencyüDatatrustworthinessüAnalytical toolsü“Big Data”utilizationE ENTERPRISEüEnterprise techmanagementüOrganization oftalentüFunding adequacyüNon-managementutilizationüData scalabilityüExternal reportingL LEADERSHIPüStrategic ght 2018 IIA All Rights ReservedT TARGETSA ANALYSTSüPredictivemodelingüGoal unityidentificationüExperimentationüStaffing levelüConsultativeapproachüBusiness skillsüData science skillsüCareer paths8
Why Measuring Effectiveness Is CriticalThe dimensions of importance and effectiveness are both evaluatedNot important at all0Extremely important246Not effective at all810Extremely effectiveCopyright 2018 IIA All Rights Reserved9
Maturity Priority MatrixShows which competencies have the greatest gaps betweeneffectiveness and importancePRIORITY MATRIX10Opportunity Importance Max (Importance – Effectiveness, t 2018 IIA All Rights Reserved891010
Analytics Maturity Research Results:How Do Industries Compare?Copyright 2018 IIA All Rights Reserved11
IIA Analytics Maturity Research TimelineOriginal StudyQ2 2016Digital NativesQ3 2016RetailQ1 2017HealthcareQ3 2017CompanyPerformanceQ3 2017Financial ServicesQ4 2017UPCOMING Fall 2018 – Cross Industry Update Fall 2018 – Company Performance UpdateCopyright 2018 IIA All Rights Reserved12
IIA Full Assessment MethodologyAssessment Goals Measure analytics maturity of individual companies in-depth Provide deep dive results across enterprise stakeholders & business units Provide actionable insights by comparing to the full databaseAssessment Methodology Full Analytics Maturity Assessment questionnaire with standard model Hundreds of respondents across each enterpriseIIA full assessment cohort Sample Size: 20,000 responses across 80 companies Functional Areas: All analytics stakeholdersCopyright 2018 IIA All Rights Reserved13
IIA Market Leaders Goals and MethodologyStudy Goals Measure analytics maturity across 20 different industry segmentsOnline B2B Panelists Measure analytics maturity of digitally native companies Provide actionable comparisons for IIA’s full Analytics MaturityEmployed atParticipant CompanyAssessment databaseStudy Methodology Modified Analytics Maturity Assessment model Respondents screened and selected from research panelsTargeted Market Leaders in 20 industries Sample Size: 900 Responses across 120 companies Functional Areas: IT/Systems/Analytics, Finance, and Sales/Marketing Minimum Data Requirements: At least 5 respondents from eachcompany, with 1 from each functional areaCopyright 2018 IIA All Rights ReservedIn RequiredPositionWith RequiredResponsibilityProducer,Enabler or Userof DataAnalyticsRespondent14
Market Leader Cohort: Example CompaniesCopyright 2018 IIA All Rights Reserved15
Analytics Maturity Across Different PopulationsIIA included some full assessment cohort members in the marketleader cohort to validate that both methods have consistent resultsSTAGE 11 to 1.99STAGE 22 to 2.99AnalyticallyImpairedLocalizedAnalyticsSTAGE 33 to 3.99STAGE 44 to 4.99AnalyticalAspirationsSTAGE 55 to 5.99AnalyticalCompaniesAnalyticalCompetitorsALL COMPANIES(IIA ESTIMATE)Lowest ScoreFULL ASSESSMENT COHORTMARKET LEADERS COHORTMedian2.251.25Lowest ScoreHighest ScoreMedian1.73Copyright 2018 IIA All Rights Reserved 3.323.72Highest Score4.9416
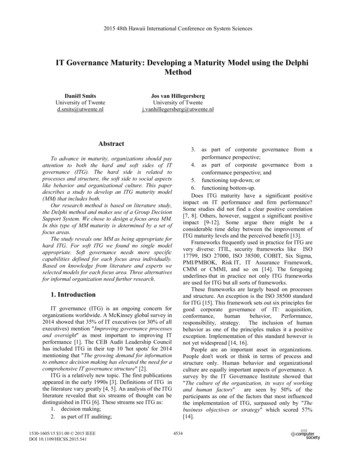
Market Leader Industry/Segment RankingsThere is wide variation in analytics maturity across industriesDigital Native4.56Financial Services3.91Consumer Brands3.62General Retail3.58Pharma & Medical 3Automotive3.19Utilities & Telecom3.05Healthcare - Insurance2.96Insurance2.89Specialty RetailHealthcare - ProviderPossible Scores:1.00 to 5.992.882.25Copyright 2018 IIA All Rights Reserved17
Market Leader Industry/Segment DistributionsStage 5Competitor(5-5.99)Stage 4Company(4-4.99)Stage 3Aspirations(3-3.99)Stage 2Localized(2-2.99)Stage 1.951.73102.894.094.0732.973.764.052.25 2.88 2.89 2.96 3.05 3.19 3.23 3.29 3.43 3.55 3.58 3.62 3.91 4.56ilertaidevroyRal tePircecathSpaleHInsceanruencrau&Insei estariclithUtalHeml coeTsgilesdsi vetari nic eeanvatvi currRteNlecDSrBalfaradg iti alnunemeiMeceauDGM&annsCoFi nmarhaCopyright 2018 IIA All Rights Reserved Pi veotmtoAunrliAiesyerocrG18
Analytics Maturity Research Results:Industry Drill DownsCopyright 2018 IIA All Rights Reserved19
Digital NativesThe companies below comprised the digital native groupApple was included in this group because a) of its relatively high score compared to other companies, b) the majority of its revenues and profits (85% ) arederived from products and services launched since 2007 (e.g., iPhones, iTunes, App Store), and c) its overall leadership position in the digital economy.Copyright 2018 IIA All Rights Reserved20
Digital Natives Must Maintain Competitive Advantage Do employees believe a company must maintain a competitive advantage in analytics? Competitive Rating Do employees believe their company maintains a competitive advantage in analytics? Satisfaction Rating Are employees satisfied with their company’s commitment level to analytics?Digital NativesCopyright 2018 IIA All Rights ReservedInsurance21
AMA Priority MatrixDigital Natives are unique in both the consistency of ratings and the factthat most competencies are table stakes109Opportunity Importance Max (Importance – Effectiveness, 0)Potentially Overserved:Data IntegrationExecutive tedOpportunityAnalystsLimited Opportunities:Data CaptureFunding 67Opportunity Importance Max (Importance – Effectiveness, 0)DataPotentially ssEffectivenessEnterpriseDIGITAL ts54Solid Opportunities:Data CaptureData TrustworthinessAnalytical ToolsData ScalabilityExecutive Utilization3PHARMA & MEDICAL DEVICETableStakes21AppropriatelyServed1234High Opportunities:Data QualityFunding AdequacyGoal t 2018 IIA All Rights ReservedINSURANCE22
Financial Services SegmentsWealth Management (4)CC & Payments (3)US Banks (9)Canadian Banks (4)Insurance / Diversified (5)Credit Unions (3)Copyright 2018 IIA All Rights Reserved23
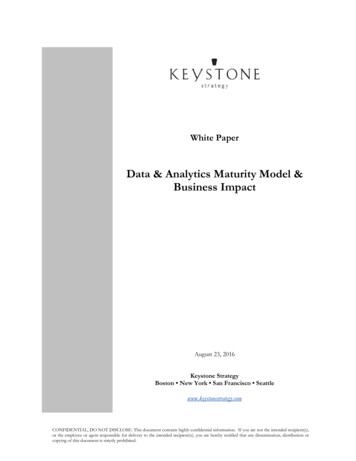
Financial Services Segment RankingsCC & Payments3.92Wealth Management3.77US Banks3.61Canadian Banks3.07Credit Unions2.84Insurance / Diversified2.83Market Leaders - Financial ServicesPossible Scores:1.00 to 5.993.91Copyright 2018 IIA All Rights Reserved24
Financial Services Segment DistributionsStage 5Competitor(5-5.99) 5.0Stage 4Company 4.0(4-4.99)Stage 3Aspirations 3.0(3-3.99)Stage 2 2.0Localized(2-2.99)1.0Stage 1Impaired(1-1.99) 0.0/cenaurInsPossible Scores:1.00 to .843.07sionnUnaCaksanBndia3.613.77ksanBSa ltWeCopyright 2018 IIA All Rights 513.92&CCtsenmyPa3.91trkeaMrsdeaLe25
Retail SegmentsDigital Native - Online (2)Specialty Clothing – Apparel (5)Big Box – General (4)Home Improvement (3)Grocery (5)Department Stores (4)Copyright 2018 IIA All Rights ReservedBig Box – Specialty (3)Pharmacy & Health (3)26
Retail Segment RankingsOnline Retail4.50Big Box - General3.58Grocery3.44Specialty Clothing - Apparel2.98Big Box - Specialty2.94Home Improvement2.89Pharmacy & Health2.88Department Stores2.83Market Leaders - RetailPossible Scores:1.00 to 5.993.56Copyright 2018 IIA All Rights Reserved27
Retail Segment DistributionsStage 5Competitor(5-5.99) 5.0Stage 4Company 4.0(4-4.99)Stage 3Aspirations 3.0(3-3.99)Stage 2 2.0Localized(2-2.99)Stage 1 1.0Impaired(1-1.99) 0.0Possible Scores:1.00 to taitaitaiareeracecia DePhyHltMciaeSpCopyright 2018 IIA All Rights ReservedresotShalteH28
Is Analytics Maturity Associated WithCompany Performance?Copyright 2018 IIA All Rights Reserved29
Analytics Maturity And Company PerformanceDoes improving enterprise analyticscapabilities correlate with superiorcompany performance?This premise is at the center of IIA’s founding andmission but is this belief supported by actual data?We decided to put the theory to the test with someformal research to explore the relationship!Copyright 2018 IIA All Rights Reserved30
Analytics Maturity And Company PerformanceIs analytics maturity associated with company performanceand shareholder value?Explored relationship between analytics maturity and 72 operatingand financial metrics . . .Perceived Performance Inclusion in Top Company ListsFinancial Performance Revenue Growth, Net Income GrowthInvestment Return Market Capitalization, Forward P/E Stock Performance (Absolute Relative to Peer Group)Copyright 2018 IIA All Rights Reserved31
Analytics Maturity And Company PerformanceBelow are the companies include in the performance studyDigital NativesConsumer BrandsHealthcare InsuranceFinancial ServicesPharmaceuticals & Medical DevicesTelecom & UtilitiesAutomotiveManufacturingAirlinesBig Box - GeneralGroceryDrug StoresInsuranceSpecialty ApparelHome ImprovementDepartment StoresBig Box - SpecialtyCopyright 2018 IIA All Rights Reserved32
Analytics Maturity And Company PerformanceInvestment ReturnFinancial Performance Market Capitalization( Billions) Forward Price to EarningsRatio (Forward P/E Ratio) 5-Year Shareholder Return 5-Year Shareholder Returnvs S&P Segment 10-Year Shareholder Return 10-Year Shareholder Returnvs S&P Segment Return on Equity 3-Year Revenue Growth 5-Year Revenue Growth 10-Year Revenue Growth 5-Year Operating IncomeGrowth 10-Year OperatingIncome Growth Return on AssetsPerceived Performance Brand Value – Top 500 Brands ( Billions)Change in Brand Value (1-year & 2-year)Fortune Most Admired Companies RankFortune Most Admired Companies ScoreForbes Most Powerful Brands RankForbes Most Innovative Companies RankBCG Most Innovative Companies RankBCG Most Innovative CompaniesFrequencyCopyright 2018 IIA All Rights Reserved33
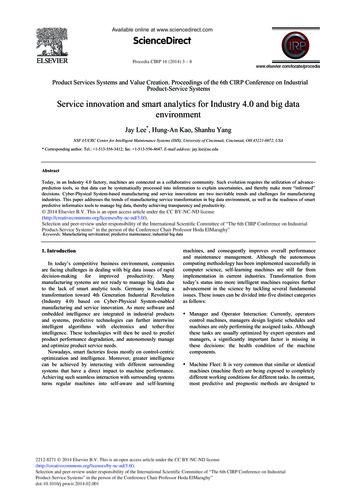
Financial PerformanceThe higher performance of stage 4 companies is both visible andstatistically significantRevenue and Operating Income Growth by DELTA 4%5%5.9%4.2%10%15.0%15%18.3%20%Revenue & Operating Income Growth5 Year Revenue Growth**0.265 Year Operating Inc Growth**0.2610 Year Revenue Growth***0.4310 Year Operating Inc Growth***0.42Statistical significance of correlations:** P .05*** P .01-5%Stage 2 (2.00 - 2.99)5-Yr10-YrOperating Inc Operating IncStage 3 (3.00 - 3.99) Copyright Stage20184 (4.004.99) ReservedIIA All- Rights34
Investment PerformanceThe gap between stages is significant in the 10 year time frame5-Year and 10-Year Investment Return by DELTA Stage30%10 Year vs. S&P Segment***0.415%0%-7.6%Statistical significance of correlations:** P .05*** P .017.1%10%6.0%0.4618.1%10 Year***7.2%15%0.0%0.068.3%5 Year vs. S&P Segment2.3%0.1216.2%20%5 Year16.2%Stock Performance26.1%25%2.9%Correlations:-5%-10%5-Year Return5-Year Return 10-Year Return 10-Year Returnvs Segmentvs SegmentStage 2 (2.00 - 2.99)Copyright 2018 IIA All Rights ReservedStage 3 (3.00 - 3.99)Stage 4 (4.00 - 4.99)35
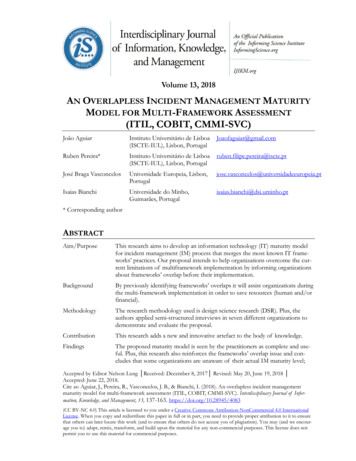
Investment PerformanceMarket cap and forward P/E ratio were two of the metrics moststrongly correlated with analytics maturityMarket Capitalization vs. DELTA 800Forward P/E Ratio vs. DELTA Score 60035 50030 400R² 0.20162, P .01 300 200 100 011.522.533.5DELTA Score44.55Forward P/E RatioMarket Capitalization ( B) 700R² 0.29454, P .01252015105011.522.533.544.55DELTA ScoreCopyright 2018 IIA All Rights Reserved36
Perceived PerformancePerformance lists are associated with maturity basedTop Company Lists - Average DELTAFortuneForbesMost AdmiredForbesMost Powerful BrandsMost InnovativeWithWithoutWithWithoutWithWithoutDigital NativeDigital NativeDigital NativeDigital NativeDigital NativeDigital NativeOn List3.673.513.593.423.983.64Not On List3.203.183.203.203.313.26Correlations:Top Lists - DELTA and RankingFortune Most Admired**0.45Fortune Most Admired Score*0.28Forbes Most Powerful Brands*0.34Brand Finance Valuable Brands *0.45Forbes Most Innovative *0.31BCG Most Innovative 2005-16***0.57Statistical significance of correlations:* P .10** P .05*** P .01Copyright 2018 IIA All Rights Reserved37
Moving Between Levels Of MaturityIIA has also done research to identify the actions required tomove between maturity levelsWe don’t have time to cover these details during today’s sessionCopyright 2018 IIA All Rights Reserved38
Analytics Maturity And Company PerformanceYes, Analytics Maturity IS Associated WithCompany Performance! 59 of 72 metrics showed a positive association betweenanalytics maturity and company performance, while 13were neutral! Financial performance, investment return, and perceivedperformance are all associated with analytics maturity Continuing to invest in analytics capabilities may helpcompanies remain competitiveCopyright 2018 IIA All Rights Reserved39
Conclusions1Analytics maturity should be measured in a standard, proven way2As might be expected, companies vary greatly in maturity level3There are also large differences in average maturity across industries4Analytics maturity correlates with many measures of company performance5Research shows that investing in analytics may increase corporate successCopyright 2018 IIA All Rights Reserved40
Further Questions Or mTwitter: @BillFranksGACopyright 2018 IIA All Rights Reserved41
ABOUT IIACOMPETING ON ANALYTICS FROM THE BEGINNINGFounded in 2010 by Jack Phillips and Tom Davenportwith the belief that . . . Jack PhillipsCHIEF EXECUTIVE OFFICEREditor of Enterprise AnalyticsCompeting on analytics is the futureSuccess will be a strategic imperative, but difficult to achieveTom DavenportSuccess will require specialized and leveraged expertiseCO-FOUNDER, BOARD MEMBER, FACULTYAuthor of Competing on AnalyticsIndustry recognizedfoundational researchfromIIA’s Tom Davenport,Robert Morison & BillFranksCopyright 2018 IIA All Rights ReservedBill FranksCHIEF ANALYTICS OFFICERPrevious CAO TeradataAuthor The Analytics RevolutionRobert MorisonLEAD FACULTYCo-Author of Analytics at Work42
WHY IIA? SOLUTIONS FOR ANALYTICS SUCCESSThe IIA Analytics Performance SuiteRESEARCH &ADVSORY NETWORKIIA helps develop and sustain enterprise analyticscapabilities that drive performance and createcompetitive advantageIIA focuses on the key levers of success andmaximum return:EXPERTISEüAccess to ExpertiseüSkills SMENTSCopyright 2018 IIA All Rights ReservedSKILLSDEVELOPMENTADVISORY CONSULTING,EXECUTIVE COACHING,WORKSHOPS, & TRAINING43
www.iianalytics.com503-467-0210Copyright 2018 IIA All Rights ReservedCopyright 2018 IIA All Rights Reserved44
derived from products and services launched since 2007 (e.g., iPhones, iTunes, App Store), and c) its overall leadership position in