Transcription
TRENDLINE TRADING STRATEGYSECRETS REVEALED1www.forextrendlinetrading.com
All rights reserved. No part of this publication may be reproduced, stored in aretrieval system, or transmitted in any form or by any means, electronic, mechanical,or by photocopying, recording or otherwise without the permission of MyronnSaremo.DISCLAIMERTrading in the Forex market is a challenging opportunity where above averagereturns are available to educate and experienced investors who are willing to takeabove average risk. However, before deciding to participate in Forex trading, youshould carefully consider your investment objectives, level of experience and riskappetite. Most importantly, do not invest money you cannot afford to lose.There is considerable exposure to risk in any foreign exchange transaction. Anytransaction involving currencies involves risks including, but not limited to, thepotential for changing political and/or economic conditions that may substantiallyaffect the price or liquidity of a currency.Moreover, the leveraged nature of FX trading means that any market movement willhave an equally proportional effect on your deposited funds. This may work againstyou as well as for you. The possibility exists that you could sustain a total loss ofinitial margin funds and be required to deposit additional funds to maintain yourposition. If you fail to meet any margin call within the time prescribed, your positionwill be liquidated, without prior notice to you, and you will be responsible for anyresulting losses. Investors may lower their exposure to risk by employing proper riskmanagement practices.2www.forextrendlinetrading.com
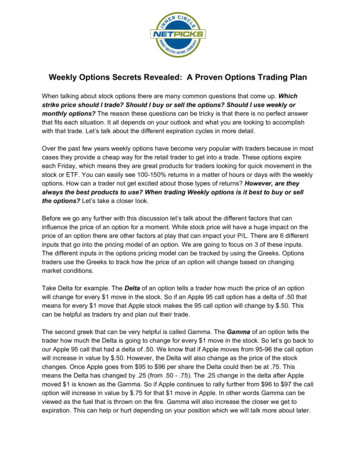
INTRODUCTIONOn the chart below: only 3 trades and 800 pips of floating profit, majority ofprofits locked and I am not out yet. and all this is in just one week. This pairwas still heading down when I got its screenshot. When I closed all the 3trades, it was more than 800pips in total profit.USDCHF trade: Pinpoint Deadly Accuracy. The trendline entry was taken inthe 5min timeframe.3www.forextrendlinetrading.com
This is how it was turning out almost 7 hours later.This is the power of the Trendline Trading Strategy and it: is dead-simple to use allows you enter high probability trades with pin-point accuracy andcapture maximum profits effortlessly is price-driven entry based on what happens on touch of Trendlines is a trend following strategy that will allows you to make trades with thetrend which means you have the odds stacked on your side.OVERVIEW OF TRENDLINE TRADING STRATEGYTimeframes:AnyCurrency om
This is a general setup for Long Entry(or buy setup).This figure below is a general setup for Short Entry(or sell setup).5www.forextrendlinetrading.com
You could have taken these trades shown below with almost pin-point deadlyaccuracy with the Trendline Strategy.I want you to notice how the market reacted and responded to thetrendlines drawn above.How many times did price bounce up on the first trendline? 4 Times, therefore4 opportunities to buy(or go long).Trendline Trading Strategy also allows you to get in at almost the beginning ofa new trend or start of market swings (tops or bottoms) or if you miss thebeginning, you hop in along the way and this makes it one of the best swingtrading systems simply because it does not involve indicators but just anability to trend a trendline and use that with price action alone.Let me show you one more chart.Notice how many times price reacted and obeyed this trendline below. Wouldyou have made money if you had gone short? Yes.This is about KEEPING IT SIMPLE.6www.forextrendlinetrading.com
Before I get you into the rules of the Trendline Trading Strategy, youneed to build a good foundation of understating how this trading strategyworks.This includes: how to draw valid trendlines when is a trendline still valid and when does it becomes invalid understanding some common mistakes in drawing trendlines how to know which trendlines are most likely to hold and which oneswill not support and resistance and how to use them to your advantage understanding trends and know when they may be starting or ending technical analysis-the best way to analyse your charts without toomany indicators (matter of fact, you don’t need any indicator at all butjust price)Having a good understanding of the points listed above is very essential forthe successful application of the Trendline Trading Strategy.HOW TO DRAW VALID TRENDLINESThere are two types of trendlines, the upward (or uptrend) trendline anddownward (downtrend) trendline. How do you draw trendlines? Easy, in 2simple steps. Here they are:STEP#1: Identify obvious peaks and troughs.STEP#2(A): Connect a minimum of 2 peaks (or highs) with a line from left toright and you have a downward trendline.STEP#2(B) Connect a minimum of 2 troughs (or lows) with a line and youhave an upward trendline.7www.forextrendlinetrading.com
8www.forextrendlinetrading.com
Key points you need to know: When you draw trendlines, they would usually fall into the outertrendline and the inner trendline.Outer trendlines are the usually the main trendlines drawn from muchsignificant peaks or troughs and they are quite obvious in the largertimeframes like 1hr and 4hr and upwards.Inner trendlines are trendlines drawn within or inside the outertrendlines and generally, you when you switch to smaller timeframes,you tend to get a lot of inner trendlines.These peaks and troughs that are used to draw inner trendlines aresometimes quite difficult to spot if you are in a larger timeframe like the4hr or the daily but when you switch to the 1hr or the 30min and 15min, the peaks and troughs become obvious to draw these innertrendlines. That is how simple it is to draw trendlines.Now, for most beginners, the confusion begins whenthey look at a chart and see too many lows and highsand they just cannot figure out which two they are goingto use to draw a trendline.The solution to this problem comes down to prioritizing which lows or highs touse and the general rule is this: For lows, the one with more higher candlesticks on its left and right willbe more significant than the one with lesser candlesticks on its left andrightAnd it works the same for highs except that it is completely opposite:you should be looking for more lower candlesticks. 9www.forextrendlinetrading.com
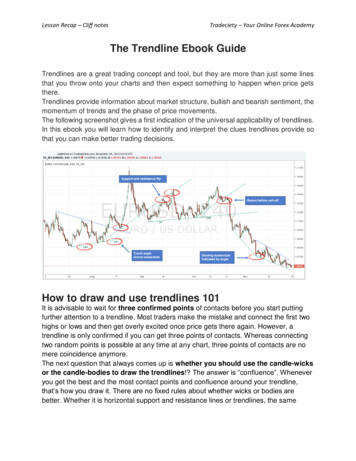
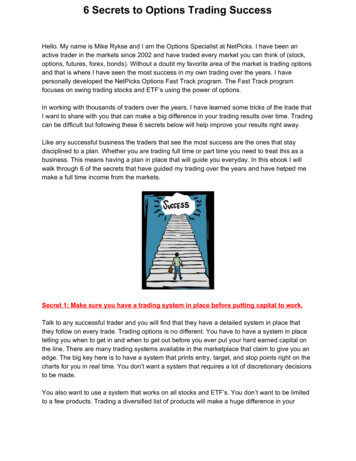
The chart below makes this concept a lot clearer.There are 3 significant lows on the chart (numbered 1, 2 & 3) and notice thaton each of these lows, there are more higher candlesticks on both the leftand the right sides of the low.In other words, you look for highs and lows that are easy to spot. Let meexplain further: When you select the 2 highs (for drawing downward trendline) or the 2lows (for drawing upward trendline) they must be visible or obvious toeveryone else. There should be no ambiguity. Everyone else must beable to able to see or spot them clearly.And if the lows or highs can be clearly seen and identified, that meansthat they are significant because that is where the market has beenobserved to reverse significantly.On the chart below, how many “visible” or obvious.AND, therefore significantlows can you find?I can see 4.can you?10www.forextrendlinetrading.com
Here they are.So there you have it.And this is what you get when you draw an upward trendline connecting thefirst two lows.and on the 3rd and the 4th low when price came back down totest the trendline, you could have entered long with very LOW risk and madegood amount of profit in each trade.Here is another one.Notice on the chart below, the Lows are obvious andtherefore easy to spot (significant) and the result is you get a nice upwardbounce when price came down tested the trendline that was drawn.11www.forextrendlinetrading.com
A downward trendline is trendline drawn when you connect a minimum of 2peaks or highs as shown below. Notice that the peaks or highs are obviousand are easily spotted by everyone.So now this should clear any confusions about deciding which high or lows touse to draw a trendline.12www.forextrendlinetrading.com
But I also notice that many great trade setups occur on trendlines drawn frominsignificant lows or highs.or from combination of both significant andinsignificant lows or highs.what can you say about that?If you are a beginner.to avoid the confusion, stick to only drawing trendlinesbased on significant highs (peaks) or lows(troughs). As you gain moreexperience and confidence, you can start trading off trendlines drawn oninsignificant lows or highs or combination of insignificant and significant lowsor highs.The chart below shows an example of this situation.These trendlines drawn from insignificant peaks or troughs are simply innertrendlines.It does take a bit of practice and skill to be able to draw inner trendlines whenit comes to picking which two points to use. The more you practice, the moreyou will be able to do this easily.VALID AND INVALID TRENDLINES A trendline is valid as long as it is not intersected significantly and pricecontinues to obey it.A trendline becomes invalid when it is intersected significantly and thiscould mean that the trend has now probably changed.How can you tell if a trendline is “intersected significantly” which could mean atrendline breakout or not?There is no exact formula to determine that, but here are 3 things that I look for:#1: The candlestick that intersected the trendline, has it CLOSED above or below it?13www.forextrendlinetrading.com
#2: The length of the body of the candlestick (if it is long or short) that closed abovethe downward trendline and below the upward trendline.#3: The CLOSE of the 1hr or the 4hr candlesticksI will explain in detail now.#1: The candlestick that intersected the trendline, has it CLOSED above or below it?If a candlestick closes above a downward trendline by a significant distancethen that may be a signal that the downward trendline is now violated.The opposite is also true for an upward trendline: if the candlestick closesbelow it significantly, that may be a signal that the upward trendline is nowviolated and the price would now be heading downward.If a candlestick just intersects but fails to close above/below adownward/upward trendline, then expect the trendline to be obeyed.#2: The length of the body of the candlestick (if it is long or short) that closed abovethe downward trendline and below the upward trendline.The longer the length of the body of the candlestick that closes above/below adownward/upward trendline, the greater the possibility that the trendline hasnow been violated.Note:If you see that a shorter length of the body of the candlestick that intersected the trendline thatclosed above/below a trendline, this is a likely indication that the market has lost its momentumand even though it has intersected the trendline and may close above/below it, there is greatpossibility that the price will continue to obey the existing trendline.You would need additional confirmation and the best way is the use of reversal candlesticks.More on that later.#3: The CLOSE of the 1hr or the 4hr candlesticks The close of 1hr and 4hr timeframe candlesticks are very important indetermining if the trendline is likely to be broken on not.If you see a 1hr candlestick closed below an upward trendline, there isa great chance that that trendline is now intersected and price willcontinue to move down.The opposite is also true for downward trendline.Generally, the 1hr close above or below a trendline hasmore significance than any other timeframe closes.That is why on many occasions, you see a trendline intersected significantly ina much smaller timeframe like the 5min, 15min or 30 min and you may thinkthat the trendline is intersected but then the 1hr candlestick eventually closes14www.forextrendlinetrading.com
above(or below it for downward trendline) and then you see price continue toobey the trendline.For example: This is the 5min chart showing the upward trendline beingintersected and couple of candlesticks closing below the trendline.The next chart is the 1hr chart of the same pair above showing the 1hrcandlestick(red) which intersected BUT closed above the upward trendline.And this is the chart showing what happened next as the result of the 1hrcandlestick close.15www.forextrendlinetrading.com
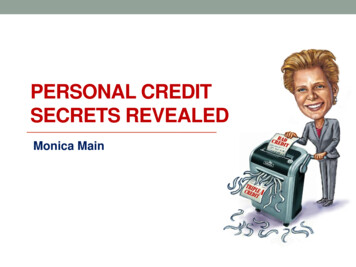
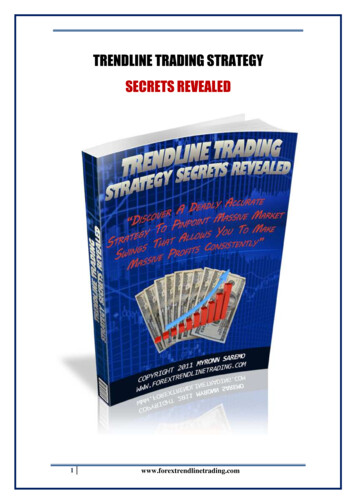
1hr & 4hr candlestick closes are very important, remember that.Do you understand what I’m showing you here?Ok, one more example of using the 1hr and 4hr closes then.In the 1hr chart below, notice that the downward trendline is intersectedsignificantly. Remember what I mentioned above about length of the body ofthe candlesticks? Looks like trendline is intersected significantly because the1hr candlestick closed significantly above the downward trendline.what doyou think?16www.forextrendlinetrading.com
About 3hrs later in the 4hr chart, this is what happened.Now, what do youthink is most likely to happen?And this is how it turned out.Can you see how important the closes of 1hr and 4hr closes are now? 17Start paying attention to the closes now especially when they happenaround trendline entry points.You need to also pay careful attention to the lengths of the bodies ofcandlesticks around trendline entry points because they will give youan indication of the sentiment of the market.www.forextrendlinetrading.com
On the chart below. there are 2 downward trendlines. In each instance,observe that the candlesticks that intersected the trendlines to the upsidewere very bullish candlesticks with very long body and they closedsignificantly above the trendlines resulting in the trendlines becoming invalid.Notice in the chart below that the candlestick that intersected and closedabove the trendline lacked upward momentum (very short body failing to closeeven more than 50% above the trendline) and what happened is the price
Trading in the Forex market is a challenging opportunity where above average returns are available to educate and experienced investors who are willing to take above