Transcription
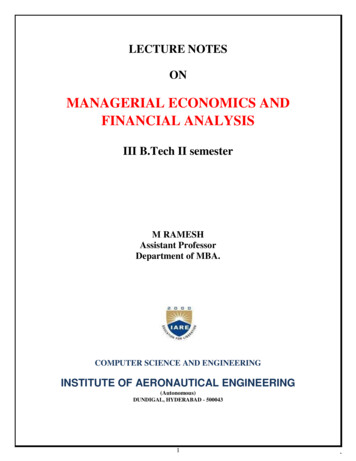
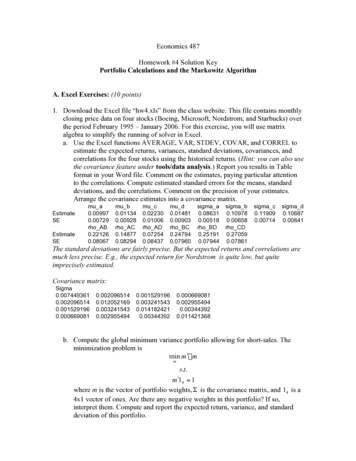
Economics 487Homework #4 Solution KeyPortfolio Calculations and the Markowitz AlgorithmA. Excel Exercises: (10 points)1. Download the Excel file “hw4.xls” from the class website. This file contains monthlyclosing price data on four stocks (Boeing, Microsoft, Nordstrom, and Starbucks) overthe period February 1995 – January 2006. For this exercise, you will use matrixalgebra to simplify the running of solver in Excel.a. Use the Excel functions AVERAGE, VAR, STDEV, COVAR, and CORREL toestimate the expected returns, variances, standard deviations, covariances, andcorrelations for the four stocks using the historical returns. (Hint: you can also usethe covariance feature under tools/data analysis.) Report you results in Tableformat in your Word file. Comment on the estimates, paying particular attentionto the correlations. Compute estimated standard errors for the means, standarddeviations, and the correlations. Comment on the precision of your estimates.Arrange the covariance estimates into a covariance matrix.EstimateSEEstimateSEmu a0.009970.00729rho AB0.221260.08067mu b0.011340.00928rho AC0.148770.08294mu c0.022300.01006rho AD0.072540.08437mu d0.014810.00903rho BC0.247940.07960sigma a0.086310.00518rho BD0.251910.07944sigma b0.109780.00658rho CD0.270590.07861sigma c0.119090.00714sigma d0.106870.00641The standard deviations are fairly precise. But the expected returns and correlations aremuch less precise. E.g., the expected return for Nordstrom is quite low, but quiteimprecisely estimated.Covariance 90810.0029554940.003443920.011421368b. Compute the global minimum variance portfolio allowing for short-sales. Theminimization problem ismin mʹ′Σmms.t.mʹ′14 1where m is the vector of portfolio weights, Σ is the covariance matrix, and 14 is a4x1 vector of ones. Are there any negative weights in this portfolio? If so,interpret them. Compute and report the expected return, variance, and standarddeviation of this portfolio.
51Std. Dev0.063847322No negative weights.c. Of the four stocks, determine the stock with the largest average historical return.Use this maximum average return as the target return for the computation of anefficient portfolio allowing for short-sales. That is, find the minimum varianceportfolio that has an expected return equal to this target return. The minimizationproblem ismin x ʹ′Σxxs.t.x ʹ′µ µ p , 0x ʹ′14 1where x is the vector of portfolio weights, µ is the vector of expected returns, andµ p , 0 is the target expected return. Are there any negative weights in thisportfolio? Compute and report the expected return, variance, and standarddeviation of this portfolio. Finally, compute and report the covariance between theglobal minimum variance portfolio and the above efficient portfolio using theformula cov( R p ,m , R p , x ) mʹ′Σx .Target portfolio 607variance0.013343763E[Rp]0.022302607Std. Dev0.115515209Cov(x,m)0.004076481The weights on Boeing and Nordstom are negative. This means an investor should shortsell them.d. Using the fact that all efficient portfolios can be written as a convex combinationof two efficient portfolios, compute efficient portfolios as convex combinations ofthe global minimum variance portfolio and the efficient portfolio computed inquestion 3. That is, computez α x (1 α ) mfor values of α between -1 and 2 (make a grid for α 1, 0.9,.,0,0.1,.,1.9,2 ).Compute and report the expected return, variance, and standard deviation of theseportfolios in a Table.
.51.61.71.81.92sigma mu . Plot the Markowitz bullet based on these efficient portfolios that you computedabove. On the plot, indicate the location of the minimum variance portfolio andthe location of the efficient portfolio that you found in part c. Paste this graph toyour Word file.
f. Compute the tangency portfolio assuming the risk-free rate is 0.005 (i.e.,r f 0.5% ) per month. That is, solvemaxtµ p ,t r fσ p ,ts.t.µ p ,t t ʹ′µσ 2p ,t t ʹ′Σtt ʹ′14 1where t denotes the portfolio weights in the tangency portfolio. Are there anynegative weights in the tangency portfolio? If so, interpret them. Compute andreport the expected return, variance, and standard deviation of the 076420.254611079ones1111constraint1std. Dev0.079704212E[Rp]0.017679002Sharpe Ratio0.159075684No negative weights.g. On the graph with the Markowitz bullet, plot the efficient portfolios that arecombinations of T-bills and the tangency portfolio. Indicate the location of thetangency portfolio on the graph. Paste this graph to your Word file.
h. For 4 bonus points, use the Benninga handout as a guide to compute and plot theMarkowitz bullet for the data in hw4.xls when there are no short sales allowed.On the same set of axes, plot the efficient frontiers with and without short salerestrictions.Calculate the tangency portfolio, imposing nonnegativity constraints on weights, for avariety of risk free rates. The result is that the efficient frontier is the same as with shortsales from the Global Min portfolio (which had only positive weights) up to a certainexpected return. Then, the efficient frontier is lower than the short sales case beyond thatpoint. See graph.
d. Using the fact that all efficient portfolios can be written as a convex combination of two efficient portfolios, compute efficient portfolios as convex combinations of the global minimum variance portfolio and the efficient portfolio computed in question 3. That is, compute z α x (1 α) m