Transcription
tradeguiderP R I S M Strategyfor trading & investing stocksWritten By Gavin HolmesHead Trader Wyckoff / Williams Investment PortfolioAuthor “Trading in the Shadow of the Smart Money”
Copyright, Legal Notice and Disclaimer:Copyright 2017 By Gavin Holmes. All rights reserved.This publication is protected under the US Copyright Act of 1976 and all other applicableinternational, federal, state and local laws, and all rights are reserved, including resalerights.No part of this publication may be reproduced, stored in a retrieval system, ortransmitted in any form or by any means, electronic, mechanical, photocopying,recording, scanning or otherwise, except as permitted under section 107 or 108 of theUS Copyright Act of 1976, without either the prior written permission of the publisher.All charts herein are provided with the permission of TradeGuider Systems International(www.tradeguider.com)Limit of Liability and Disclaimer of Warranty: The publisher has used its best efforts inpreparing this book, and the information provided herein is provided for educationalpurposes only. The publisher makes no representation or warranties with respect to theaccuracy or completeness of the contents of this book and specifically disclaims anyimplied warranties of merchantability or fitness for any particular purpose and shall in noevent be liable for any loss of profit or any other commercial damage, including but notlimited to special, incidental, consequential, or other damages.Trading Stocks, Commodities, Futures, Options on Futures, and retail off- exchangeforeign currency transactions involves substantial risk of loss and is not suitable for allinvestors. You should carefully consider whether trading is suitable for you in light ofyour circumstances, knowledge, and financial resources. You may lose all or more of yourinitial investment. Opinions, market data, and recommendations are subject to change atany time.
Important DisclaimerTrading Stocks, Options on Stocks, Futures, Options onFutures, and retail off-exchange foreign currencytransactions (FOREX) involves substantial risk of lossand is not suitable for all investors. Past performance,whether actual or indicated by historical tests ofstrategies, is no guarantee of future performance orsuccess. There is a possibility that you may sustain aloss equal to or greater than your entire investmentregardless of which asset class you trade (equities,options, futures or forex); therefore, you should notinvest or risk money that you cannot afford to lose.
The Wyckoff / VSA PRISM Strategy for trading andinvesting stocksBackgroundWhen I first met Tom Williams in the year 2000 and began to take an interest inthe financial markets, Tom made a statement I will never forget.He said, “Gav, the fact that you know absolutely nothing about trading andinvesting and have no pre conceived ideas will make you an excellent studentfor me to teach and one day you will be a great success in this business”.Looking back, it has been a great journey and it continues to be so, but beforeTom passed away in 2016 he had a wish.He said, “The biggest danger to a Human Being trading and investing in themarkets is actually themselves. We need to create an automated trading systemthat takes much of the analysis away from the Human Being and let thecomputer do the work. A computer does not have flaws in its logic”.Tom was describing to me what was in his mind. An automated Volume SpreadAnalysis trading system that found trade set ups based on the key principles ofWyckoff and computerized by Tom.For further details on the Volume Spread Analysis methodology go to Appendixone.This trading system would intuitively trade alongside and in harmony with the“Smart Money” players who move and manipulated all markets.For further details on Market Manipulation and the “Smart Money” go toAppendix two.It was during 2016 that our Head of Technology, Grigory Margolin, showed methe latest development of a product to be used in our hedge fund, called SMARTCenter Pro.The concept was simple. Find trade set ups based on Wyckoff / Volume SpreadAnalysis that are in harmony with the trend of multiple time frames using theproprietary tools in the TradeGuider software toolset.At the launch of SMART Center Pro, live at The CME Group Headquarters(Chicago Mercantile Exchange) in downtown Chicago in October 2016, we wereable to demonstrate live trading using the system using timeframes starting with
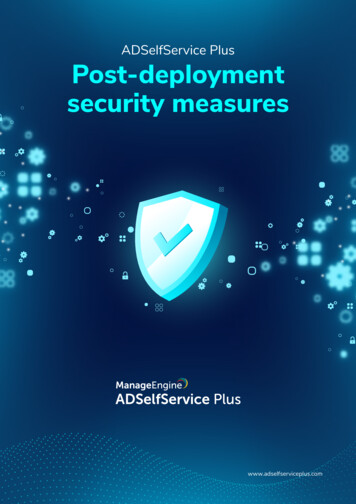
weekly charts, daily charts, four hour charts, hourly charts, fifteen, five and oneminute charts.This was by far the most successful launch of any TradeGuider software productin the 16 years since we started the business.The new stocks strategy that has been developed by our team was based onfeedback from customers, many of whom traded or invested stocks.The Trading ConceptThis trading strategy is built around the Tradeguider core tradingprocess: SCAN – CONFIRM – TRADE/INVEST WITH PRISMThe process starts with a scan of the sectors that make up the index or indexesyou are analysing, followed by a stock scan of the parent index and itsconstituents to find stocks that are in the strongest sector and acting strongerthan the index (for buying and investing or using CALL Options) and stocks thatare in the weakest sector and acting weaker than the index (for selling short orusing PUT Options).The sectors are the grouping of stocks by industry type and very often we seesector rotation throughout the year due to seasonal changes as well as otherfactors.For example, in the FTSE 350 London market there are 37 sectors and therewill be individual constituents in each sector.One of the most important things taught to us by legendary traders such as WD Gann and Richard D Wyckoff is not to fight the trend, especially the big trendseen on the monthly and weekly charts.Initially, the first Wyckoff / VSA sector scans all the sectors against the parentindex and produces a set of results that show the strongest sectors andweakest sectors. In this example we can see a scan of the S&P 500 sectors.
The second scan is now performed against the constituent stocks in the sectorsidentified against the parent index.So for instance, if the overall FTSE 350 (which will use as an example but thiswill apply to all worldwide markets) is in a bull move and clearly rising, andcertain sectors fail to rise with the index or in fact fall as the index rises wouldbe seen as very weak sectors. The scanner would then identify the stocks thatare the weakest in the weak sector and highlight these as potential short tradeopportunities, or use a PUT option strategy.The next time we have a downward correction in the parent index these stockswill lead the fall because they clearly have no support from "Smart Money".Now the opposite takes place for strong stocks. These stocks move up in a bullmove and when any corrective move to the downside happens these stocksrefuse to fall with the parent index or if they do have a corrective move thevolume is now very low, suggesting no selling pressure on the stock because"Smart Money" are supporting the stock.So the scanner will identify the top 5 strongest sectors and the bottom 5weakest sectors and then identify the stocks in the strongest sectors to buyand the weakest stocks to short in the weakest sectors.The scanner uses wave counts against the index from a setting of one to 5, andthe setting that was used by the late Tom Williams and now used by FundManager and Author, Gavin Holmes, is two wave counts.
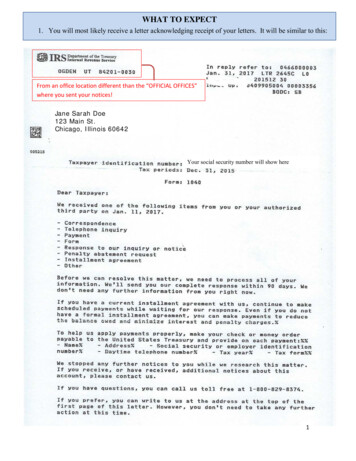
Here is an example of a stock scan of the S&P 500 showing us the top 10strongest and weakest stocks.Scan Confirm Trade – The Concept To scan your chosen market or markets using the Wyckoff / VSA stock andsector scanner that is built into the TradeGuider EOD software usingMetastock datafeed. To locate the strongest and weakest sectors in the index or indexes youhave scanned. To then locate the stocks in the sectors that are acting stronger or weakerthan the index. To identify trading opportunities by finding unusually high volume on achart (climactic action) followed by low volume (No Demand or NoSupply) at the same price level or when a trend has begun. To show visually clear trend alignment in multiple timeframes. To alert the trader/investor when a major VSA principle has been foundin any timeframe being monitored by the system.
To allow the trader/investor to monitor and scan hundreds of charts atone time so the system is “sniffing” out trading opportunities for thetrader to then analyse on the charts. To show when the market is in congestion using the proprietary tradingtools developed by TradeGuider Systems International. When the scanner is misaligned in multiple timeframes, no trade. When the scanner is aligned in multiple timeframes, possible VSA tradeset up. Visual and audible alerts in when trade set up located. Bar information window for bar by bar VSA analysis. Each VSA indicator has a number and a detailed description of marketconditions that caused the indicator to appear. Provide the ability for email alerts when charts give a VSA trade set up.The Time-framesTimeframes being monitored and scanned by system. 15 minute 60 minute chart 240 minute chart Daily chart Weekly chart Monthly chart6 timeframes total in PRISM stock investing strategy.Before going any furtherInstall TradeGuider EOD software with Metastock EOD datafeed for yourchosen market / markets to enable sector scans, stock scans and indicatorscans to be performed.Ensure you have one of the following intraday trading platforms installed:NinjaTrader, Sierra Chart or Tradestation with intraday data for stocks.
Ensure you have the Wyckoff VSA PRISM stock trading software installed onthe trading platform you have chosen.Don’t have it installed yet?Once the purchase is made go to the Tradeguider website atwww.tradeguider.com and log in to the Customer area using the login tab onthe menu bar. The installation guide and software download is available here.The Trading ProcessThe PRISM Strategy process consists of 2 stages: VSA Sector Scanning and stock scanning Process PRISM Trading ProcessFor each stage there are key rules and stepsVSA Sector Scanning ProcessOverviewTradeGuider Systems International together with Metastock are pleased topresent to you a new trading tool - Wyckoff / VSA Sector Scanning Process(WVSSP) - to select high probability stock trading candidates that are showingstrength or weakness.WVSSP is a twostep process based on the selection of appropriate Sectors,followed by analysis of stocks in those Sectors using trend and VSAMethodology. The steps are1. To find the strongest Sectors and Weakest Sectors in comparison to theparent index.2. To scan the constituent stocks in the list of Sectors found under Step 1identified against the parent index and find there strong and weakstocks.See above screenshot examples.The two stop step process is easy once the data has been downloaded by theMetastock downloader.
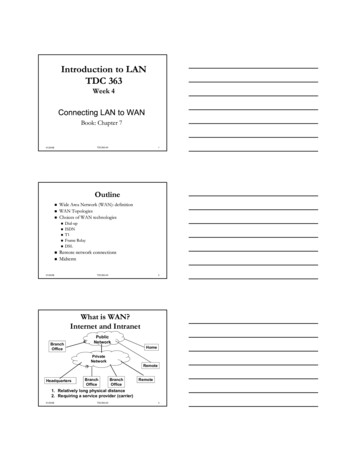
Rules and StepsPRISM Trading ProcessStep 1 – Sector Scan followed by Stock ScanPerform the sector and stock scan as detailed above using WVSSP to identifyyour stock trading candidates ready to input into the PRISM strategy.Rule 1.LIVE ACCOUNTSWe recommend you do not trade a live account until you have made 50 tradeson a trading simulator, recorded the results and taken screenshots of each tradewith risk amount, profit target and actual results achieved.TRADING STEP 1Input the stocks that have been identified by WVSSP and input them into yourchosen charting software supported by PRISM (TradeStation, Sierra Chart,Ninjatrader). The example below is TradeStation. Note we have two folders,strong and weak stocks identified by WVSSP.
TRADING STEP 2SCANStart up your software and right click the TG IconSelect the “Switch to VSA SMARTCenter “ optionThe SMART Center Pro display window will appear.Now you wait until you get an audible alert saying “trend alignment to the up /down side has arrived”.Remember the ideal candidate to trade has trend alignment in all thetimeframes being scanned.
Now you have received a trend alignment alert the system will begin flashingBLACK to show trend alignment has been detected in at least 4 of the 6timeframes being monitored. Click in the centre of the black box and PRISMimmediately begins “sniffing” Wyckoff / VSA trade set ups as you will see bythe automatic placement of a cross in either the green box (now sniffing forsigns of strength) or the red box (now sniffing for signs of weakness).Rule 3.THE TREND IS YOUR FRIEND.This strategy is optimised for trend alignment in multiple time frames that areset for investment trades, swing trade positions or longer term tradingstrategies.The strategy identifies the beginning of big accumulation and big distributioncaused by the “Smart Money” or flat trading and congestion (designated bygrey boxes in the scanner), when no trades should be taken.Note that the Sharp Shooter strategy is finding trend trades not market turningpoints. However the 8 key principles that will mark a market top or a bottomare included in this strategy and you should pay attention when these signalsappear:
Signs of WeaknessEnd of a Rising MarketBuying ClimaxTrap up-movePossible hidden sellingSigns of StrengthBag holdingShakeoutDemand overcoming SupplyPotential professional buyingRule 4.CONGESTIONWhen the scanner is showing grey boxes or a mix of green and red boxes, thisindicates congestion so no trade as we have no alignment, so ensure that asmany of the boxes as possible are the same colour and not as shown belowwhich indicates no trade yet.TRADING STEP 3CONFIRMFor a short tradeWait for a VSA Confirmation signal alert. You will get an audible messagesaying Sign of Strength / weakness has arrived”. The SMART Center Pro boxwill be flashing pink with an audible alert confirming a VSA indicator hasappeared in the trend. This should now be considered as a serious tra
transactions (FOREX) involves substantial risk of loss and is not suitable for all investors. Past performance, whether actual or indicated by historical tests of strategies, is no guarantee of future performance or success. There is a possibility that you may sustain a loss equal to or greater than your entire investment