Transcription
COVID-19 Mortality Modeling SurveySummary of ResultsUpdated July 9, 2020July 2020
2COVID-19 Mortality Modeling SurveySummary of ResultsUpdated July 9, 2020AUTHORSCynthia S. MacDonald, FSA, MAAA, SOAMarianne Purushotham, FSA, MAAA, LIMRAKorrel Crawford, SOACaveat and DisclaimerThis study is published by the Society of Actuaries (SOA) and LIMRA and contains information from a variety of sources. The study is for informationalpurposes only and should not be construed as professional or financial advice. The SOA does not recommend or endorse any use of the informationprovided in this study. The authors make no warranty, express or implied, or representation whatsoever and assumes no liability in connection with theuse or misuse ofthis study.Copyright 2020 by the Society of Actuaries and LL Global, Inc. All rights reserved.Copyright 2020 Society of Actuaries and LL Global, Inc.
3CONTENTSSection 1: Introduction .4Section 2: Survey Highlights .5Section 3: Mortality Modeling Survey Questions and Response Detail .63.1 Modeling . 63.2 Scenarios . 83.3 Claims/Impact .11Section 4: Acknowledgments .12About The Society of Actuaries .13About LIMRA .14Copyright 2020 Society of Actuaries and LL Global, Inc.
4COVID-19 Mortality Modeling SurveySummary of ResultsSection 1: IntroductionThe Society of Actuaries (SOA) has partnered with LIMRA and the American Council of Life Insurance (ACLI) toconduct a series of ‘sprint’ surveys on the coronavirus (COVID-19) pandemic and its potential impacts on the U.S. lifeinsurance industry. This report contains a summary of the results of the second survey on best practices inmonitoring and modeling the potential impact of COVID-19 mortality on life insurance industry claims. The surveywas directed at actuaries and/or risk management staff of insurers and reinsurers in the U.S. and Canada. Responsesto the survey were collected between 6/18/2020 and 6/24/2020. Thirty-six companies responded to the survey.Highlights of the survey responses are found in Section 2 and a summary of results for each question in the survey isfound in Section 3.Copyright 2020 Society of Actuaries and LL Global, Inc.
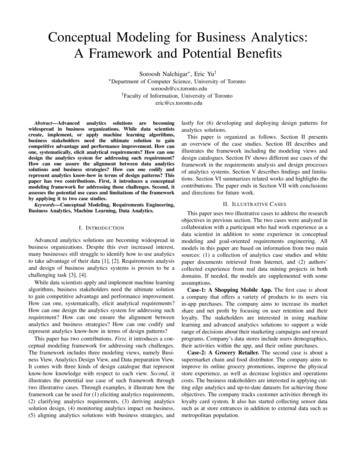
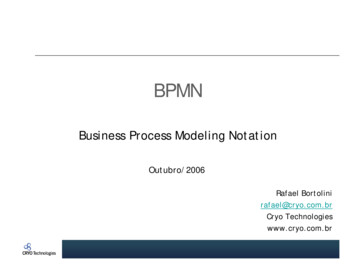
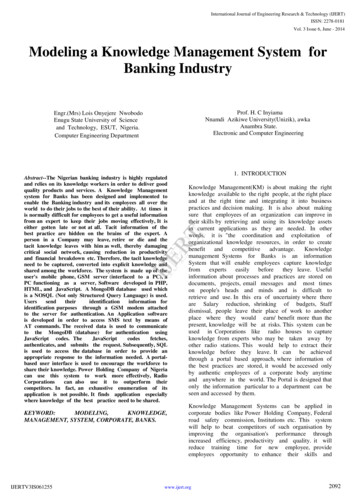
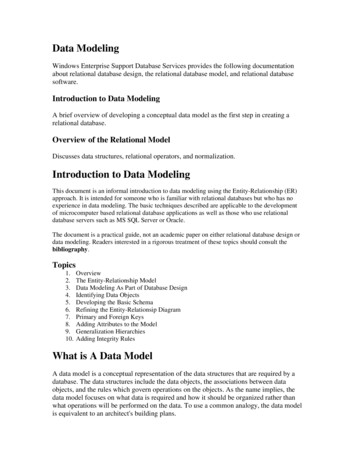
5Section 2: Survey HighlightsThis survey covered three topics related to COVID-19: mortality modeling, scenarios, and claims/impact.Modeling: Almost all of the respondents (92%) report modeling COVID-19 mortality scenarios. The top three metricsused in modeling are case fatality rate, infection rate, and mortality rate, all of which are employed by more thanhalf of the respondents. The top two factors incorporated in modeling are age and time period. Age is included bynearly all of the respondents, while time period is used by just over half. Many respondents also report takinggeography, gender, and multiple waves into account in their models. When asked to rank the importance of thesefactors, almost all ranked age in the top 3 and about a third ranked time period, geography and multiple waves inthe top 3.Scenarios: When asked about their view of the ultimate number of COVID-19 deaths for 2020 in the U.S. population,about 75% of the respondents indicated they expect 100,000 to 250,000 deaths in a baseline scenario and 250,000to one million deaths in a worst case scenario.For U.S. mortality rates for 2020, 56% of respondents anticipate a 0.5% mortality rate in a baseline scenario and80% anticipate less than 2.5%. In a worst case scenario, over 80% of respondents expect an overall mortality rate ofless than 10%. Most respondents vary mortality rates by age group and the variance in the mortality rate acrosscompanies is greatest at the older age groups.Claims / Impact: For COVID-19 mortality-related claims, 44% of respondents expect a 1% to 5% increase in deathclaims in 2020 over 2019 and 31% expect a 5% to 10% increase. Forty-four percent of the respondents sell grouplife insurance and of those respondents, one-half expect a 1% to 5% increase in death claims in 2020 over 2019.Copyright 2020 Society of Actuaries and LL Global, Inc.
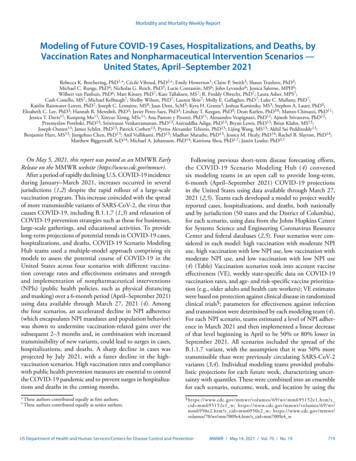
6Section 3: Mortality Modeling Survey Questions and Response DetailRESPONSES ARE PRESENTED AS THE NUMBER OF COMPANIES THAT SELECTED THE GIVEN RESPONSE.3.1 MODELING3.1.1 IS YOUR COMPANY MODELING COVID-19 MORTALITY SCENARIOS?3533# of Companies3025201510530YesNo3.1.2 WHICH OF THE FOLLOWING METRICS ARE YOU USING IN MODELING COVID-19 MORTALITY SCENARIOS?(SELECT ALL THAT APPLY)30# of Companies252522212015151110530Case fatality rate Infection rateMortality rate Infection fatality Exposure rates Susceptibility(# of deaths/# of (# of infections (# of deaths/full rate (# of deaths/ (# exposed to (# of infections/cases identified) /full population) population)# of infections)virus/full# exposed topopulation)virus)MetricCopyright 2020 Society of Actuaries and LL Global, Inc.
73.1.3 WHAT FACTORS ARE YOU INCORPORATING IN MODELING COVID-19 MORTALITY SCENARIOS?(SELECT ALL THAT APPLY)353330# of Companies25192017151515810635330Factor3.1.4 RANK THE FACTORS YOU ARE INCORPORATING IN MODELING COVID-19 MORTALITY SCENARIOS IN ORDEROF IMPORTANCE TO THE MODEL RESULTS WITH 1 BEING THE MOST IMPORTANT.(CHART INDICATES THE NUMBER OF COMPANIES THAT RATED THE GIVEN FACTOR IN THE TOP 3 IN TERMS OFIMPORTANCE.)353230# of Companies252015101413128553300Factor Ranked in Top 3Copyright 2020 Society of Actuaries and LL Global, Inc.
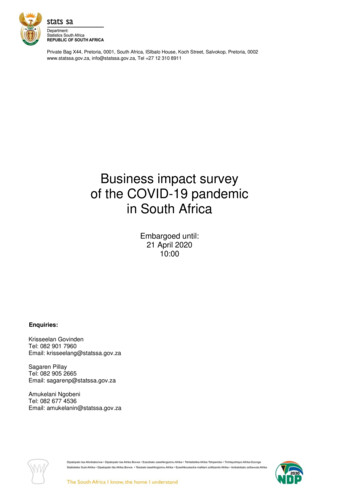
83.2 SCENARIOS3.2.1 WHAT IS YOUR VIEW OF DEATHS IN A BASELINE SCENARIO? [TOTAL US POPULATION]WHEN ANSWERING THE FOLLOWING QUESTION, RESPOND WITH YOUR VIEW ON THE ULTIMATE NUMBER OFDEATHS FROM COVID-19 FOR 2020 IN THE U.S. POPULATION (I.E. NOT SPECIFIC TO YOUR INSURED BLOCK).3028# of Companies252015107510Less than25,00025,000 but lessthan 100,000100,000 but lessthan 250,000250,000 butless than 1M1M or over# of Deaths3.2.2 WHAT IS YOUR VIEW OF DEATHS IN A WORST CASE SCENARIO? [TOTAL US POPULATION]WHEN ANSWERING THE FOLLOWING QUESTION, RESPOND WITH YOUR VIEW ON THE ULTIMATE NUMBER OFDEATHS FROM COVID-19 FOR 2020 IN THE U.S. POPULATION (I.E. NOT SPECIFIC TO YOUR INSURED BLOCK).3027# of Companies252015108510Less than25,00025,000 but less 100,000 but less 250,000 butthan 100,000 than 250,000less than 1M1M but lessthan 5M5M or over# of DeathsCopyright 2020 Society of Actuaries and LL Global, Inc.
93.2.3 WHAT IS YOUR VIEW OF MORTALITY RATES (DEATHS/FULL POPULATION) IN A BASELINE SCENARIO? [TOTALUS POPULATION]WHEN ANSWERING THE FOLLOWING QUESTION, RESPOND WITH YOUR VIEW ON THE ULTIMATE MORTALITY RATEFOR COVID-19 DEATHS FOR 2020 IN THE U.S. POPULATION (I.E. NOT SPECIFIC TO YOUR INSURED BLOCK).1Overall Population63Age 80 or over20554Not modeling77515% or over10% but less than 15%41160 but less than 8095% but less than 10%6392.5% but less than 5%120.5% but less than 2.5%Under 0.5%4140 but less than 6049184120 but less than 4032841Under Age 203105101520253035# of CompaniesCopyright 2020 Society of Actuaries and LL Global, Inc.
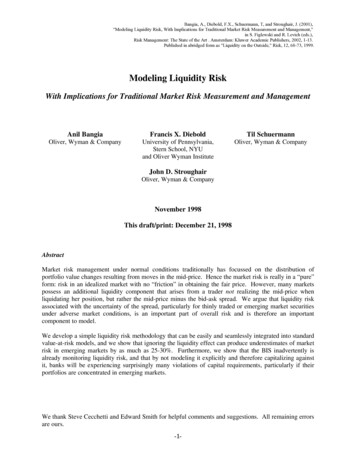
103.2.4 WHAT IS YOUR VIEW OF CASE MORTALITY RATES (DEATHS/FULL POPULATION) IN A WORST CASE SCENARIO?WHEN ANSWERING THE FOLLOWING QUESTION, RESPOND WITH YOUR VIEW ON THE ULTIMATE MORTALITY RATEFOR COVID-19 DEATHS FOR 2020 IN THE U.S. POPULATION (I.E. NOT SPECIFIC TO YOUR INSURED BLOCK).11Overall Population2281484Age 80 or overNot modeling845115% or over9510% but less than 15%5% but less than 10%4160 but less than 802.5% but less than 5%730.5% but less than 2.5%51244140 but less than 60Under 0.5%289124120 but less than 403111741Under Age 201095211015# of Companies2025Copyright 2020 Society of Actuaries and LL Global, Inc.
113.3 CLAIMS/IMPACT3.3.1 WHAT IS YOUR COMPANY’S CURRENT VIEW ON THE APPROXIMATE IMPACT OF COVID-19 ON YOURCOMPANY’S 2020 INDIVIDUAL LIFE INSURANCE MORTALITY CLAIMS?ASSUME % INCREASE IN DEATH CLAIMS IN DOLLARS OVER 2019181616# of Companies14121110865422200 but lessthan 1%1% but lessthan 5%5% but lessthan 10%10% or overOtherNot modeling% Increase in Claim 's3.3.2 WHAT IS YOUR COMPANY’S CURRENT VIEW ON THE APPROXIMATE IMPACT OF COVID-19 ON YOURCOMPANY’S 2020 GROUP LIFE INSURANCE MORTALITY CLAIMS?ASSUME % INCREASE IN DEATH CLAIMS IN DOLLARS OVER 20192520# of Companies20151058312200 but lessthan 1%1% but lessthan 5%5% but less 10% or overthan 10%% Increase in Claim 'sOtherNot modeling Don't havegroup lifeinsuranceCopyright 2020 Society of Actuaries and LL Global, Inc.
12Section 4: AcknowledgmentsThe SOA and LIMRA would like to thank the industry Low Interest Rate Task Force (established in January 2020 byLIMRA and ACLI) for their support in the design and development of the survey.We would also like to thank the many companies who participated in the survey.Allianz LifeAllstateAmica LifeBoston Mutual LifeCatholic United FinancialCNO FinancialColumbian Financial GroupCUNA Mutual GroupErie Family LifeGlobal Atlantic Financial GroupGlobe Life IncGPM Life Insurance CompanyGuardian Life Insurance CompanyKansas City LifeLiberty Bankers Insurance GroupMassMutualMutual of OmahaNational Life GroupNationwideNew York LifeNorthwestern MutualPan-American LifeProtective LifeSagicorSammons FinancialSBLISecurian FinancialState Farm LifeSymetraThe Independent Order of ForestersTransamericaUSAA Life CompanyUSAble LifeVantis Life Insurance CompanyWAEPAWoodmenLifeCopyright 2020 Society of Actuaries and LL Global, Inc.
13About The Society of ActuariesWith roots dating back to 1889, the Society of Actuaries (SOA) is the world’s largest actuarial professionalorganizations with more than 31,000 members. Through research and education, the SOA’s mission is to advanceactuarial knowledge and to enhance the ability of actuaries to provide expert advice and relevant solutions forfinancial, business and societal challenges. The SOA’s vision is for actuaries to be the leading professionals in themeasurement and management of risk.The SOA supports actuaries and advances knowledge through research and education. As part of its work, the SOAseeks to inform public policy development and public understanding through research. The SOA aspires to be atrusted source of objective, data-driven research and analysis with an actuarial perspective for its members,industry, policymakers and the public. This distinct perspective comes from the SOA as an association of actuaries,who have a rigorous formal education and direct experience as practitioners as they perform applied research. TheSOA also welcomes the opportunity to partner with other organizations in our work where appropriate.The SOA has a history of working with public policymakers and regulators in developing historical experience studiesand projection techniques as well as individual reports on health care, retirement and other topics. The SOA’sresearch is intended to aid the work of policymakers and regulators and follow certain core principles:Objectivity: The SOA’s research informs and provides analysis that can be relied upon by other individuals ororganizations involved in public policy discussions. The SOA does not take advocacy positions or lobby specific policyproposals.Quality: The SOA aspires to the highest ethical and quality standards in all of its research and analysis. Our researchprocess is overseen by experienced actuaries and non-actuaries from a range of industry sectors and organizations.A rigorous peer-review process ensures the quality and integrity of our work.Relevance: The SOA provides timely research on public policy issues. Our research advances actuarial knowledgewhile providing critical insights on key policy issues, and thereby provides value to stakeholders and decisionmakers.Quantification: The SOA leverages the diverse skill sets of actuaries to provide research and findings that are drivenby the best available data and methods. Actuaries use detailed modeling to analyze financial risk and providedistinct insight and quantification. Further, actuarial standards require transparency and the disclosure of theassumptions and analytic approach underlying the work.Society of Actuaries475 N. Martingale Road, Suite 600Schaumburg, Illinois 60173www.SOA.orgCopyright 2020 Society of Actuaries and LL Global, Inc.
14About LIMRAEstablished in 1916, LIMRA is a research and professional development not-for-profit trade association for thefinancial services industry. More than 600 insurance and financial services organizations around the world rely onLIMRA’s research and educational solutions to help them make bottom-line decisions with greater confidence.Companies look to LIMRA for its unique ability to help them understand their customers, markets, distributionchannels and competitors and leverage that knowledge to develop realistic business solutions.Visit LIMRA at www.limra.com.Copyright 2020 Society of Actuaries and LL Global, Inc.
insurance industry. This report contains a summary of the results of the second survey on best practices in monitoring and modeling the potential impact of COVID-19 mortality on life insurance industry claims. The survey was directed at actuaries and/or risk management staff of