Transcription
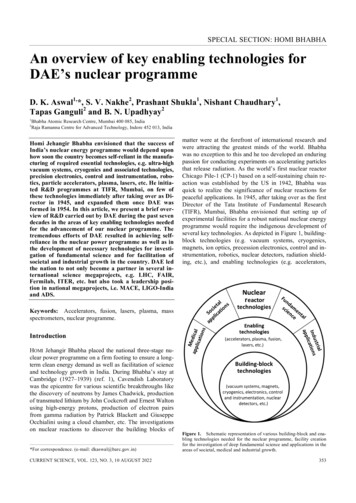
COSMIC RAY MEASUREMENTS IN THE ATMOSPHEREY.I. Stozhkov, N.S. Svirzhevsky, and V.S. MakhmutovLebedev Physical Institute, Russian Academy of Sciences, Moscow, RussiaAbstractWe present the main characteristics of cosmic ray population in the atmosphereand its variability (11-and 22-year solar cycle variations, solar protonsoriginating from powerful solar flares, energetic electron precipitation duringgeomagnetic disturbances and Forbush decreases of cosmic rays). Theexperimental data were obtained from the long-term cosmic ray monitoring inthe atmosphere from 1957 to now. The relationship between cosmic ray fluxes,and atmospheric processes are also discussed.1. METHOD OF REGULAR MEASUREMENTS OF COSMIC RAYS IN THE ATMOSPHERERegular cosmic ray measurements of cosmic rays are carried out with different instruments: ionizationchambers, meson telescopes, and neutron monitors on the ground. The idea of cosmic ray monitoring inthe atmosphere with radiosondes was suggested by Prof. S.N. Vernov in the middle of fifties and wasrealized by him and Prof. A.N. Charakhchyan in 1957. Now the cosmic ray monitoring cover a wide rangeof cosmic ray energy spectrum. It is schematically shown in Fig. 1.5cosmic ray fluxSCR4GCR3atm.2nm1789101112lg E, eVFig. 1 Schematic view of galactic and solar cosmic ray spectra (GCR, SCR, thick and thin curves accordingly). Thedotted vertical lines show the minimal energy of primary particles, which are detected by radiosondes in theatmosphere (E 0.1 GeV, upper arrow labeled atm) and by neutron monitors on the ground level (E 1.5 GeV, arrowwith nm). The ground-based ionization chambers and meson telescopes record the primary particles with E 9 GeV.The cosmic ray measurements in the atmosphere are made with standard radiosondes in which thecharged particle detectors are Geiger counter (hereafter counter) and telescope consisting of two countersand with 7 mm Al plate between them. Single counter records charged particles (electrons with energy
E 0.2 MeV, protons with E 5 MeV) and g-rays with E 0.02 MeV (efficiency 1 %). Telescope recordselectrons with E 5 MeV, protons with E 30 MeV and is not sensitive to g-rays. For the isotropic angulardistribution of particles in the upper hemisphere the geometrical factors of these detectors are 15.1 cm2and 17.8 cm2 sr.The long-term cosmic ray measurements in the atmosphere have been started at the several latitudeswith the different geomagnetic cutoff rigidities Rc in the middle of the last century and they are continuedtill now [1]. Every day or several times per week balloon flights have been made. Also several seaexpeditions had been organized where the measurements of cosmic ray fluxes in the atmosphere in a widerange of Rc had been made. Till now more than 70.000 balloon flights have been performed. In Table 1the sites and periods of observations are given. The cosmic ray fluxes are measured from the ground levelup to 30-35 km.Table 1. The sites and periods of cosmic ray measurements in the atmosphere.Site of observationsRc, GVPeriod of observationsMirny, AntarcticaGeographiccoordinates66 33 S; 93 00 0.0403.1963 - present timeTixie71 33 N; 128 54 0.402.1978 – 09.1987Murmansk region68 59 N; 33 05 0.607.1957 - present timeNorilsk69 00 N; 88 00 0.611.1974 – 06.1982Moscow region55 28 N; 37 19 2.407.1957 - present timeAlma-Ata43 12 N; 76 56 6.703.1962 – 02.1992Erevan40 10 N; 44 30 7.601.1976 – 06.1989Sea expeditions60 N - 60 S0.1-171963-65; 1968-72; 1975-76; 1986-87In the atmosphere the main part of charged particles is secondary ones except of altitudes h 20 kmin polar regions where there are low energy primary protons. Below h 20 km cosmic rays mainly consistof secondary electrons and muons.2. GALACTIC COSMIC RAYSTo study galactic cosmic ray flux variations in different energy intervals the magnetic field of the Earthand the atmosphere are used as separators of c ionship is given in Fig. 11. The correlation coefficient R(Nmax, IMF) -0.71 0.04.4572.5IMF,63-2Nmax, cm s-13.589210111.55565758595Year (after 190Fig.11. Time dependence of maximum cosmic ray flux in the polar atmosphere, Nmax (black curve) and IMF (graycurve). The monthly averaged data smoothed with the period of T 3 months were used. The data on IMF were takenfrom INTERNET: http://nssdc.gsfc.nasa.gov/omniweb/.3025h, km2015Start time, UT, dateGCR100822 11.09.01053 11.09.051942 11.09.00326 11.10.000.11.010.0-2100.0-1N, cm sFig. 12. Cosmic ray fluxes recorded in the atmosphere at Mirny in the Antarctic during the solar proton event on 9November 2000. Solid curve is a charged particle flux background produced by galactic cosmic rays in theatmosphere (GCR). Different symbols show the data obtained during the different flights of radiosondes (the dateand start time of launchings are given in the insert).
3. SOLAR COSMIC RAYS, PRECIPITATION, AND RADIOACTIVITYSince the beginning of cosmic ray measurements in the atmosphere in 1957 several tens of solar protonevents were recorded (e.g. [5]). As a rule such events are observed in the polar atmosphere where Rc arerather low (see Table 1). During solar proton events total cosmic ray flux at high altitudes in theatmosphere increases in several (sometimes in tens) times. As example, the solar proton fluxes generatedby solar flare on November 9, 2000 and recorded in the Earth’s atmosphere are given in Fig. 12. Solarproton fluxes were observed in the atmosphere at h 17 km and their values increase with altitude.100J( E), cm-2 s-1 sr-111032140.11001000E, MeVFig. 13. The energy spectra of solar protons on 9 November 2000. The start times of radiosonde launchings andexponents g of solar proton energy spectra I( E) E-g are given below: 1 –Date - 11.09.00, Start time (UT) - 8:22,g 7.2; 2 – Date - 11.09.00, Start time (UT) - 10:53, g 5.8; 3 – Date - 11.09.00, Start time (UT) - 13:36, g 7.8; 4 –Date – 11.10.00, Start time (UT) - 19:42, g 4.9.sunspot number2001081506100450019552solar proton event numberFrom these data the fluxes and energy spectra of solar flare particles in the energy range of E 100500 MeV were obtained. They are depicted in Fig. 13. In this solar proton event the particles with E 500MeV were not observed and this event was not recorded by neutron monitors. We note that the observedsolar proton “soft” energy spectra could be due to the additional acceleration of particles in theinterplanetary space by shock waves as it was happened in the past during the solar proton events inAugust 1972 [6].01965197519851995YearFig. 14. The time dependences of yearly number of the solar proton events recorded in the atmosphere (black pointsand right axes) and yearly sunspot number (open points and left axes).
353530302525h, kmh, kmFor the 45-year period of cosmic ray monitoring in the atmosphere 105 solar proton events wererecorded. In Fig. 14 the time dependence of the yearly number of these events and solar activity level(sunspot number) are shown. It is seen that the solar proton events mainly occur during the ascending anddescending phases of solar activity.20151009301510Start time UT Date125005.03.0520Start time UT Date125005.03.0505.05.00930005.05.000123-2 -1N, cm s4012-23-1N, cm sFig. 15. Precipitation of high energy electrons into the northern polar atmosphere recorded by single counter on 5March 2000 (left panel, black points). The background from galactic cosmic rays is shown by open points. Thetelescope recorded galactic cosmic ray background only (right panel). The inserts show the dates of radiosondeflights and launching times.During the geomagnetic disturbed periods in the polar atmosphere at high altitudes high-energyelectron precipitation events are detected [7, 8, 9]. Our northern polar station in Murmansk region is nearthe polar oval (McIlwain’s parameter L 5.6) where the precipitations are observed rather often. In Fig. 15the example of precipitation detected on November 2000 is shown. The counter records secondary g-raysproduced by precipitating electrons in the atmosphere.But at the same time the telescope records only the background from galactic cosmic rays and itallows to separate precipitation from solar proton events. It is significant that g-rays recorded in theatmosphere at h 25-35 km are produced by the precipitating electrons with E several MeV. The timedependence of the yearly precipitation number and the sunspot number are given in Fig. 16. Into theprecipitation data the corrections for patrol efficiency were introduced. The data obtained show that theprecipitation take place most often during the descending phase of solar activity (remind that solar protonevents are observed most often during the ascending and descending solar activity phases, see Fig. 14).This fact was established earlier in other papers [10]. The total number of precipitation recorded at thestation in Murmansk region during 1957-2000 equals 549 events. For almost the same period (1963-2000)at the Antarctic station Mirny (66 33 S; 93 00 ; Rc 0.04 GV; Lª11) 10 precipitation events wererecorded only.In Table 2 the yearly precipitation numbers for 20 - 23rd solar cycles are given. The last line in thisTable includes the ascending phase of 23rd solar activity cycle only.The regular monitoring of charged particle fluxes in the atmosphere provides the prompt control ofradiation conditions and allows to detect radiation clouds from nuclear explosions or nuclear plantfailures. In Fig. 17 and 18 the observations of radioactive clouds in the polar northern atmosphere and
over Moscow are shown as an examples. The excesses of particles over the cosmic ray backgroundrecorded by single counter were due to the radioactivity particles. The telescope data showed normalcount rate from cosmic rays only.A powerful surface nuclear explosion was produced near lake Lobnor in China on the 14th ofOctober 1970. In the atmosphere radioactive clouds were observed near Murmansk on October 25-26 (seeFig. 17) and on November 11-12, near Moscow and Alma-Ata on November 5 and 6. In the polar region itwas observed in the altitude range hª15-25 km and charged particle flux was increased in 7-8 times incomparison with the cosmic ray background. At the first registration the cloud had the shape of a disk withvertical size of nearly 4 km and horizontal size along the wind direction of 1100 km. The maximalactivity was equal 10-3 Bq/cm3 as measured at hª18-22 km. After 26 October the radioactive cloudpassed away from the observation site.A radioactive cloud in the atmosphere over Moscow was recorded on 12-14 April 1993 (see Fig.18). The cloud was seen at hª10-30 km and had the horizontal extension of nearly 1000 km and maximumactivity 10-4 Bq/cm3. We do not know this cloud origin but on 6 April the failure at the chemical plant inSiberia (Seversk town near Tomsk) occurred [11].A more dense cloud was observed over Moscow on the 27th of October 1999, the maximumactivity being 7 10-3 Bq/cm3 at h 15 km. The cloud horizontal extension was about 200 km. The source ofthis last cloud is unknown also.200801506010040502001955sunspot numberprecipitation number10001965197519851995YearFig. 16. The time variations of the yearly number of precipitation (black points) and sunspot number (open points). Theobservations were made at the northern polar station in Murmansk region (68 59 N; 33 05 ; Rc 0.6 GV; L 5.6) during the timeinterval of (6-12) UT.Table 2. The precipitation number in different solar activity cycles.solar cycle number,period20 (1964-1975)21 (1976-1985)22 (1986-1995)23 (1996-2000)sunspot numberper year58.882.978.546.9precipitationnumber (total)14414011885Precipitationnumber per year12141217
3025h, km2015background1602 LT 251802 LT 252207 LT 251157 LT 26105Oct.Oct.Oct.Oct.19719719719700510-21520-1N, cm sFig. 17. Charged particle fluxes in the northern polar atmosphere detected by single counter. At h 15 km the excessof flux over the cosmic ray background (solid gray line) is due to radioactive cloud particles produced by the nuclearexplosion in China on 14 October 1970. In the insert the legend on the balloon start time is given.40h, km30201000123-245-1N, cm sFig. 18. The count rate of single counter vs. altitude in the atmosphere over Moscow on 12-14 April 1993:æbackground from galactic cosmic rays; charge particle flux measurements on 13 April, launching local time 0830 LT( ), on 13 April, 1430 LT (D); on 14 April, 0830 LT ( );.4. COSMIC RAY FLUXES AND ATMOSPHERIC PROCESSESIf one compares the flux of solar electromagnetic radiation falling on the top of the atmosphere (Fsunª1010erg m-2 s-1) with the flux of cosmic ray energy (FCRª102 erg m-2 s-1 for particles with energy E 0.1 GeV)the evident conclusion could be made: the influence of charged cosmic ray particles on the processes inthe atmosphere is negligible in comparison with influence of the electromagnetic radiation coming fromthe Sun. However, let us imagine for a moment that cosmic rays stopped to intrude into the Earth’satmosphere. The ion production will be aborted and the global electric circuit will be destroyed. Theproduction of thundercloud electricity and lightning will be over. The cloud area will be decreased andprecipitation level will fall down.
The cosmic rays with energy E 0.1-15 GeV carry about 60 % of all cosmic ray energy and theseparticles constitute about 95 % of all cosmic ray flux. These particles undergo the influence of thegeomagnetic field in such way that the fluxes of primary cosmic rays at polar latitudes is higher than theones at equatorial regions as much as 30-35 times. In the atmosphere this difference is about 4 times.Below some aspects of influence of charged particle fluxes on atmospheric processes areconsidered (see also [12]). In our analysis we use the experimental data of the long-term measurements ofcosmic ray fluxes at the different atmospheric depths (from the Earth’s surface up to 30-35 km) and at thedifferent latitudes.4.1 The global electric circuit and ion productionIt is well known that the Earth has a negative electric charge about 6 105 C and the strength of electricfield produced by this charge near the Earth’s surface measured during fair-well weather equals Eª-130V/m (directed to the Earth’s surface). The value of average current flowing between equalizing layer to bein the ionosphere at the altitude hª55-80 km and the Earth’s surface is Iª10-12A/m2 [13, 14]. The light ionsprovide this current in the atmosphere. The ions are produced by cosmic particles (radioactivity of soilalso gives ions but only in the lower atmosphere at h 3 km). If cosmic ray flux changes the ion densitythe air conductivity changes also. The lightning in thunderstorms and precipitation form another branch ofthe closed electric circuit charging the Earth by negative electricity and providing electric current from theEarth to the ionosphere. The sketch of global electric circuit is given in Fig. 19 (see, e.g. [16]).IpRph 60 kmIm, RmEarthIgFig. 19. The sketch of the global electric circuit: h 60 km – equalizing layer; Ip, Rp and Im, Rm – atmospheric electriccurrents and resistances in the atmosphere at polar and middle latitudes, accordingly; Ig – current of thunderstormsand precipitation charging the Earth by negative electricity.The equation describing the relation between ion production rate, q, and their recombination in theatmosphere under quasi-state conditions is usually taken in the formq(h) a(h) [n(h)]2,(1)where n is ion concentration, a is recombination coefficient, h is atmospheric altitude [17]. Using theexperimental data on cosmic ray fluxes and ion concentrations in the atmosphere one can test the validityof this equation. In Fig. 20 the ion concentrations, n, and the charged particle fluxes, N, measured atseveral latitudes vs. altitude are presented [18]. From the experimental data on ion concentration n andcosmic ray flux N one can get that the ion production rate q is proportional to charged particle flux:q(h) ms N(h), where m and s are the number of air particles per cm3 and ionization cross-section. Thevalues of m and s are the same for different latitudes and depends on the altitude only. It isn’t true for thecase of polar latitudes and h 20 km where s is increased. At h 20 km the value of s equals 2*1018 cm2within 10-15 % for all latitudes.
17.3 5.30.6201000120.04201003.430h, kmh, km17.3 5.6330301n, 103 cm-32N, cm-2 s-1Fig. 20. Ion concentration n (left panel) and cosmic ray flux N (right panel) as a functions of altitude h in theatmosphere at the latitudes with the geomagnetic cutoff rigidities R c 17.3, 5.6, 5.3, 3.0, 3.4, 0.6 and 0.04 GV.Horizontal bars show the standard errors.Let us consider the measurements of n and N performed at two different latitudes. According to theexpression (1), we can construct the following ratio:[q1(h)/q2(h)] [a(h) n2(h)]1/[a(h) n2(h)]2,(2)where the subscripts 1 and 2 correspond to the latitudes with different geomagnetic cutoff rigidities Rc1 andRc2. Substituting msN(h) instead of q and taking (ms)1 (ms)2 and a1ªa2 (these suggestions are fulfilledin the atmosphere rather well) one can get[N1(h)/N2(h)] [n1(h)/n2(h)]2.(3)0.81Ratio0.60.420.230.051015 20h, km2530Fig. 21. The ratio of cosmic ray fluxes (curve 1), ion concentrations (curve 2) and squared ion concentrations (curve3) as a function of altitude. These values were calculated from the experimental data obtained at the equatorial(R c 17.3 GV) and middle (R c 3.3 GV) latitudes (see Fig.20) without any normalization of the data. The standarderrors are given by vertical bars.
In Fig. 21 the ratios of charged particle fluxes (curve 1-open points), ion concentrations (curve 2dark points), and squared ion concentrations (curve 3-crosses) obtained from the experimental datapresented in Fig. 20 are given. The data obtained in the equatorial (Rc 17.3 GV) and middle latitudes(Rc 3.3 GV) were used.It is seen that the ratio of cosmic ray fluxes (curve 1) coincides with ion concentration one (curve 2)and differs significantly from squared ion concentration ratio (curve 3). The details of such considerationare given in [18]. Thus, from this analysis the important conclusion must be made that the ion balance inthe atmosphere under quiet conditions is described by linear equation (not quadratic one)q(h) b(h) n(h),(4)where b(h) is the linear recombination coefficient. From the available experimental data on cosmic rays inthe atmosphere and light ion concentrations the value of b(h) and q(h) can be calculated for any site of theEarth and any level of solar activity.The ion production rate q can be written asq(h) N(h) s(h) r(h)/M,(5)where N(h) is cosmic ray flux at the altitude h, s is the ionization cross-section in air, r(h) is the airdensity and M is the average mass of air atom. The relationship between atmospheric electric current J,electric field strength E and conductivity l isJ l(h) E(h) n(h) k(h) E(h),(6)where k(h) is the mobility of light ions at the altitude h. Thus, using the expressions 4, 5 and 6 one canfindJ N(h) s(h) r(h) k(h) E(h)/[M b(h)].(7)2-20.62-1NN, cm s1.6-12J, 10 A m-20.661.2J0.580.80.541965 1970 1975 1980 1985YearFig. 22. The yearly average values of atmospheric electric current J(h) (from [19]) and cosmic ray flux N(h) at hª8km in the polar region.
On the right side of this equation all values are constant except cosmic ray flux N(h) and electricfield strength E(h). If one supposes that E(h) is constant or weakly changes in the periods of fair-wellweather then there is the linear relationship of cosmic ray flux N(h) and atmospheric electric current J(h).Such conclusion is confirmed by the experimental data showed in Fig.22. The data on J(h) were takenfrom [19]. The correlation coefficient between J(h) and N(h) is positive and equals r(J, N) 0.77 0.10.The correlation of atmospheric electric current and solar activity level (sunspot number W) is low,r(J,W) -0.32 0.22.4.2 Thundercloud electricity and lightning productionIn 1920 Wilson put forward fascinating idea suggested that thunderstorms act as a global generator ofelectric current maintaining the Earth’s electric charge [20]. Since the experimental evidences supportingthis hypothesis were obtained (see references in [14]). However, the mechanisms of thunderstormelectricity production (separation of negative and positive charges in thundercloud) and lightninggeneration are not clear till present time, although there are a number of hypotheses on the thundercloudelectricity origin (see, e.g., [21-23]). Cosmic rays could be responsible for the thunderstorm electrification[24].Secondary charged particle fluxes generated in the atmosphere by primary cosmic rays are the onlysource of positive and negative ion production in the atmosphere at h (2-3) km. The problem consists inthe spatial separation of negative and positive ions in the process of thundercloud formation. Thethunderclouds are formed from ascending wet air mass when the fronts of cold and warm air meet eachother. The air masses contain heavy ions (charged aerosols) because light ions produced by cosmic raysadhere to neutral heavy particles. As it is known from the observations the concentration of aerosols has amaximum in the low atmosphere near the Earth’s surface and its value is 2 104 cm-3. The half of theseparticles carries out the positive or negative electric charges [25]. Ascending air mass picks up theaerosols. During ascending air mass is cooled and processes of condensation of water molecules onneutral and charged aerosols take place. The condensation rate depends essentially on the charge presenceand its sign. Namely, negative charged aerosols grow faster than positive ones as much as 104 times [26,27]. The rapid growth of aerosols with negative charge makes them heavy and their lift with the rising airmass i
At each atmospheric pressure level, X, g/cm2, only particles with the energy E E a (or rigidity R R a) where E a is the atmospheric cutoff energy can contribute to the count rate of our detectors. The atmospheric cutoff E a or R a is defined by the characteristics of nuclear interactions of primary cosmic rays with air atoms. From the latitude .


![[AWS Black Belt Online Seminar] AWS X-Ray](/img/17/20200526-blackbelt-x-ray.jpg)