Transcription
Morbidity and Mortality Weekly ReportModeling of Future COVID-19 Cases, Hospitalizations, and Deaths, byVaccination Rates and Nonpharmaceutical Intervention Scenarios —United States, April–September 2021Rebecca K. Borchering, PhD1,*; Cécile Viboud, PhD2,*; Emily Howerton1; Claire P. Smith3; Shaun Truelove, PhD3;Michael C. Runge, PhD4; Nicholas G. Reich, PhD5; Lucie Contamin, MS6; John Levander6; Jessica Salerno, MPH6;Wilbert van Panhuis, PhD6; Matt Kinsey, PhD7; Kate Tallaksen, MS7; R. Freddy Obrecht, PhD7; Laura Asher, MPS7;Cash Costello, MS7; Michael Kelbaugh7; Shelby Wilson, PhD7; Lauren Shin7; Molly E. Gallagher, PhD7; Luke C. Mullany, PhD7;Kaitlin Rainwater-Lovett, PhD7; Joseph C. Lemaitre, MS8; Juan Dent, ScM3; Kyra H. Grantz3; Joshua Kaminsky, MS3; Stephen A. Lauer, PhD3;Elizabeth C. Lee, PhD3; Hannah R. Meredith, PhD3; Javier Perez-Saez, PhD3; Lindsay T. Keegan, PhD9; Dean Karlen, PhD10; Matteo Chinazzi, PhD11;Jessica T. Davis11; Kunpeng Mu11; Xinyue Xiong, MSc11; Ana Pastore y Piontti, PhD11; Alessandro Vespignani, PhD11; Ajitesh Srivastava, PhD12;Przemyslaw Porebski, PhD13; Srinivasan Venkatramanan, PhD13; Aniruddha Adiga, PhD13; Bryan Lewis, PhD13; Brian Klahn, MS13;Joseph Outten13; James Schlitt, PhD13; Patrick Corbett13; Pyrros Alexander Telionis, PhD13; Lijing Wang, MS13; Akhil Sai Peddireddy13;Benjamin Hurt, MS13; Jiangzhuo Chen, PhD13; Anil Vullikanti, PhD13; Madhav Marathe, PhD13; Jessica M. Healy, PhD14; Rachel B. Slayton, PhD14;Matthew Biggerstaff, ScD14; Michael A. Johansson, PhD14; Katriona Shea, PhD1,†; Justin Lessler, PhD3,†On May 5, 2021, this report was posted as an MMWR EarlyRelease on the MMWR website (https://www.cdc.gov/mmwr).After a period of rapidly declining U.S. COVID-19 incidenceduring January–March 2021, increases occurred in severaljurisdictions (1,2) despite the rapid rollout of a large-scalevaccination program. This increase coincided with the spreadof more transmissible variants of SARS-CoV-2, the virus thatcauses COVID-19, including B.1.1.7 (1,3) and relaxation ofCOVID-19 prevention strategies such as those for businesses,large-scale gatherings, and educational activities. To providelong-term projections of potential trends in COVID-19 cases,hospitalizations, and deaths, COVID-19 Scenario ModelingHub teams used a multiple-model approach comprising sixmodels to assess the potential course of COVID-19 in theUnited States across four scenarios with different vaccination coverage rates and effectiveness estimates and strengthand implementation of nonpharmaceutical interventions(NPIs) (public health policies, such as physical distancingand masking) over a 6-month period (April–September 2021)using data available through March 27, 2021 (4). Amongthe four scenarios, an accelerated decline in NPI adherence(which encapsulates NPI mandates and population behavior)was shown to undermine vaccination-related gains over thesubsequent 2–3 months and, in combination with increasedtransmissibility of new variants, could lead to surges in cases,hospitalizations, and deaths. A sharp decline in cases wasprojected by July 2021, with a faster decline in the highvaccination scenarios. High vaccination rates and compliancewith public health prevention measures are essential to controlthe COVID-19 pandemic and to prevent surges in hospitalizations and deaths in the coming months.Following previous short-term disease forecasting efforts,the COVID-19 Scenario Modeling Hub (4) convenedsix modeling teams in an open call to provide long-term,6-month (April–September 2021) COVID-19 projectionsin the United States using data available through March 27,2021 (2,5). Teams each developed a model to project weeklyreported cases, hospitalizations, and deaths, both nationallyand by jurisdiction (50 states and the District of Columbia),for each scenario, using data from the Johns Hopkins Centerfor Systems Science and Engineering Coronavirus ResourceCenter and federal databases (2,5). Four scenarios were considered in each model: high vaccination with moderate NPIuse, high vaccination with low NPI use, low vaccination withmoderate NPI use, and low vaccination with low NPI use(4) (Table) Vaccination scenarios took into account vaccineeffectiveness (VE), weekly state-specific data on COVID-19vaccination rates, and age- and risk-specific vaccine prioritization (e.g., older adults and health care workers); VE estimateswere based on protection against clinical disease in randomizedclinical trials§; parameters for effectiveness against infectionand transmission were determined by each modeling team (4).For each NPI scenario, teams estimated a level of NPI adherence in March 2021 and then implemented a linear decreaseof that level beginning in April to be 50% or 80% lower inSeptember 2021. All scenarios included the spread of theB.1.1.7 variant, with the assumption that it was 50% moretransmissible than were previously circulating SARS-CoV-2variants (3,4). Individual modeling teams provided probabilistic projections for each future week, characterizing uncertainty with quantiles. These were combined into an ensemblefor each scenario, outcome, week, and location by using the* These authors contributed equally as first authors.† These authors contributed equally as senior authors.§ htm?scid mm695152e1 w; m?s cid mm6950e2 w; m?s cid mm7009e4 wUS Department of Health and Human Services/Centers for Disease Control and PreventionMMWR / May 14, 2021 / Vol. 70 / No. 19719
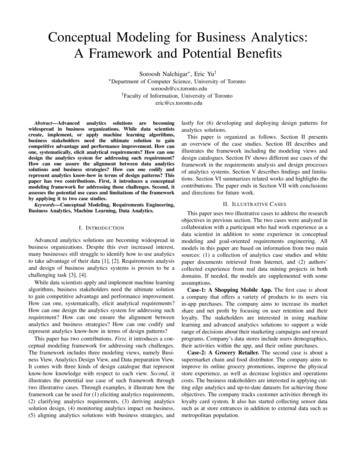
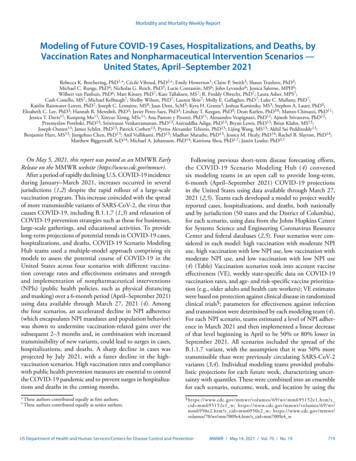
Morbidity and Mortality Weekly ReportTABLE. COVID-19 projection scenarios* — United States, March 27–September 25, 2021Vaccination and NPIsModerate NPI use; moderate reduction in NPILow NPI use; high reduction in NPIHigh vaccination (high VE, administration, and vaccine coverage)Moderna/Pfizer (2 doses)75%/95% VE against symptoms†50M 1st doses administered monthlyduring Apr–Sep 2021§Johnson & Johnson (1 dose)70% VE against symptoms†10–20M doses administered monthly(Apr: 10M, May: 15M, Jun–Sep: 20M)§Vaccination coverage per group¶Maximum 90%NPIsEstimated NPI levels in Mar 2021 are gradually reducedby 50% during Apr–Sep 2021Low vaccination (low VE, administration, and vaccine coverage)Moderna/Pfizer (2 doses)50%/85% VE against symptoms†45M 1st doses administered monthlyduring Apr–Sep 2021§Johnson & Johnson (1 dose)60% VE against symptoms†5M doses administered monthlyduring Apr–Sep 2021§Vaccination coverage per group¶Maximum 75%NPIsEstimated NPI levels in Mar 2021 are gradually reducedby 50% during Apr–Sep 202175%/95% VE against symptoms†50M 1st doses administered monthlyduring Apr–Sep 2021§70% VE against symptoms†10–20M doses administered monthly(Apr: 10M, May: 15M, June–Sep: 20M)§Maximum 90%Estimated NPI levels in Mar 2021 are gradually reducedby 80% during Apr–Sep 202150%/85% VE against symptoms†45M 1st doses administered monthlyduring Apr–Sep 2021§60% VE against symptoms†5M doses administered monthlyduring Apr–Sep 2021§Maximum 75%Estimated NPI levels in Mar 2021 are gradually reducedby 80% during Apr–Sep 2021Abbreviations: M million; NPI nonpharmaceutical interventions; VE vaccine effectiveness.* Scenarios were defined to control for uncertainty in two specific factors: vaccination and adherence to NPIs with high/moderate and low levels for each. All scenariosincluded the B.1.1.7 variant and assumed that it was 50% more transmissible than previously circulating SARS-CoV-2 variants. All other transmission and outcomeassumptions were decided by the six modeling teams.† VE is defined as vaccine effectiveness against symptomatic disease 2 weeks after administration, based on clinical trials. For 2-dose vaccines, the first VE representsprotection 2 weeks after the 1st dose. Assumptions about effectiveness and affects on other outcomes (e.g., infection, hospitalization, and death) were left to thediscretion of individual teams. Five teams assumed that VE against infection was the same as VE against symptomatic disease, and one team assumed lower VEagainst infection; details on model structure and assumptions are available at MIDAS Network COVID-19 Scenario Modeling Hub. Accessed April 19, 2021. modeling-hub§ Vaccine doses reflect published manufacturing capacity estimates in the high vaccination scenarios and a continuation of the pace of vaccination observed at theend of March 2021 in the low vaccination scenarios.¶ If the maximum level of vaccination specified (e.g., 75% or 90%) was reached in a population group during the projection period, models assume that no morevaccination occurs in that group. Past reported vaccine coverage up to March 27, 2021, can exceed these levels.720MMWR / May 14, 2021 / Vol. 70 / No. 19FIGURE 1. Weekly projections of reported numbers of cases (A),hospitalizations (B), and deaths (C)* under four scenarios representingdifferent levels of vaccination and nonpharmaceutical interventionadherence — United States, March 27–September 25, 2021A. Cases2,000,000Low vaccination, Low NPILow vaccination, Moderate NPIHigh vaccination, Low NPIHigh vaccination, Moderate NPI1,500,000No. per weekmedian across teams for each quantile (4,6). The individualmodels differed substantially in structure and design (4), butall accounted for age groups, enabling prioritization of vaccination based on federal and state guidelines.In all four scenarios, COVID-19 cases were projected toincrease through May 2021 at the national level because ofincreased prevalence of the B.1.1.7 variant and decreasedNPI mandates and compliance (Figure 1). A sharp declinein cases was projected by July 2021, with a faster decline inthe high-vaccination scenarios. Increases in hospitalizationsand deaths (Figure 1), although more moderate, were alsoprojected. A peak of 7,000–11,100 weekly deaths nationwidewas projected in May (range 5,382–15,677, which includesthe central 50% of the projected distributions for all scenariosin the ensemble). The larger increases in cases relative to hospitalizations and deaths were attributable to higher vaccinationcoverage among groups with higher risk for severe COVID-19.Moderate NPI use reduced cases and deaths in both the highand low vaccination scenarios, compared with low NPI use. Theeffect of maintaining moderate levels of NPI adherence was largerin the low vaccination scenarios, illustrating the counterbalance between and complementary effects of the two strategies(Figure 2). When low vaccination coverage was combined with1,000,000500,0000Projections beginMar 27, 2021Nov Dec Jan Feb Mar Apr May Jun Jul Aug Sep1111111111120202021DateSee footnotes on the next page.US Department of Health and Human Services/Centers for Disease Control and Prevention
Morbidity and Mortality Weekly ReportFIGURE 1. (Continued) Weekly projections of reported numbers of cases(A), hospitalizations (B), and deaths (C)* under four scenariosrepresenting different levels of vaccination and nonpharmaceuticalintervention adherence — United States, March 27–September 25, 2021120,000B. HospitalizationsLow vaccination, Low NPILow vaccination, Moderate NPIHigh vaccination, Low NPIHigh vaccination, Moderate NPINo. per week90,00060,000Increases in COVID-19 cases in March and early April occurreddespite a large-scale vaccination program. Increases coincidedwith the spread of SARS-CoV-2 variants and relaxation ofnonpharmaceutical interventions (NPIs).What is added by this report?Data from six models indicate that with high vaccinationcoverage and moderate NPI adherence, hospitalizations anddeaths will likely remain low nationally, with a sharp decline incases projected by July 2021. Lower NPI adherence could leadto substantial increases in severe COVID-19 outcomes, evenwith improved vaccination coverage.What are the implications for public health practice?High vaccination coverage and compliance with NPIs areessential to control COVID-19 and prevent surges in hospitalizations and deaths in the coming months.30,0000Projections beginMar 27, 2021Nov Dec Jan Feb Mar Apr May Jun Jul Aug Sep1111111111120202021Date25,000C. DeathsLow vaccination, Low NPILow vaccination, Moderate NPIHigh vaccination, Low NPIHigh vaccination, Moderate NPI20,000No. per weekSummaryWhat is already known about this topic?15,00010,000low NPI adherence, cumulative cases, hospitalizations, anddeaths were substantially higher compared with other scenarios.The largest differences among scenarios was in the cumulativeexcess percentage of hospitalizations. Differences in deaths werelower because many of the groups at highest risk were already vaccinated at the beginning of the projection window. Differencesin cases were relatively small because in all scenarios a substantialnumber of new cases occurred.Whereas the benefits of increased control measures variedsubstantially between models, the largest excess percentagesin estimated effects for each model were consistently foundin scenarios with the lowest NPI use and vaccination levels(Figure 2). Considerable range in state-specific projectionswas observed (Figure 2), suggesting that some states couldreach levels of disease similar to those observed in late 2020in scenarios with lower use of NPIs.5,0000DiscussionProjections beginMar 27, 2021Nov Dec Jan Feb Mar Apr May Jun Jul Aug Sep1111111111120202021DateAbbreviation: NPI nonpharmaceutical intervention.* Historical data are shown as filled points, curves represent ensembleprojections based on six models, and the grey area represents the maximumand minimum of the 50% projection intervals among all four scenarios. Verticalarrows represent the last date of observations used in the projections.Observations available after projections were made are shown as open points.Projection intervals are based on the 25th percentile of the more optimisticscenario (high vaccination and moderate NPI use) and the 75th percentile ofthe m
Morbidity and Mortality Weekly Report . 720 MMWR / May 14, 2021 / Vol. 70 / No. 19 US Department of Health and Human Services/Centers for Disease Control and Prevention