Transcription
Conceptual Modeling for Business Analytics:A Framework and Potential BenefitsSoroosh Nalchigar , Eric Yu† Departmentof Computer Science, University of Torontosoroosh@cs.toronto.edu† Faculty of Information, University of Torontoeric@cs.toronto.eduAbstract—Advanced analytics solutions are becomingwidespread in business organizations. While data scientistscreate, implement, or apply machine learning algorithms,business stakeholders need the ultimate solution to gaincompetitive advantage and performance improvement. How canone, systematically, elicit analytical requirements? How can onedesign the analytics system for addressing such requirement?How can one assure the alignment between data analyticssolutions and business strategies? How can one codify andrepresent analytics know-how in terms of design patterns? Thispaper has two contributions. First, it introduces a conceptualmodeling framework for addressing those challenges. Second, itassesses the potential use cases and limitations of the frameworkby applying it to two case studies.Keywords—Conceptual Modeling, Requirements Engineering,Business Analytics, Machine Learning, Data Analytics.I. I NTRODUCTIONAdvanced analytics solutions are becoming widespread inbusiness organizations. Despite this ever increased interest,many businesses still struggle to identify how to use analyticsto take advantage of their data [1], [2]. Requirements analysisand design of business analytics systems is proven to be achallenging task [3], [4].While data scientists apply and implement machine learningalgorithms, business stakeholders need the ultimate solutionto gain competitive advantage and performance improvement.How can one, systematically, elicit analytical requirements?How can one design the analytics system for addressing suchrequirement? How can one ensure the alignment betweenanalytics and business strategies? How can one codify andrepresent analytics know-how in terms of design patterns?This paper has two contributions. First, it introduces a conceptual modeling framework for addressing such challenges.The framework includes three modeling views, namely Business View, Analytics Design View, and Data preparation View.It comes with three kinds of design catalogue that representknow-how knowledge with respect to each view. Second, itillustrates the potential use case of such framework throughtwo illustrative cases. Through examples, it illustrate how theframework can be used for (1) eliciting analytics requirements,(2) clarifying analytics requirements, (3) deriving analyticssolution design, (4) monitoring analytics impact on business,(5) aligning analytics solutions with business strategies, andlastly for (6) developing and deploying design patterns foranalytics solutions.This paper is organized as follows. Section II presentsan overview of the case studies. Section III describes andillustrates the framework including the modeling views anddesign catalogues. Section IV shows different use cases of theframework in the requirements analysis and design processesof analytics systems. Section V describes findings and limitations. Section VI summarizes related works and highlights thecontributions. The paper ends in Section VII with conclusionsand directions for future work.II. I LLUSTRATIVE C ASESThis paper uses two illustrative cases to address the researchobjectives in previous section. The two cases were analyzed incollaboration with a participant who had work experience as adata scientist in addition to some experience in conceptualmodeling and goal-oriented requirements engineering. Allmodels in this paper are based on information from two mainsources: (1) a collection of analytics case studies and whitepaper documents retrieved from Internet, and (2) authors’collected experience from real data mining projects in bothdomains. If needed, the models are supplemented with someassumptions.Case-1: A Shopping Mobile App. The first case is abouta company that offers a variety of products to its users viain-app purchases. The company aims to increase its marketshare and net profit by focusing on user retention and theirloyalty. The stakeholders are interested in using machinelearning and advanced analytics solutions to support a widerange of decisions about their marketing campaigns and rewardprograms. Company’s data stores include users demographics,their activities within the app, and their online purchases.Case-2: A Grocery Retailer. The second case is about asupermarket chain and food distributor. The company aims toimprove its online grocery promotions, improve the physicalstore experience, as well as decrease logistics and operationscosts. The business stakeholders are interested in applying cutting edge analytics and up-to-date datasets for achieving thoseobjectives. The company tracks customer activities through itsloyalty card system. It also has started collecting sensor datasuch as at store entrances in addition to external data such asmetropolitan population.
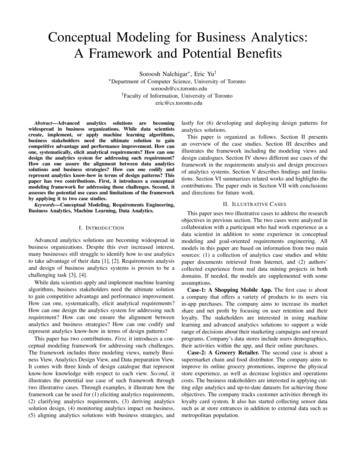
.Business ViewNew app enteringthe marketClick throughrate (%) # ofactiveusersAchieve highperformance throughpush notificationsDQDDecision onreceivers of theemailQQWhat are [the mostrelevant products foreach user]?.Decision onreceivers of thenotificationsDDecision oncontent of theemailsDanswersQDDecision onusers to targetDecision onrewards to offerQWho are[the users]?.answersanswersanswersUser Clustering Model type: Logical rules input: User's demographics output: Product(s), Lift, Confidence usageFrequency: Weekly updateFrequency: Quarterly learningPeriod: 60 months type: Predictive model input: User profile, Products output: Click probability usageFrequency: Weekly updateFrequency: Quarterly learningPeriod: Last 12 months type: GroupigOfRecords (clusters) input: User demographics, click data output: User cohorts usageFrequency: Monthly updateFrequency: Monthly learningPeriod: Last 6 months Speed oflearningORData Preparation ViewUser- User ID- Age inputs- Gender- Country- Account length- Device- Operating system1.1Activity- User ID- Timestamp- Action- Product IDLegendSELECT User ID, MAX(Timestamp)AS Last activity GROUP BY (UserID)DEvaluatesinputsAggregationinputsBusiness nswers type: Predictive Model input: User groups, factors output: Regression coefficients usageFrequency: Weekly updateFrequency: Bi-yearly learningPeriod: Last 60 monthsScalability Tolerance tomissing values Describe data intothe feature spaceJoinFilterInnerJoin onProduct IDNaïvebayesUse linearkernel functionSortInnerJoin (User.UserID Activity.UserID)SortBy (User ID,Timestamp) ASCAge category CASE WHEN (age 18) AND(age 29) THEN Young .InnerJoin onUser IDSituation(External)IndicatorInfluenceChurn VariablesCreate utputsCreate columnFor each user: Session Count if(t current – t previous 30 min)For each user, Churn Y if(date – Last visit) 90 days- ID- Account length- Country- Age- Operating system- Device- Count of sessions- Total pay- Churn (Y/N)Data Preparation ViewAnalytics Design ViewInsightis required forNeuralnetworkUse polynomialkernel functionSELECT User ID, SUM(Buy Price) ASTotal Pay GROUP BY (UserID)JoinWHERE (date – Lastactivity) 60 monthsSensitivity AggregationWHERE Action PurchaseFilterDiscretization DecisiontreesoutputsUnderstandabilityof resultsClassification of[user profiles, purchases]Support vectormachine (SVM)Use Gaussiankernel function generates.ANDInterpretabilityPredict[user churn]Speed oflearningis required for- Transaction ID- Age category- Device- Country- Product ID.Robustness Tolerance tonoisy data% of redundantrules. Demographic ProductProduct*MaintainabilityFP-GrowthECLAT- Product ID- Product Name- Product Vendor- Quantity in Stock- Buy Price-Dealing withoverfittingAccuracyApriori UsabilityDescribe[user behaviour]Discover Patterns in[user purchases]generatesEngagement-Level Regression Model.Analytics Design ViewWho are [the users thatwill leave the eco-system]?What are [the factorsthat hurt each usergroup engagement]?Users' Click Probability ModelStorage(memory)QQWhat are [the mainactivities for eachuser group]?User-Product Association Rules ModelTotal # ofrulesANDWhat are [the rewards to reengage users that have bestconversion]?Q type: Predictive model input: User profile, Purchases output: Churn? (Y/N) usageFrequency: Weekly updateFrequency: Quarterly learningPeriod: Last 12 monthsWhen to [take actionand re-engage thechurned users]?QANDanswersUser Churn Prediction ModelANDWho will be [tapingon the notification?]Who will be[clicking on the emailcontent]?Average timein app (min)DANDLow switchingcosts to customersANDDecision on userengagementstrategiesAND.OR Average number of repeatedpurchaseImprove customerloyaltyEngage usersinside the ecosystemTotal # ofinstallationsORAchieve highperformance throughemail campaignsAverageactivity periodANDEngage usersoutside theeco-systemConversionrateBouncerate (%)Improve tity- PKData flowNoteInput/outputFig. 1. Fragments of the three modeling views for Case-1. Due to space limitation, the Analytics Design View and the Data Preparation View are showingthe solution for only two (out of eight) question goals in the Business View.
III. OVERVIEW OF THE F RAMEWORKA. Modeling ViewsThe proposed framework includes three complementarymodeling views: Business View, Analytics Design View, andData Preparation View. These views, while having differentfocuses and serving different purposes, are linked to each otherand bridge the gap between strategic goals, machine learningalgorithms, and data tables.1) Business View: This view aims to (i) facilitate the elicitation and clarification of analytics requirements in businesscontexts, (ii) support analysis of those requirements (e.g.,prioritization), and (iii) ensure the alignment of business andanalytics strategies. The main modeling elements are strategicgoals, decision goals, question goals, insights, indicators,influences, and situations.Strategic Goals, adopted from the Business IntelligenceModel (BIM) language [5], symbolize business objectives andstrategies. In Figure 1, Improve customer retention is anexample of a strategic goal. Strategic goals are refined intolower-level goals through decomposition links.Strategic goals are decomposed into one or more DecisionGoals. Decision goals represent the decisions that need to bemade towards achieving the strategic goals. They symbolizethe decisions that (will be) are supported by the (to-be) analytics system. In Figure 1, Decision on content of the emailsis an example of a decision goal. It shows that in order toAchieve high performance through email campaigns, thecorresponding actor needs to make the Decision on contentof the emails to be sent to the target users.A decision goal can be decomposed into one or moreQuestion Goals. Question goals capture the “needs-to-know”of the stakeholders towards decisions to be made. They represent business questions that once answered (using machinelearning algorithms), result in achieving decision goals andhence enable data-driven decision support towards strategicgoals. Question goals are analyzed in terms of Type, Topic,Tense, and Frequency. Question type denotes the questionphrase (what, who, when, where, why, how). Question topiccaptures the focus of analysis and reveals related parts ofenterprise data stores for the problem at hand. Question tense(past, present, future) represents the temporal aspect of thefocus of the analysis. In many cases, specifying the tensefacilitates finding an analytics family of techniques that is mostrelevant to the business needs. Question frequency indicateshow frequent the corresponding actors need and answer forthe question goal. In Figure 1, What are the most relevantproducts for each user group? is an example of a questiongoal. It shows that in order to make the Decision on contentof the emails, the corresponding actor1 needs to know theproducts that are more relevant for each group/cluster ofusers. The Business Questions Catalogue (introduced later inSection III-B1) provides project team and/or stakeholders witha wide range of question goals and their associated analyticstechniques to select from.1 Actorsare not shown here due to space limitations.A question goal is answered by (i.e., satisfied by) oneor more Insights. Insight elements characterize the type ofknowledge/patterns/findings that need to be extracted fromdatasets such that the question goal is answered. They areconnected to question goals through the answers links. Insightsare differentiated into subtypes including Predictive Models,Probability Distributions, Grouping of Records (e.g., clusters),Logical Rules (e.g., association rules), and Diagrams (e.g.,correlation heat-maps). The type of insight suggests relevantmachine learning algorithms that can be applied fro theproblem at hand. In Figure 1, User-Product AssociationRule Model is an example of an insight. It symbolizes a set ofLogical rules (e.g., Canadian users with an age between x andy are likely to buy product z), which answer the question ofWhat are the most relevant products for each user group?.At run-time, this insight requires User’s demographics dataas input, in order to generate a list of Product(s) as the answerto the question. This insight is used on a Weekly basis andthe rules are mined from the dataset with a 60 months timeinterval. More examples of each modeling concept can befound in Figure 1.2) Analytics Design View: This view aims to (i) supportexploration of alternate approaches for the problem at hand,(ii) facilitate design of (machine learning) experiments andidentifying trade-offs, and (iii) support algorithm selection andmonitoring their performance over time. The main modelingelements are analytics goals, algorithms, softgoals, influences,and indic
This paper introduced a conceptual modeling framework for business analytics and illustrated some of its potential benefits in two cases. The cases were used as a preliminary validation of framework’s expressiveness and as a means to show potential use cases and to uncover limitations of the approach.