Transcription
Private Bag X44, Pretoria, 0001, South Africa, ISIbalo House, Koch Street, Salvokop, Pretoria, 0002www.statssa.gov.za, info@statssa.gov.za, Tel 27 12 310 8911Business impact surveyof the COVID-19 pandemicin South AfricaEmbargoed until:21 April 202010:00Enquiries:Krisseelan GovindenTel: 082 901 7960Email: krisseelang@statssa.gov.zaSagaren PillayTel: 082 905 2665Email: sagarenp@statssa.gov.zaAmukelani NgobeniTel: 082 677 4536Email: amukelanin@statssa.gov.za
STATISTICS SOUTH AFRICA2ContentsBackground . 1Survey information . 1Table 1 – Responding businesses by industry . 2Key results . 21.Financial performance . 2Figure 1 – Impact on business turnover . 3Figure 2 – Business turnover range by industry (cumulative % shown on horizontal axis) . 3Figure 3 – Trading status of businesses (cumulative % shown on horizontal axis) . 42.Workforce implications . 4Figure 4 – Expected changes to workforce size in the two weeks after the reference period . 5Figure 5 – Workforce measures implemented. 53.Business impact of COVID-19: other indicators . 6Figure 6 – Exporting of goods or services . 6Figure 7 – Importing of goods or services . 6Figure 8 – Access to materials, goods or services within South Africa . 7Figure 9 – Change in the prices of supplies . 7Figure 10 – Change in ability to access financial resources . 8Table 2 – Financial assistance initiatives . 8Figure 11 – Adequacy of financial resources . 9Figure 12 – Business survival . 9Figure 13 – Financial crisis (2008/2009) comparison . 10Figure 14 – Ability of workforce to meet business demands . 10Table 3 – Working remotely vs. normal place of work . 11Table 4 – Employee working status . 11Figure 15 – Robustness of IT systems . 12Figure 16 – Family commitment impact on ability to work remotely . 12Figure 17 – Impact on other financial and/or operating activities . 13Conclusion . 13EXPLANATORY NOTES . 14Business impact survey of the COVID-19 pandemic in South Africa, April 2020
STATISTICS SOUTH AFRICA1BackgroundThe COVID-19 pandemic has created profound disruptions to our economy and society. Many South Africanindustries are experiencing an adverse impact from the pandemic, which is consistent with other countriesfighting the disease. In its response to the crisis, the South African government has (from 27 March 2020)placed the country under a national lockdown to reduce the spread of the virus, resulting in the closure of manybusinesses. The businesses affected by the national lockdown are those that are not regarded as providingessential services. These industries include, amongst others, those reliant on the movement of goods (supplychain disruptions), the telecommunications sector, selected mining activities due to a decrease in demand forminerals, accommodation and tourism due to travel bans, construction, transport, and various services.Measuring the impact of the pandemic on the economy will depend heavily on information and related factsprovided by businesses who complete surveys conducted by Statistics South Africa (Stats SA). The actualimpact remains unknown until critical variables can be identified, including the duration of the pandemic andits intensity in terms of infection rates. The pandemic has highlighted the need to obtain accurate informationas close as possible to real time. Accordingly, Stats SA has set out to determine the impact on businessesand the economy at large by conducting an experimental study.The business impact study is administered through a basic survey focusing on financial performance relatedto the trading status, business impact, turnover, import and export of goods, purchases, price changes,financial burden and assistance, business survival, and workforce. The results include the aggregatedresponses from businesses based on a series of questions.Survey informationSurvey statusExperimental statistics aimed at providing an early indicator of the businessimpact resulting from COVID-19Selection criteriaSelected businesses operating within various industries in South Africa thatare registered for value added tax (VAT)Number of respondingbusinesses707Reference period30 March 2020 – 13 April 2020Business impact survey of the COVID-19 pandemic in South Africa, April 2020
STATISTICS SOUTH AFRICA2Table 1 – Responding businesses by industryIndustryNumber ofbusinesses% contributionForestry & fishingMining & quarryingManufacturingElectricity, gas & water supplyConstructionTradeTransport, storage & communicationReal estate & other business servicesCommunity, social & personal 510,07,46,22,634,0Total707100Key results The majority of responding businesses (85,4%) reported turnover below the normal range. 46,4% indicated temporary closure or paused trading activity. 50,4% expected their workforce size to stay the same in the two weeks after the survey, while 36,8%reported that their workforce size is expected to decrease. 28,3% indicated that their workforce has decreased working hours and 19,6% reported laying off ofstaff in the short term. 19,1% indicated that prices of materials, goods or services purchased increased more than normal. Access to financial resources: 23,8% indicated a decrease while 52,6% indicated access to financialresources remained the same. 38,2% of businesses applying for financial assistance reported that they would use government reliefschemes. 30,6% indicated they can survive less than a month without any turnover, while 54,0% can survivebetween 1 and 3 months. 46,3% of the workforce were able to meet business demands, and 43,0% of the workforce were notable to meet business demands (the rest reported ‘unsure’).1.Financial performanceTurnover relates to the income generated by a business when conducting its core operations within a specifiedtimeframe, and forms a key measure of business performance. According to the Annual Financial Statisticssurvey conducted by Stats SA, turnover includes sales of goods, services rendered, leasing and hiring ofcapital assets, and rental/leasing of land, buildings and other structures.Business impact survey of the COVID-19 pandemic in South Africa, April 2020
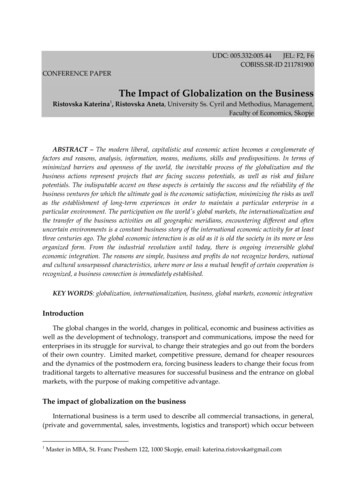
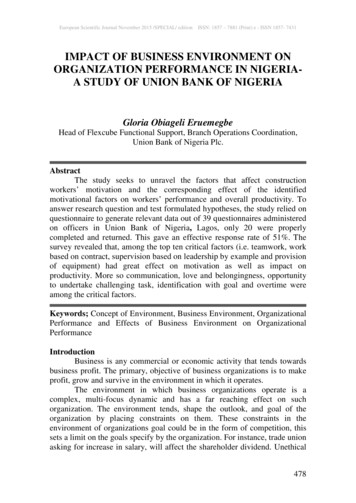
STATISTICS SOUTH AFRICA3The survey showed that 85,4% of responding businesses had turnover that was lower than their normal range;1,3% reported that turnover was higher than their normal range; and 13,3% reported that turnover was withintheir normal range (Figure 1). This was for the two-week reference period covered by the survey.Figure 1 – Impact on business turnoverTurnover was belowthe normal range85,4%Turnover was abovethe normal range1,3%Turnover was withinthe normal range13,3%0%10%20%30%40%50%60%70%80%90%Figure 2 shows a widespread adverse impact of the COVID-19 pandemic on business turnover across allindustries. The industries reporting the highest proportions within the normal range were mining and quarrying;electricity, gas and water; and community, social and personal services. A limited number of respondentsoperating within the manufacturing, construction and trade sectors indicated that their turnover was above thenormal range. The sub-sectors that indicated turnover above the normal range included architectural andengineering services, manufacturing of grain mill products, manufacturing of chemicals, and trade in householdgoods.Figure 2 – Business turnover range by industry (cumulative % shown on horizontal axis)Forestry & FishingMining & quarryingManufacturingElectricity, gas & water supplyConstructionTradeTransport, storage & communicationReal estate & other business servicesCommunity, social & personal servicesOther0%Turnover was above the normal range20%40%Turnover was below the normal rangeBusiness impact survey of the COVID-19 pandemic in South Africa, April 202060%80%100%Turnover was within the normal range
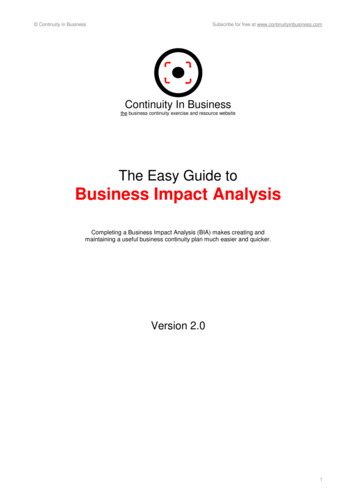
STATISTICS SOUTH AFRICA4Figure 3 shows that a low proportion of businesses continued to trade at full capacity. The proportion tradingat full capacity ranged from zero in construction to 30,0% in forestry and fishing, and the total was 12,3%.Almost half (46,4%) reported ‘temporarily closed or paused trading’.Figure 3 – Trading status of businesses (cumulative % shown on horizontal axis)TotalOtherCommunity, social & personal servicesReal estate & other business servicesTransport, storage & communicationTradeConstructionElectricity, gas & water supplyManufacturingMining & quarryingForestry & Fishing0%2.10%20%30%40%50%60%70%80%Continuing to trade at full capacityContinuing to trade partiallyHas permanently ceased tradingHas temporarily closed or paused trading90%100%Workforce implicationsThe full impact of the COVID-19 pandemic on employment will be determined over time; employment tends tobe a lagging economic indicator. Particularly vulnerable are workers with underlying health conditions andthose more sensitive to labour market conditions, e.g. construction workers. Businesses were requested toindicate their expectations with regard to changes in workforce size due to the pandemic – see Figure 4.Business impact survey of the COVID-19 pandemic in South Africa, April 2020
STATISTICS SOUTH AFRICA5Figure 4 – Expected changes to workforce size in the two weeks after the reference t workforce size toincreaseExpect workforce size todecreaseExpect workforce size tostay the sameNot sureResults from the survey indicate that 50,4% of businesses expected their workforce size to stay the same overthe two weeks after the reference period, 36,8% reported that their workforce size is expected to decrease,12,4% were not sure, and 0,4% expected their workforce size to increase.Businesses were also requested to indicate what measures were taken to cope with the impact of COVID-19on their workforce, illustrated in Figure 5.Figure 5 – Workforce measures 0%0,7%0%Increased working Decreased working Laying off staff in the Recruiting staff forhourshoursshort termthe short termBusiness impact survey of the COVID-19 pandemic in South Africa, April 2020OtherNo measures havebeen taken
STATISTICS SOUTH AFRICA6Approximately half of respondents indicated either decreased working hours (28,3%) or laying off of staff inthe short term (19,6%); 25,3% reported ‘other’ measures taken; 24,0% reported no measures taken; 2,0%reported increased working hours; and 0,7% will be recruiting staff in the short term.3.Business impact of COVID-19: other indicatorsFigure 6 – Exporting of goods or orting was notaffectedNot sure0%Exporting was affectedNot applicableFor the two weeks of the reference period, 34,6% of responding businesses indicated that exporting of goodsand services was affected by COVID-19.Figure 7 – Importing of goods or rting was affectedImporting was notaffectedNot sureNot applicableApproximately 40% of responding businesses indicated that importing of goods and services was affected byCOVID-19.Business impact survey of the COVID-19 pandemic in South Africa, April 2020
STATISTICS SOUTH AFRICA7Figure 8 – Access to materials, goods or services within South %We have been able to getwhat we neededWe have had to change We have not been able to getsuppliers or find alternativethe materials, goods orsolutionsservices we neededNot applicableAlmost 38% of
Industry Number of businesses % contribution Forestry & fishing 10 1,4 Mining & quarrying 35 5,0 Manufacturing 180 25,5 Electricity, gas & water supply 18 2,6 Construction 39 5,5 Trade 71 10,0 Transport, storage & communication 52 7,4 Real estate & other business services 44 6,2 Community, social & personal services 18 2,6 Other 240 34,0 Total 707 100 Key results The majority of responding .